Overview
Case Data sections let you add details about a Workflow Case for which you have viewing permissions to a report. When adding Case Data sections to a report, you must first select the Case whose data you want to add to the report. Then you can select which Case Data sections to add to the report and customize them as desired.
Before You Start
User Roles
- To add Case Data sections to a report, your user account must have an Organization role of Standard User, Sharing User, or Organization Administrator.
Prerequisites
- To be able to add data from Cases to a report, turn on Workflow for your Organization on the Account Settings screen (must be an Accounts Administrator, Operations Administrator, or System Administrator to perform this action).
Adding a Case Data Section
Follow these steps to add a Case Data section to a report:
- Create a new report or open a saved report.
- If the Add Section drawer does not open automatically in the Report Editor, click + Add Section in the Report Editor toolbar. Alternatively, hover over an existing section in the report and click + Add Above or + Add Below.
- Select Case Data under the Intelligence Data section on the Add Section drawer.
- Select a Case from the Case dropdown on the Add Case Data menu.
- Select a Case Data section from the Add Case Data menu, and then configure the section.
Selecting a Case
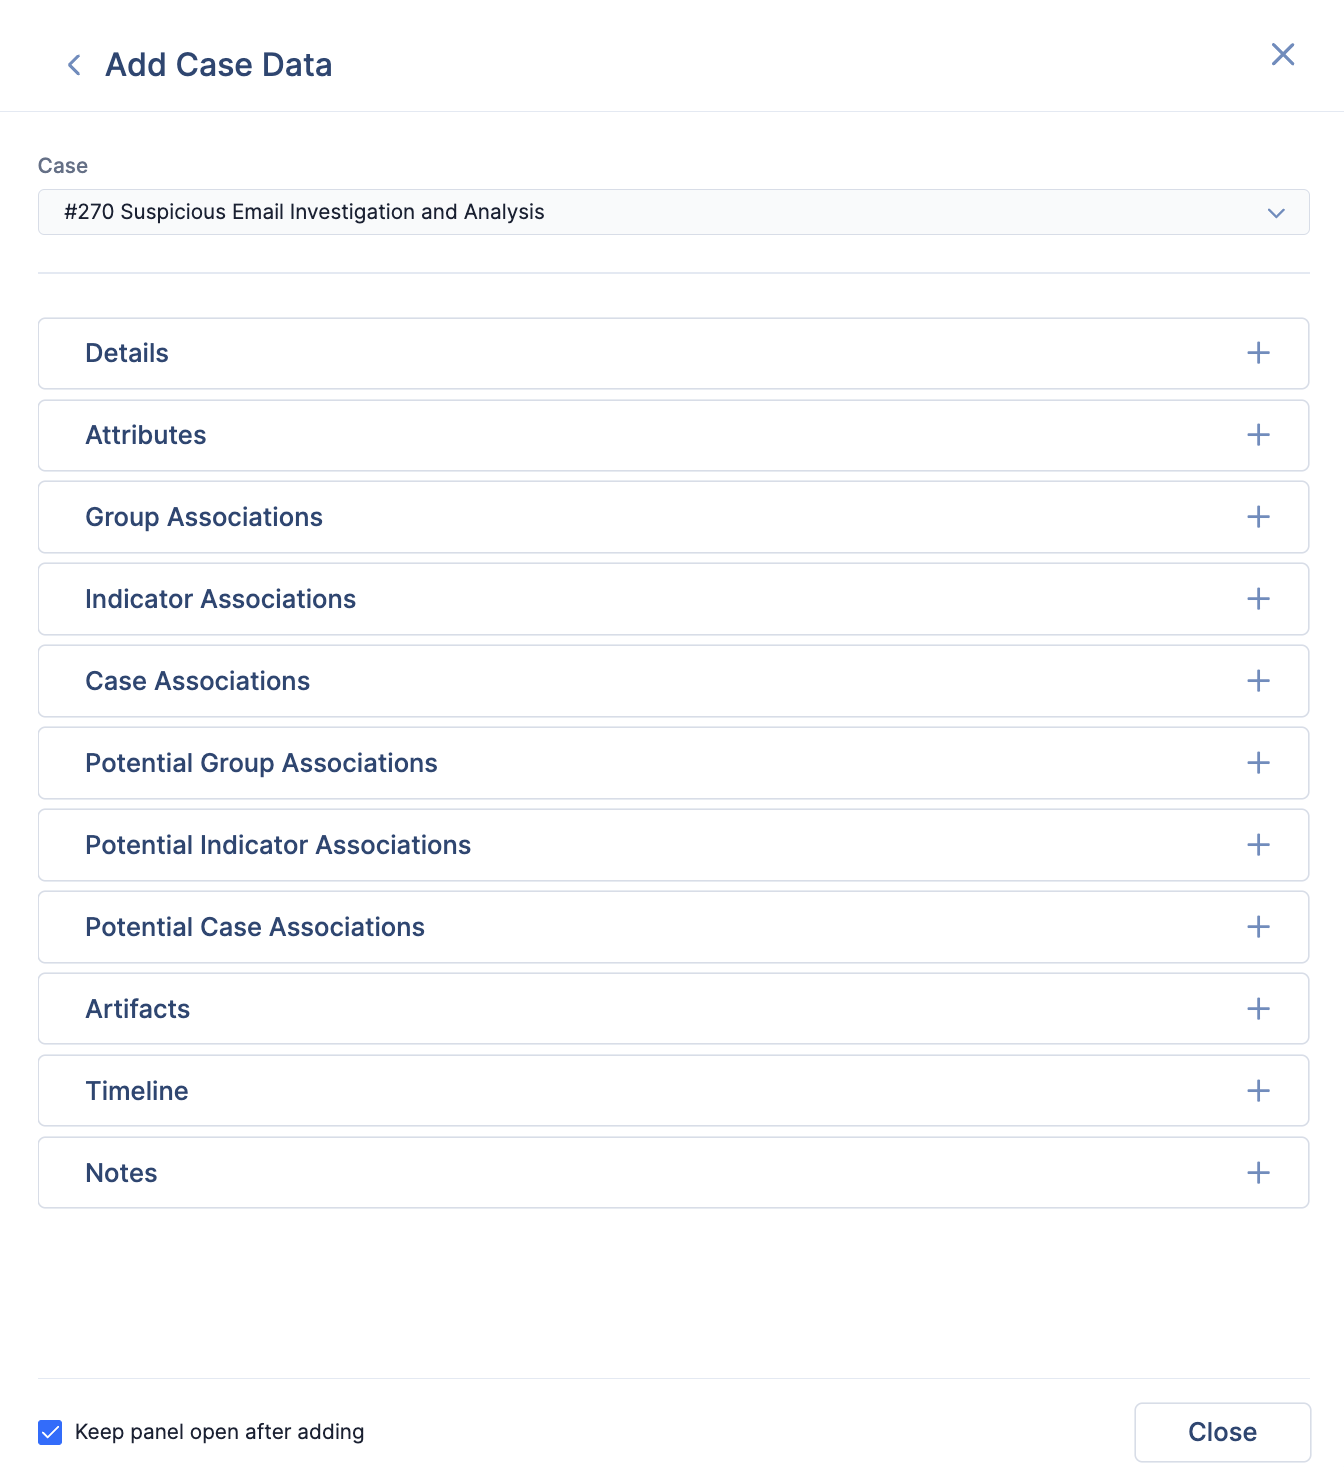
After you select Case Data under the Intelligence Data section on the Add Section drawer, the Add Case Data menu will open. If you created a report while viewing a Case, the Add Case Data menu will show that Case in the Case dropdown, as well as the Case Data sections you can add to the report (Figure 1).
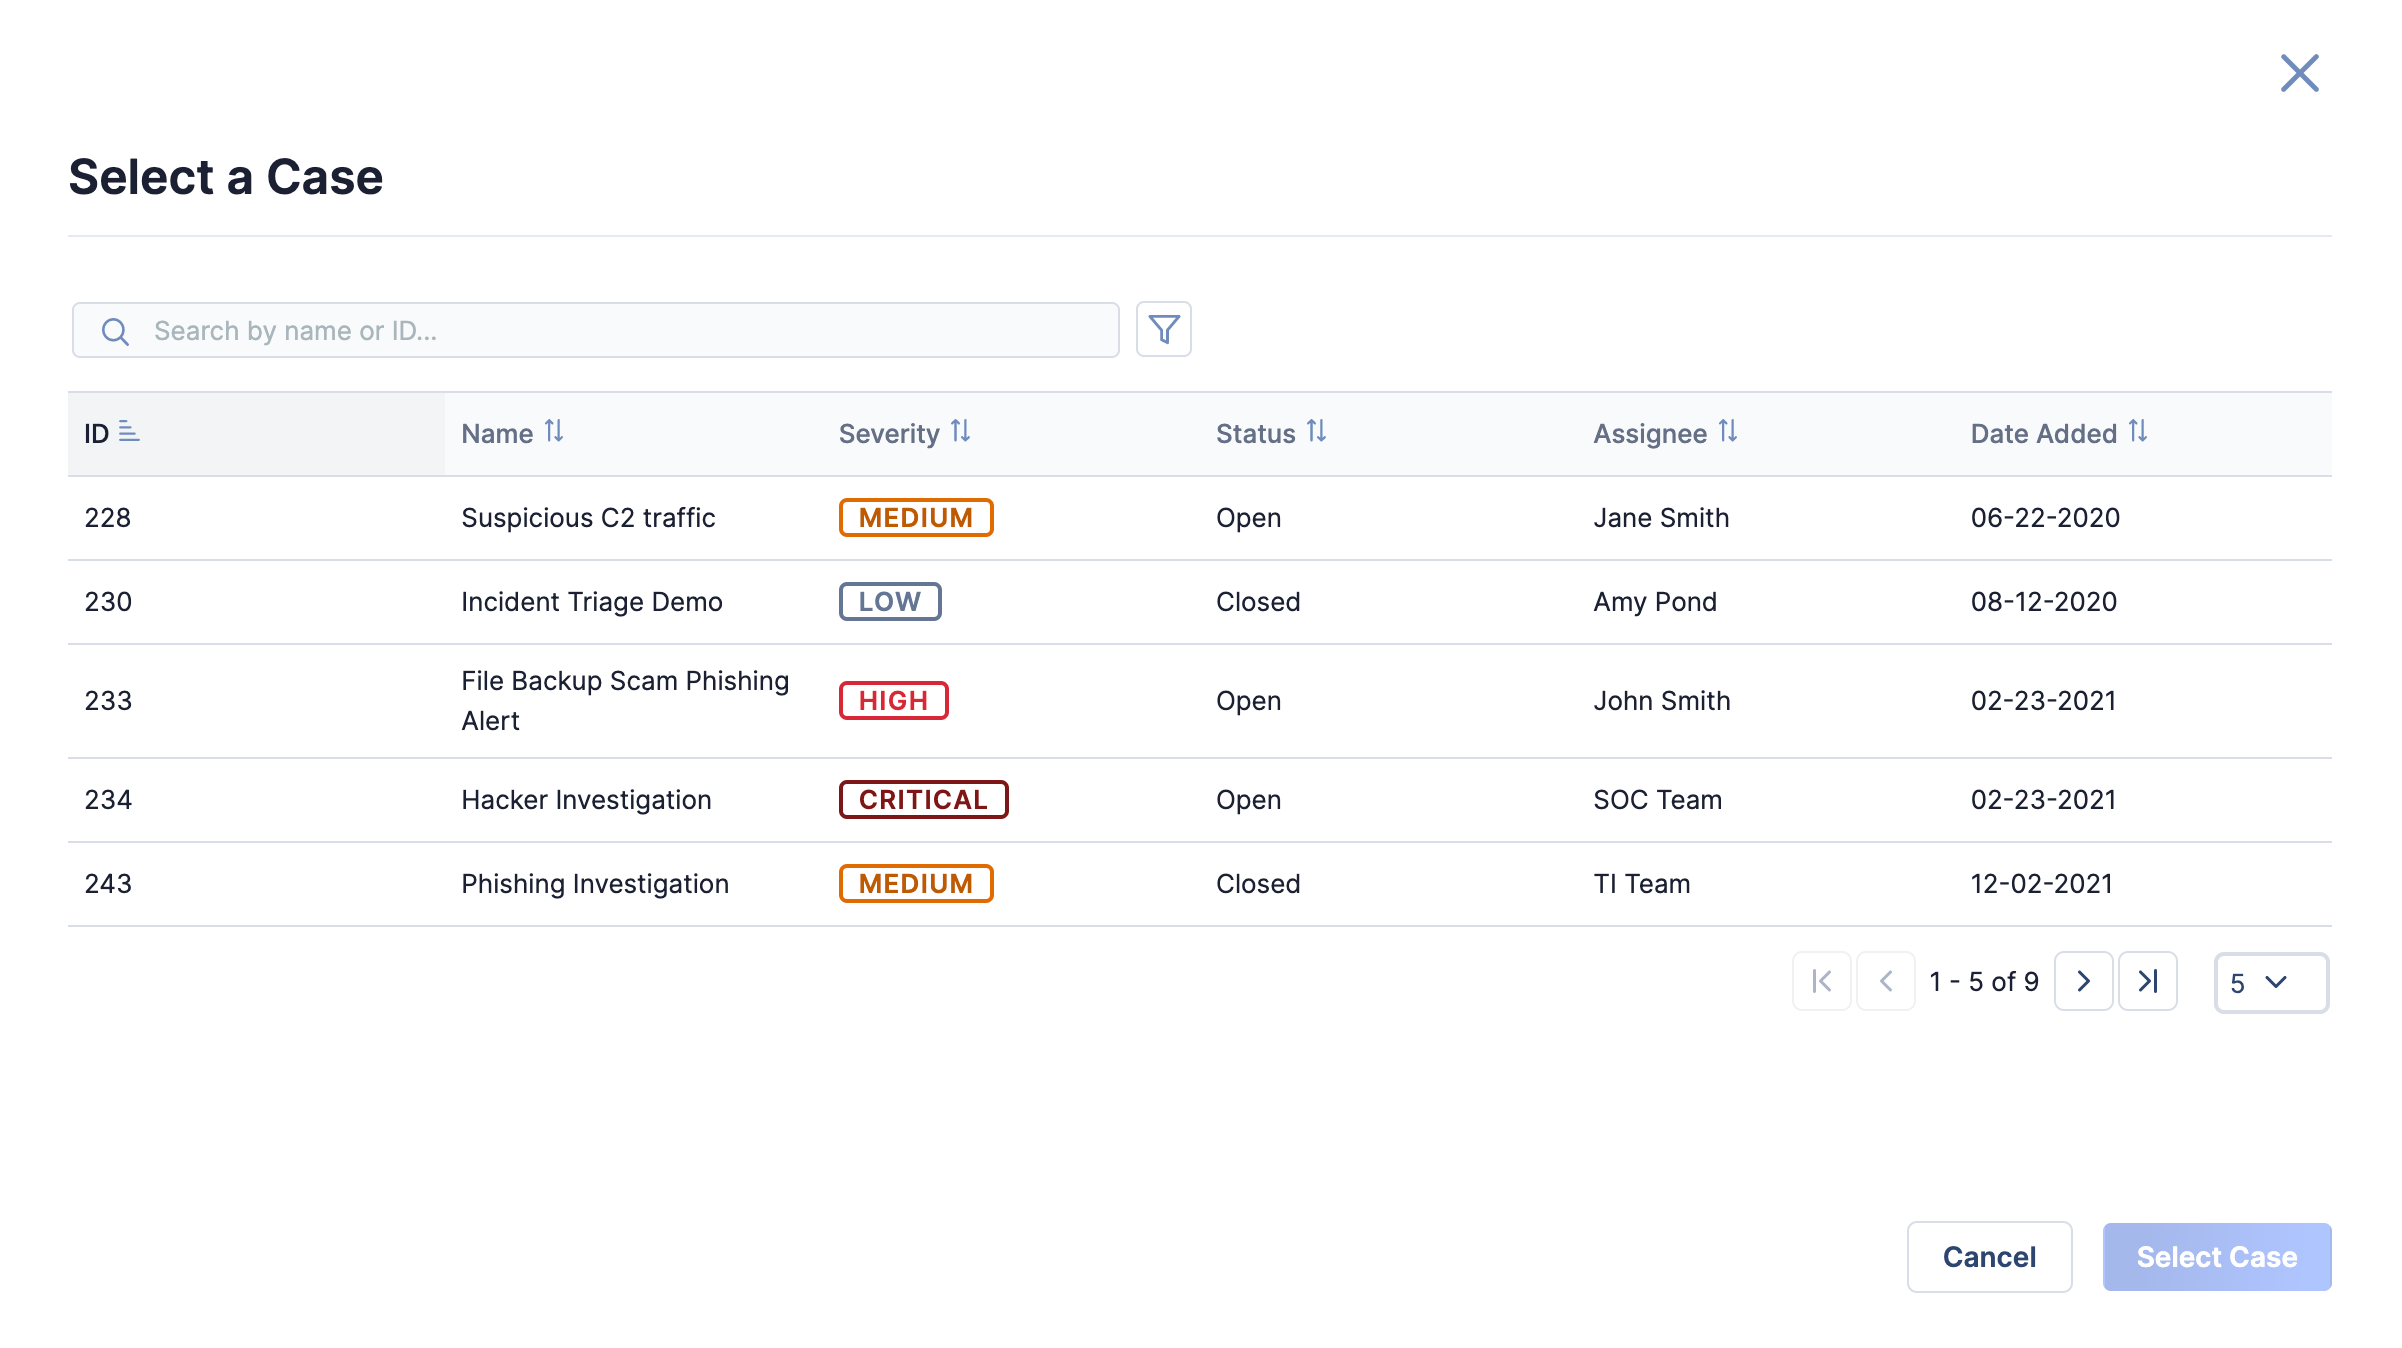
If you created a report from a Group’s Details screen, a Group’s Details drawer, or the Reporting screen, select View All Cases… from the Case dropdown. Then select the Case whose data you want to add to the report on the Select a Case window, which shows all Cases in your Organization for which you have viewing permissions (Figure 2).
Case Data Sections
You can add any of the following Case Data sections to a report:
- Details
- Attributes
- Group Associations
- Indicator Associations
- Case Associations
- Potential Group Associations
- Potential Indicator Associations
- Potential Case Associations
- Artifacts
- Timeline
- Notes
A Case Data section can display data from a single Case; however, you can return to the Add Section drawer to add multiple Case Data sections containing data from multiple Cases to a single report.
Details
The Details section can be used to display basic information about the selected Case, including its resolution, status, and severity and data available on its Case Details card. To add this section to a report, select Details from the Add Case Data menu (Figure 1). The Add Details menu will be displayed (Figure 3).
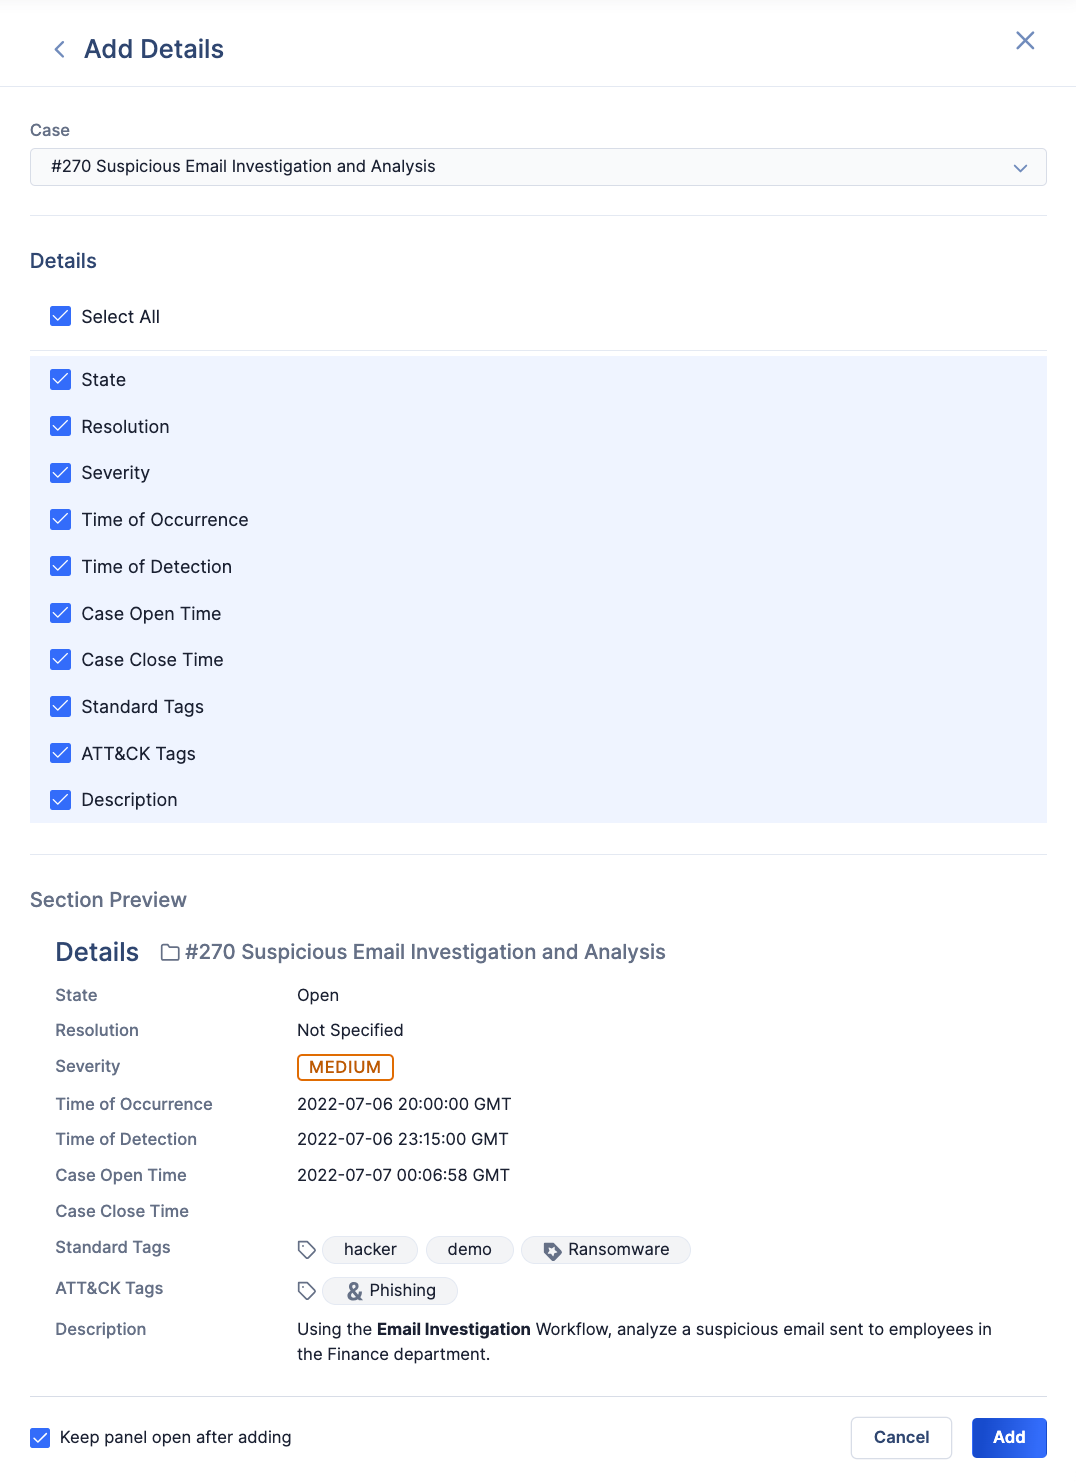
- Case: Use the dropdown to change the Case whose data will be used in the section, if desired.
- Details: To include all available Case data options in the Details section, select the Select All checkbox; otherwise, select the checkbox for each Case data option you want to include in the Details section. Available Case data options include the following:
- State: The Case’s status.
- Resolution: The Case’s resolution.
- Severity: The Case’s severity level.
- Time of Occurrence: The date and time when the security incident for which the Case was opened took place.
- Time of Detection: The date and time when the security incident for which the Case was opened was detected (e.g., by a security team).
- Case Open Time: The date and time when the Case was opened.
- Case Close Time: The date and time when the Case was closed.
- Standard Tags: The standard Tag(s) applied to the Case.
- ATT&CK Tags: The ATT&CK® Tag(s) applied to the Case.
- Description: The Case’s description.
- Section Preview: This section displays a preview of the Details section that will be added to the report.
- Click Add to add the section to the report.
Attributes
The Attributes section can be used to display the following information about Attributes added to the selected Case:
- The Attribute’s type
- The Attribute’s source
- The date when the Attribute was created
- The date when the Attribute was last modified
- The Attribute’s value
To add this section to a report, select Attributes from the Add Case Data menu (Figure 1). The Add Attributes menu will be displayed (Figure 4).
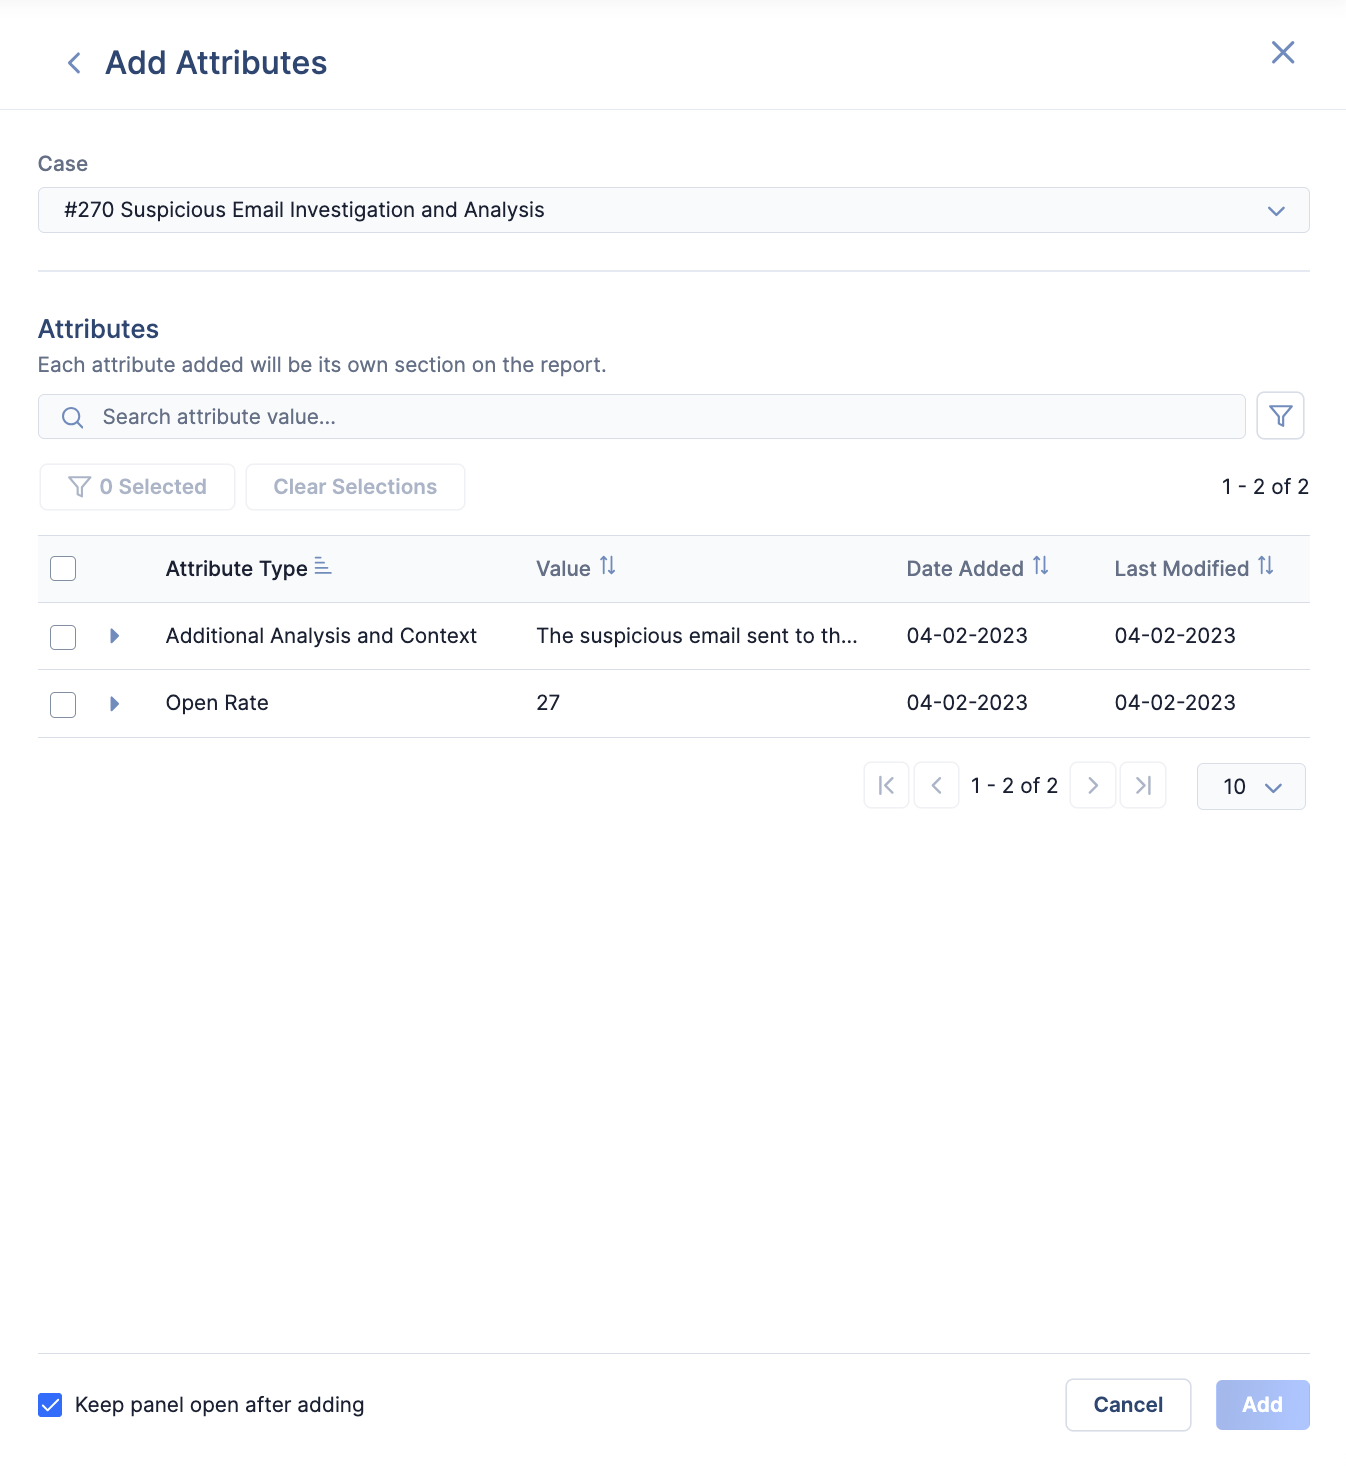
- Case: Use the dropdown to change the Case whose data will be used in the section, if desired.
- Attributes: Select the checkbox for each Attribute to add to the report, or select the checkbox in the table’s header to select all Attributes on the current table page. To preview how an Attribute will look in the report, click
 to the left of the Attribute.NoteWhen you select one or more Attributes in the table, the Selected button at the top left of the table will show the current number of selected Attributes. To view only the Attributes currently selected in the table, click Selected.
 - Click Add to add a section to the report for each selected Attribute.
Group Associations
The Group Associations section can be used to display information about Groups associated to the selected Case in a tabular format. To add this section to a report, select Group Associations from the Add Case Data menu (Figure 1). The Add Group Associations menu will be displayed (Figure 5).
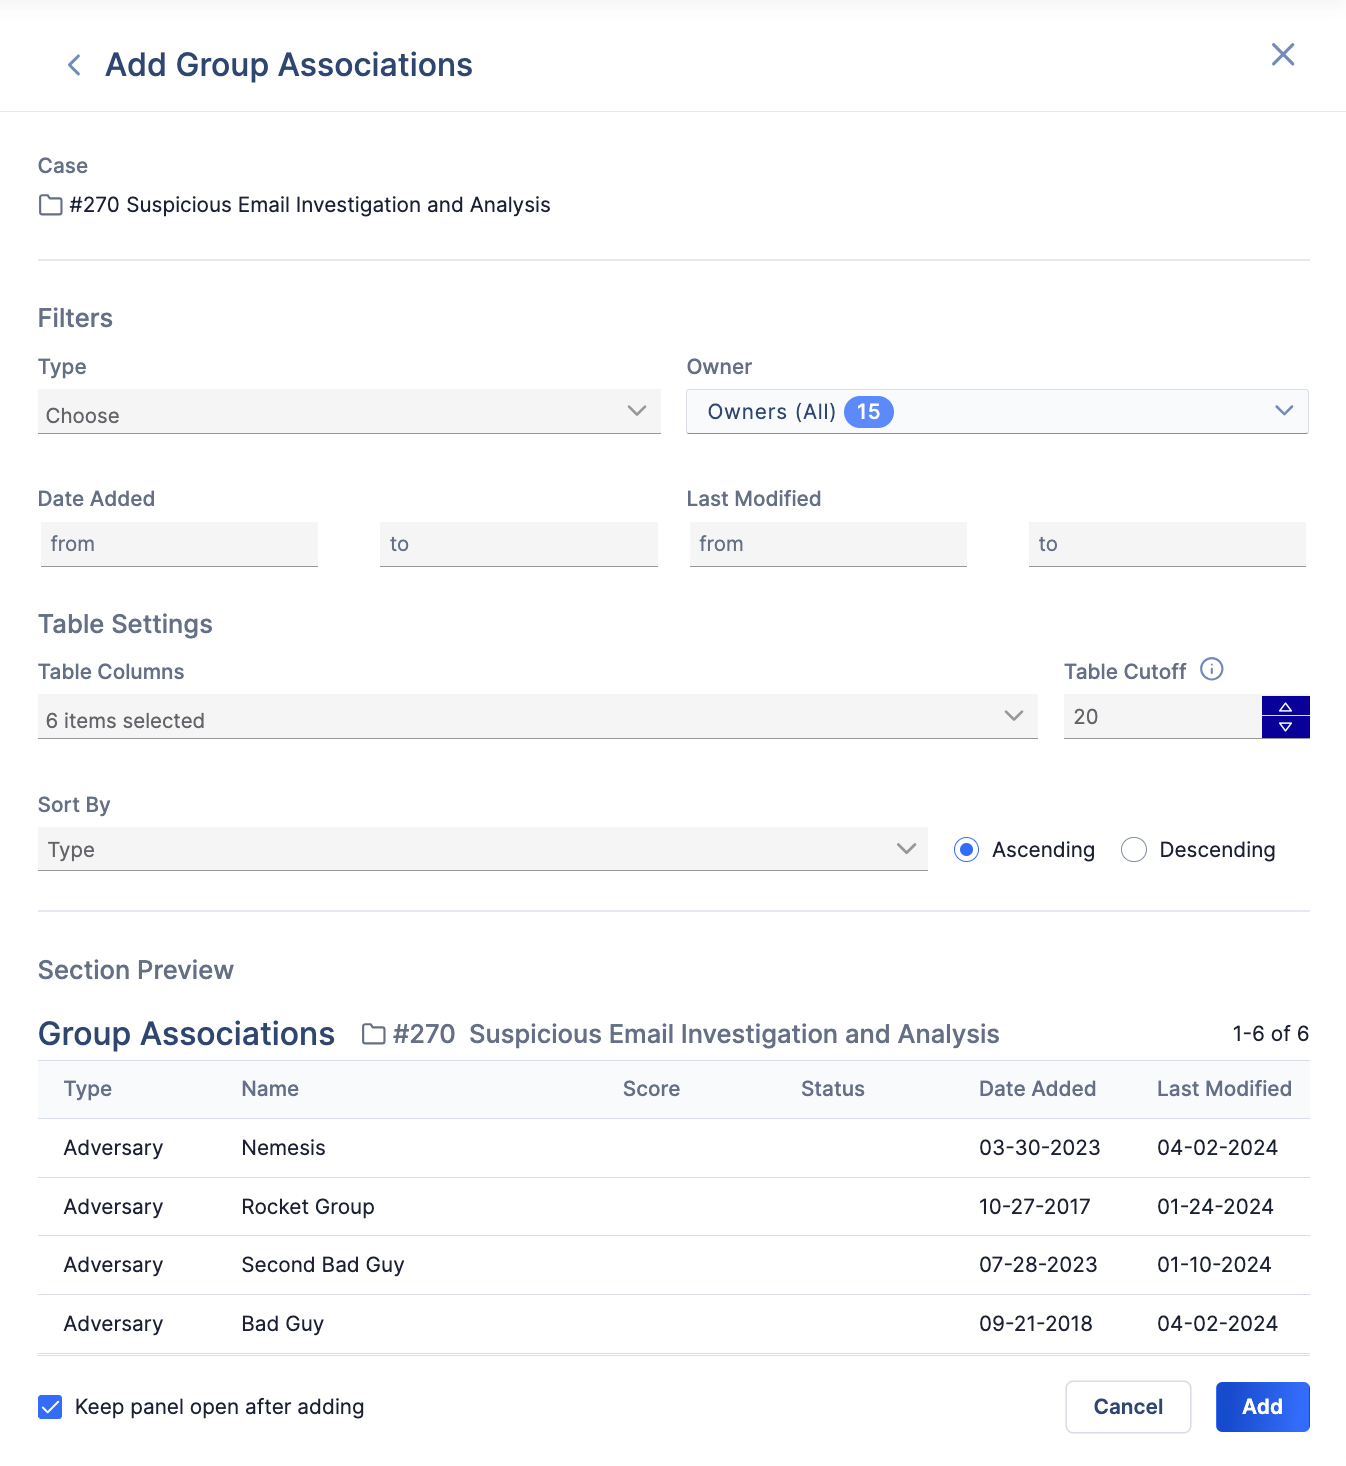
- Filters: By default, Groups of all types belonging to any owner to which you have access will be displayed in the Group Associations table. If desired, use the following options in this section to filter Groups displayed in the table:
- Type: Select one or more Group types. Only Groups of the selected type(s) will be displayed in the table.
- Owner: Select one or more owners. Only Groups that belong to the selected owner(s) will be displayed in the table.
- Date Added: Click the from and to fields and use the date selectors to select the beginning and end of a date range, respectively. Only Groups that were created within the specified range will be displayed in the table.
- Last Modified: Click the from and to fields and use the date selectors to select the beginning and end of a date range, respectively. Only Groups that were last modified within the specified range will be displayed in the table.
- Table Settings: Use the following options in this section to customize the display settings for the Group Associations table:
- Table Columns: By default, all available table columns will be displayed in the table. To prevent a table column from being displayed in the table, clear the checkbox corresponding to its name.
- Table Cutoff: Enter the maximum number of Groups to display in the table. The minimum value you can enter is 5, and the maximum value you can enter is 80.
- Sort By: Select the table column by which to sort Groups in the table. You can sort Groups by any table column, including those not displayed in the table.
- Ascending/Descending: Select whether to sort Groups in ascending or descending order. The sort order will correspond to the column by which the table is sorted.
- Section Preview: This section displays a preview of the Group Associations table that will be added to the report.
- Click Add to add the section to the report.
Indicator Associations
The Indicator Associations section can be used to display information about Indicators associated to the selected Case in a tabular format. To add this section to a report, select Indicator Associations from the Add Case Data menu (Figure 1). The Add Indicator Associations menu will be displayed (Figure 6).
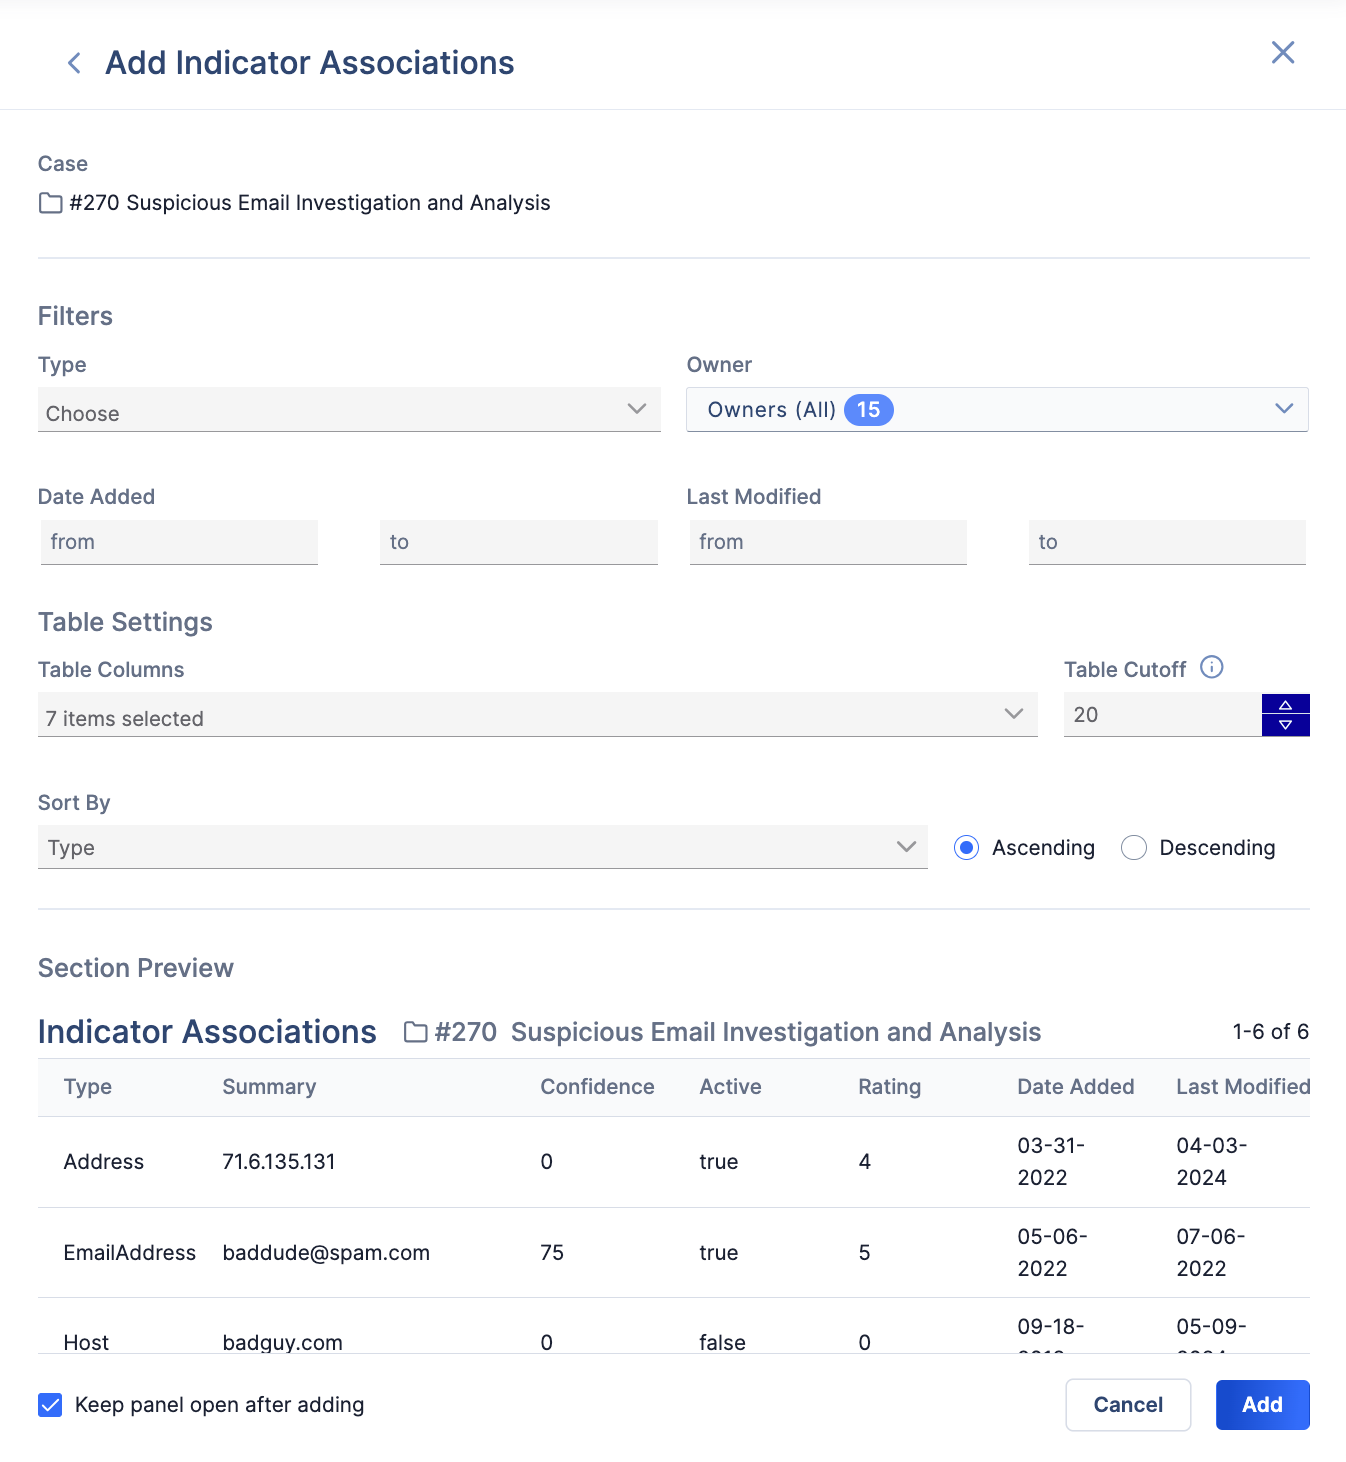
- Filters: By default, Indicators of all types belonging to any owner to which you have access will be displayed in the Indicator Associations table. If desired, use the following options in this section to filter Indicators displayed in the table:
- Type: Select one or more Indicator types. Only Indicators of the selected type(s) will be displayed in the table.
- Owner: Select one or more owners. Only Indicators that belong to the selected owner(s) will be displayed in the table.
- Date Added: Click the from and to fields and use the date selectors to select the beginning and end of a date range, respectively. Only Indicators that were created within the specified range will be displayed in the table.
- Last Modified: Click the from and to fields and use the date selectors to select the beginning and end of a date range, respectively. Only Indicators that were last modified within the specified range will be displayed in the table.
- Table Settings: Use the following options in this section to customize the display settings for the Indicator Associations table:
- Table Columns: By default, all available table columns will be displayed in the table. To prevent a table column from being displayed in the table, clear the checkbox corresponding to its name.
- Table Cutoff: Enter the maximum number of Indicators to display in the table. The minimum value you can enter is 5, and the maximum value you can enter is 80.
- Sort By: Select the table column by which to sort Indicators in the table. You can sort Indicators by any table column, including those not displayed in the table.
- Ascending/Descending: Select whether to sort Indicators in ascending or descending order. The sort order will correspond to the column by which the table is sorted.
- Section Preview: This section displays a preview of the Indicator Associations table that will be added to the report.
- Click Add to add the section to the report.
Case Associations
The Case Associations section can be used to display information about Cases associated to the selected Case in a tabular format. To add this section to a report, select Case Associations from the Add Case Data menu (Figure 1). The Add Case Associations menu will be displayed (Figure 7).
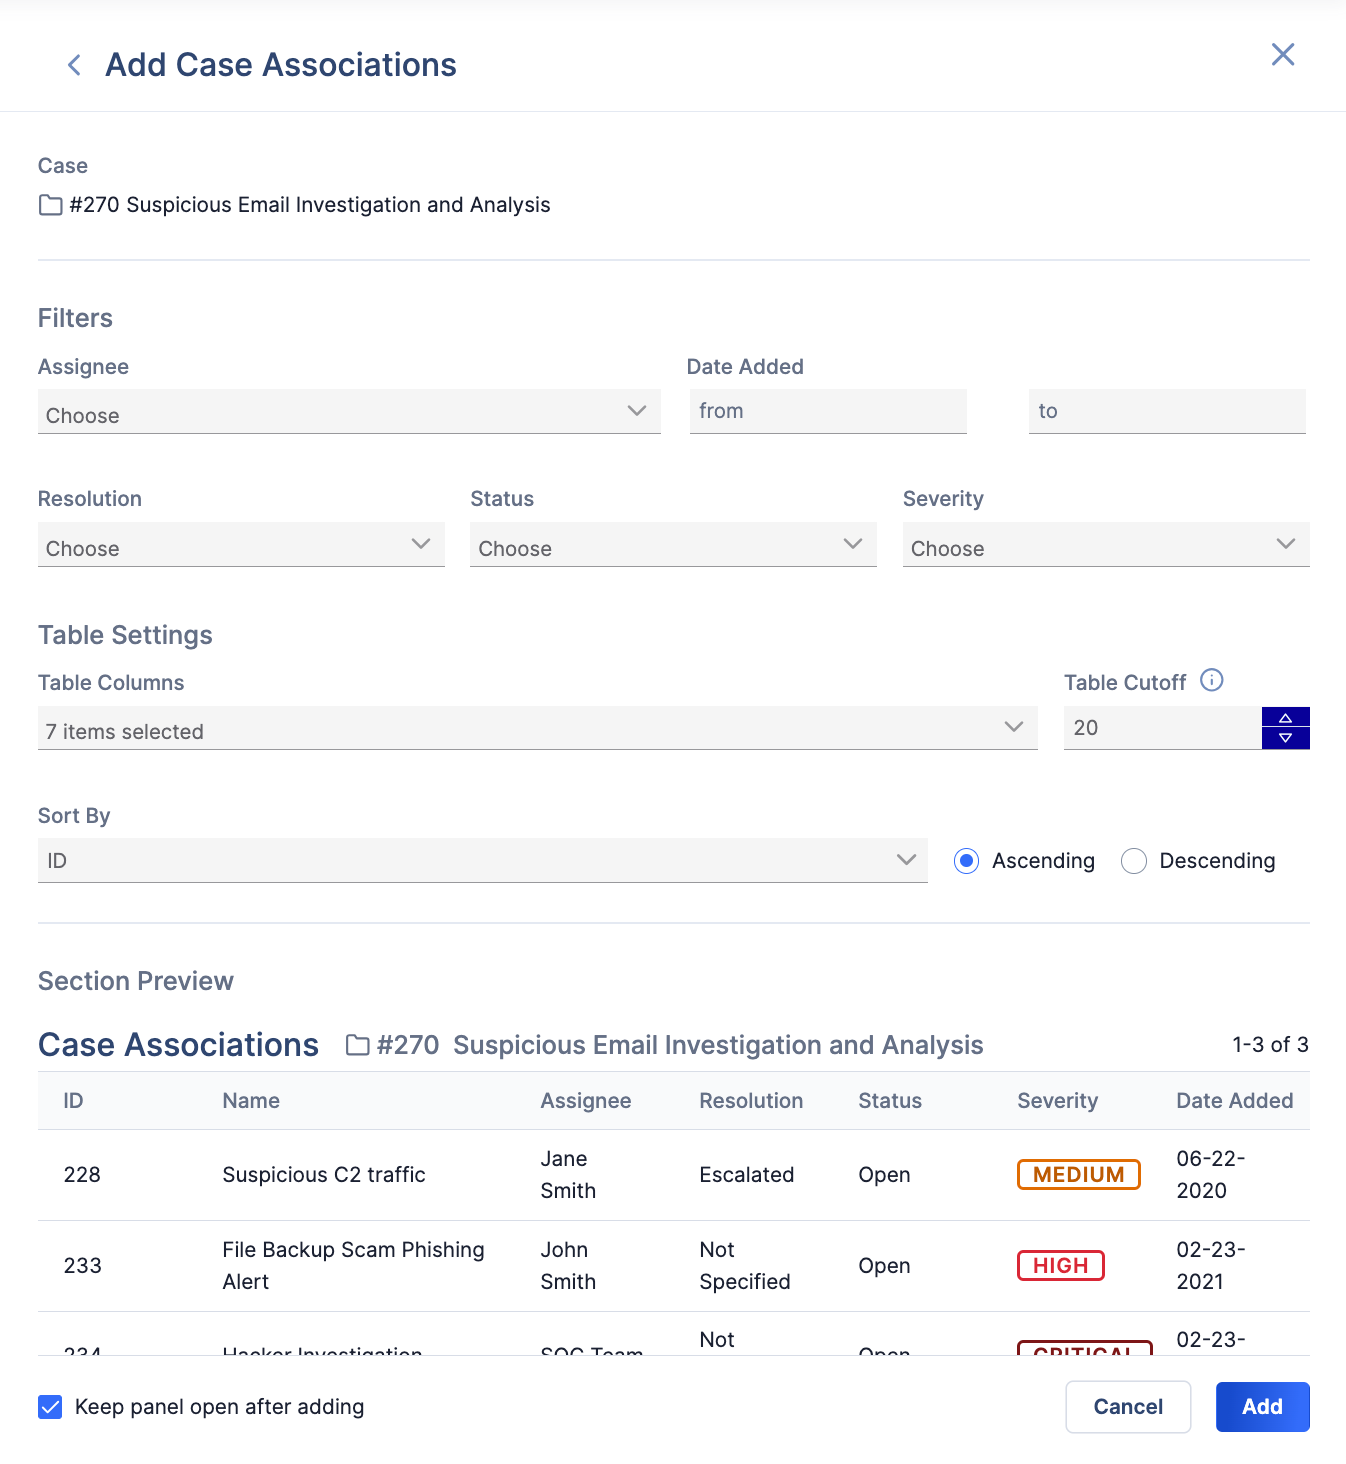
- Filters: By default, all associated Cases will be displayed in the Case Associations table. If desired, use the following options in this section to filter Cases displayed in the table:
- Assignee: Select one or more Case assignees. Only Cases assigned to the selected assignee(s) will be displayed in the table.
- Date Added: Click the from and to fields and use the date selectors to select the beginning and end of a date range, respectively. Only Cases that were created within the specified range will be displayed in the table.
- Resolution: Select one or more Case resolutions. Only Cases with the selected resolution(s) will be displayed in the table. If a selected resolution is not assigned to any of the Cases, then no Cases will be displayed in the table.
- Status: Select one or more Case statuses. Only Cases with the selected status(es) will be displayed in the table. If a selected status is not assigned to any of the Cases, then no Cases will be displayed in the table.
- Severity: Select one or more Case severity levels. Only Cases with the selected severity level(s) will be displayed in the table. If a selected severity level is not assigned to any of the Cases, then no Cases will be displayed in the table.
- Table Settings: Use the following options in this section to customize the display settings for the Case Associations table:
- Table Columns: By default, all available table columns will be displayed in the table. To prevent a table column from being displayed in the table, clear the checkbox corresponding to its name.
- Table Cutoff: Enter the maximum number of Cases to display in the table. The minimum value you can enter is 5, and the maximum value you can enter is 80.
- Sort By: Select the table column by which to sort Cases in the table. You can sort Cases by any table column, including those not displayed in the table.
- Ascending/Descending: Select whether to sort Cases in ascending or descending order. The sort order will correspond to the column by which the table is sorted.
- Section Preview: This section displays a preview of the Case Associations table that will be added to the report.
- Click Add to add the section to the report.
Potential Group Associations
The Potential Group Associations section can be used to display information about Groups suggested as associations to the selected Case in a tabular format. To add this section to a report, select Potential Group Associations from the Add Case Data menu (Figure 1). The Add Potential Group Associations menu will be displayed (Figure 8).
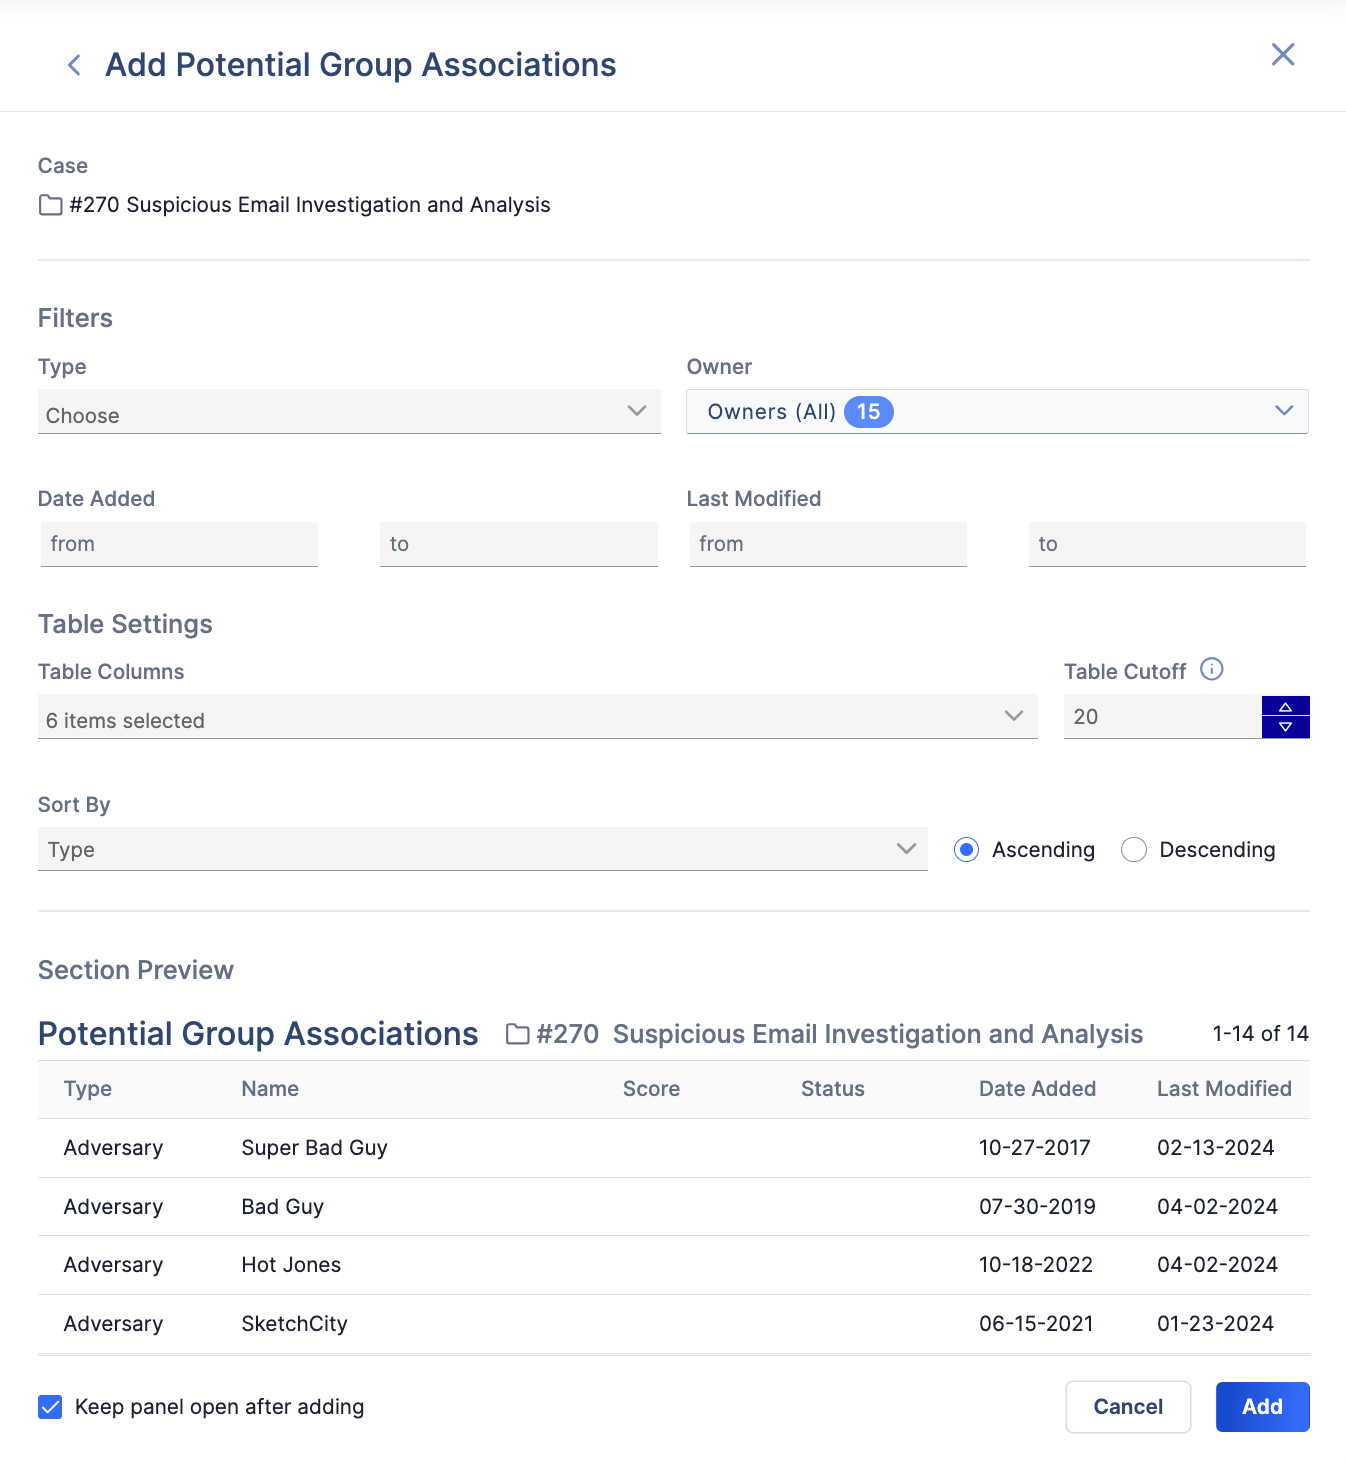
See the “Group Associations” section for descriptions of the configuration options available for the Potential Group Associations section, as they are the same configuration options available for the Group Associations section.
Potential Indicator Associations
The Potential Indicator Associations section can be used to display information about Indicators suggested as associations to the selected Case in a tabular format. To add this section to a report, select Potential Indicator Associations from the Add Case Data menu (Figure 1). The Add Potential Indicator Associations menu will be displayed (Figure 9).
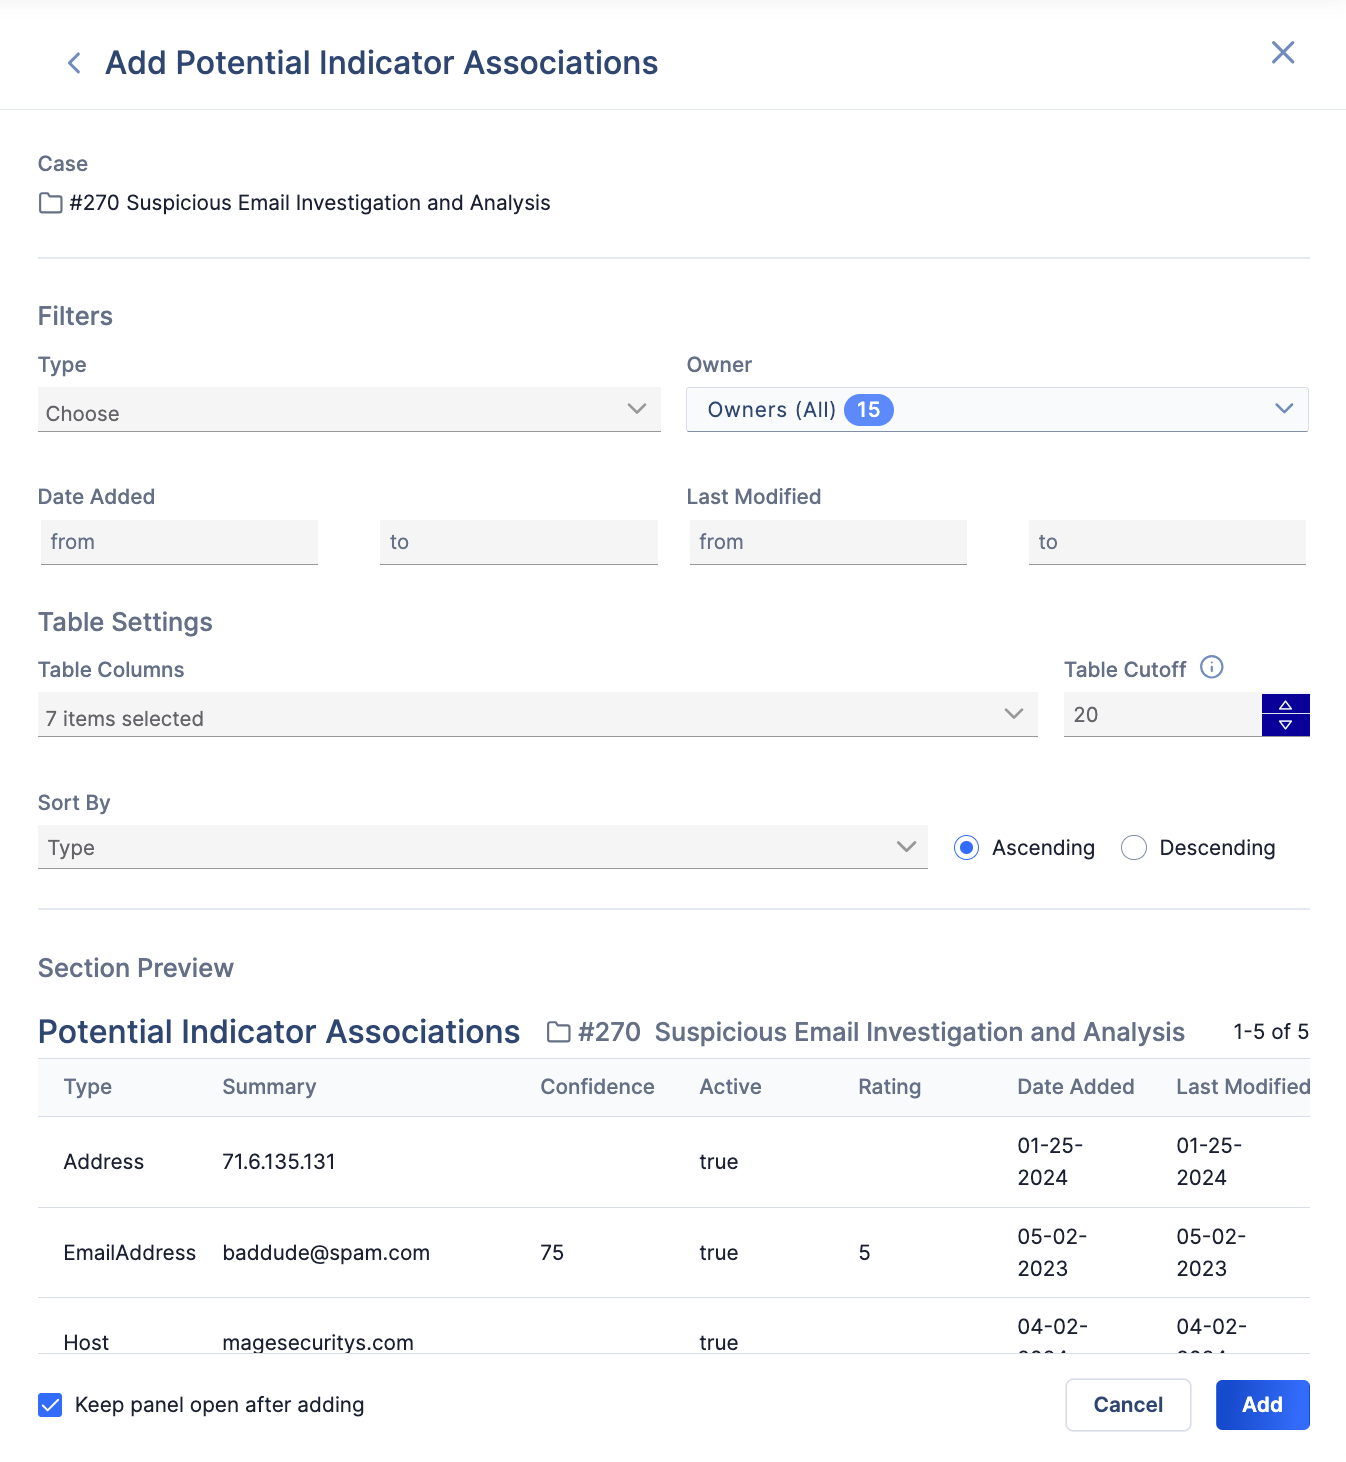
See the “Indicator Associations” section for descriptions of the configuration options available for the Potential Indicator Associations section, as they are the same configuration options available for the Indicator Associations section.
Potential Case Associations
The Potential Case Associations section can be used to display information about Cases suggested as associations to the selected Case in a tabular format. To add this section to a report, select Potential Case Associations from the Add Case Data menu (Figure 1). The Add Potential Case Associations menu will be displayed (Figure 10).
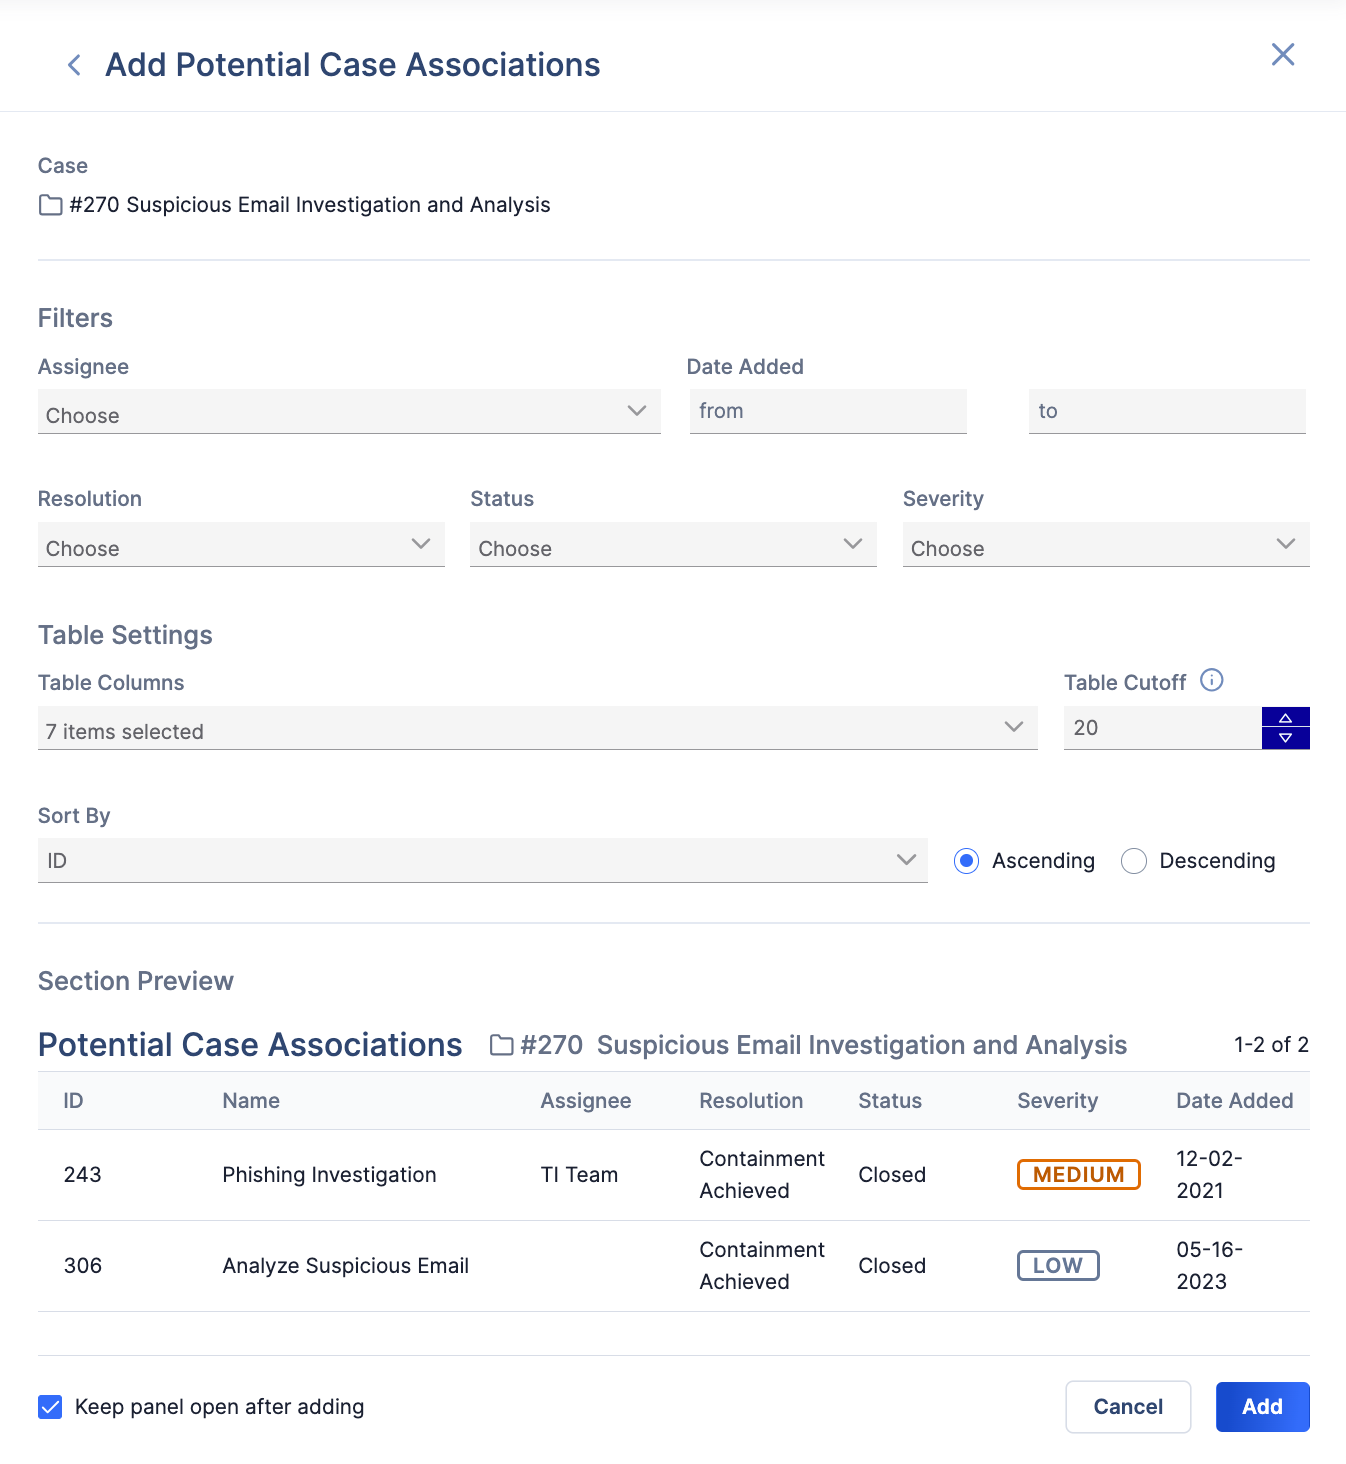
See the “Case Associations” section for descriptions of the configuration options available for the Potential Case Associations section, as they are the same configuration options available for the Case Associations section.
Artifacts
The Artifacts section can be used to display information about Artifacts added to the selected Case in a tabular format. To add this section to a report, select Artifacts from the Add Case Data menu (Figure 1). The Add Artifacts menu will be displayed (Figure 11).
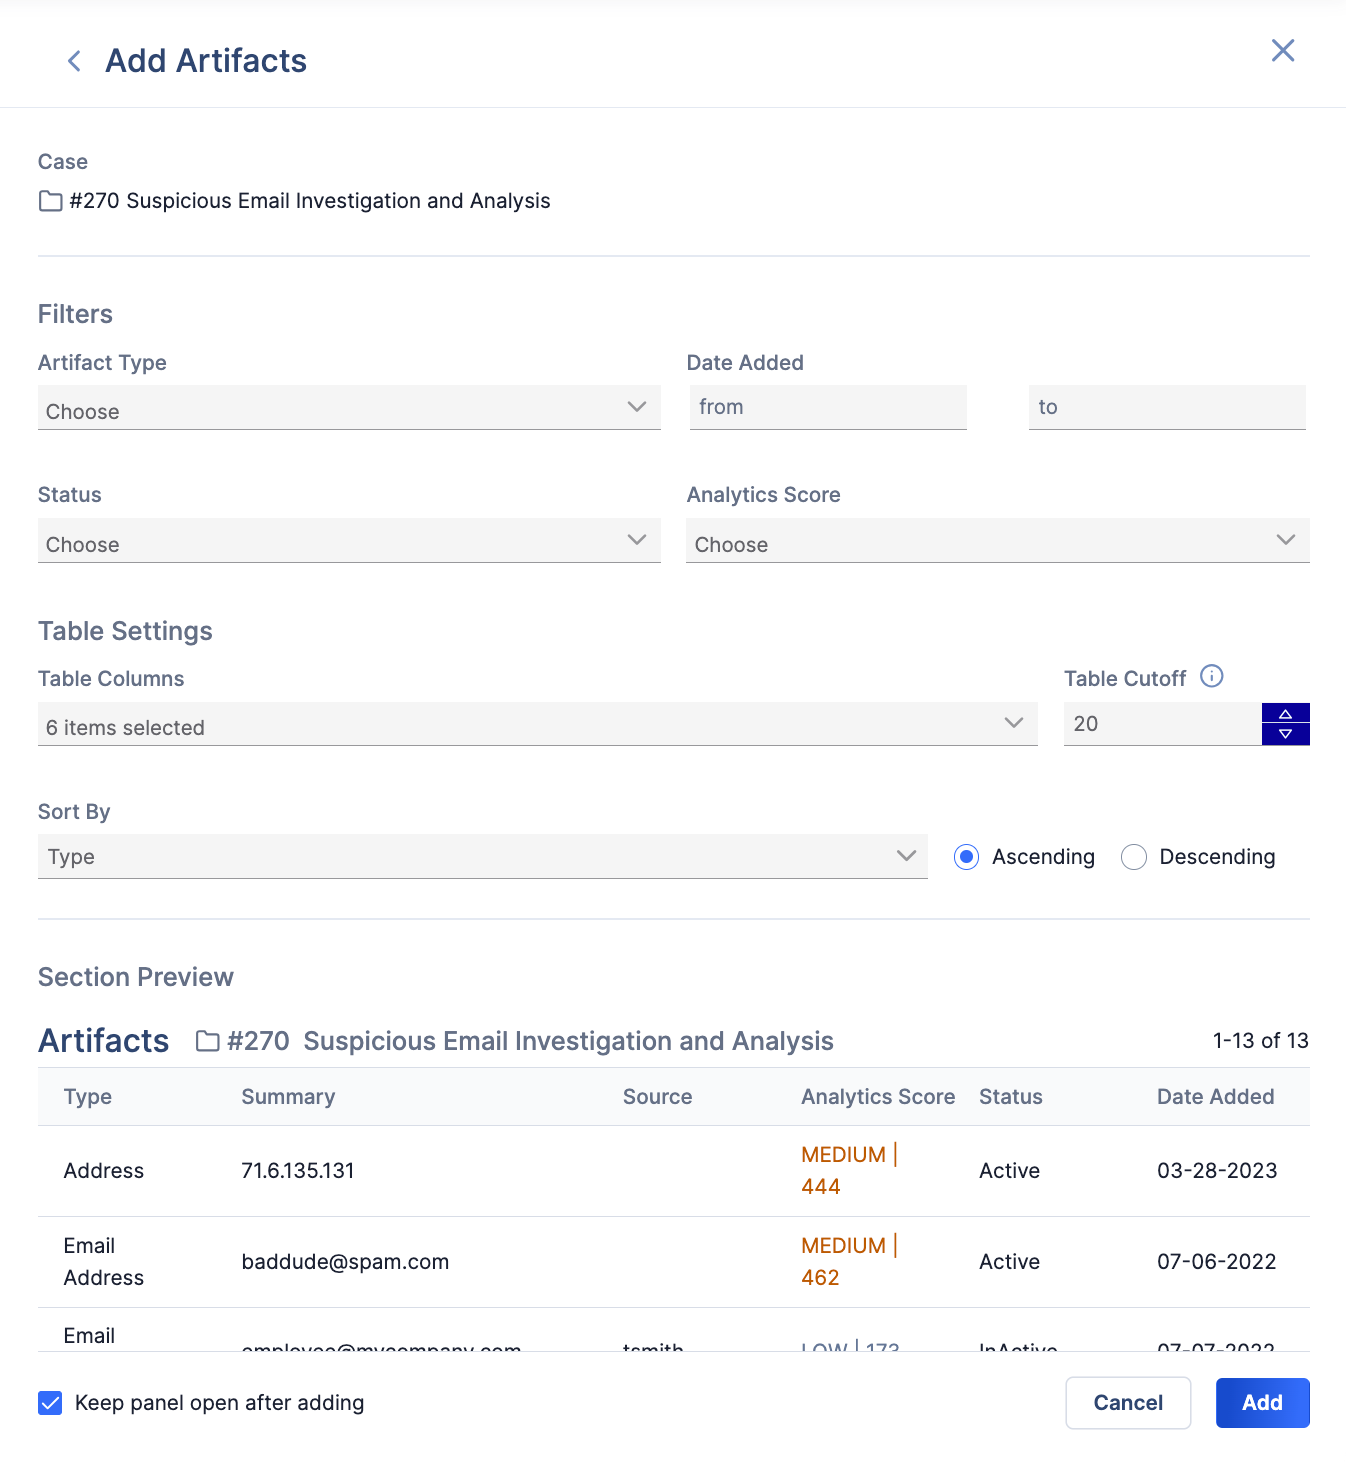
- Filters: By default, all Artifacts added to the selected Case will be displayed in the Artifacts table. If desired, use the following options in this section to filter Artifacts displayed in the table:
- Artifact Type: Select one or more Artifact types. Only Artifacts of the selected type(s) will be displayed in the table.
- Date Added: Click the from and to fields and use the date selectors to select the beginning and end of a date range, respectively. Only Artifacts that were created within the specified range will be displayed in the table.
- Status: Select one or more Indicator Statuses. Only Artifacts whose types map to a ThreatConnect Indicator type and that have the selected Indicator Status(es) will be displayed in the table.
- Analytics Score: Select one or more ThreatAssess assessment levels. Only Artifacts whose types map to a ThreatConnect Indicator type and that have the selected ThreatAssess assessment level(s) will be displayed in the table.
- Table Settings: Use the following options in this section to customize the display settings for the Artifacts table:
- Table Columns: By default, all available table columns will be displayed in the table. To prevent a table column from being displayed in the table, clear the checkbox corresponding to its name.
- Table Cutoff: Enter the maximum number of Artifacts to display in the table. The minimum value you can enter is 5, and the maximum value you can enter is 80.
- Sort By: Select the table column by which to sort Artifacts in the table. You can sort Artifacts by any table column, including those not displayed in the table.
- Ascending/Descending: Select whether to sort Artifacts in ascending or descending order. The sort order will correspond to the column by which the table is sorted.
- Section Preview: This section displays a preview of the Artifacts table that will be added to the report.
- Click Add to add the section to the report.
Timeline
The Timeline section can be used to display information about Timeline Events added to the selected Case in a tabular format. To add this section to a report, select Timeline from the Add Case Data menu (Figure 1). The Add Timeline menu will be displayed (Figure 12).
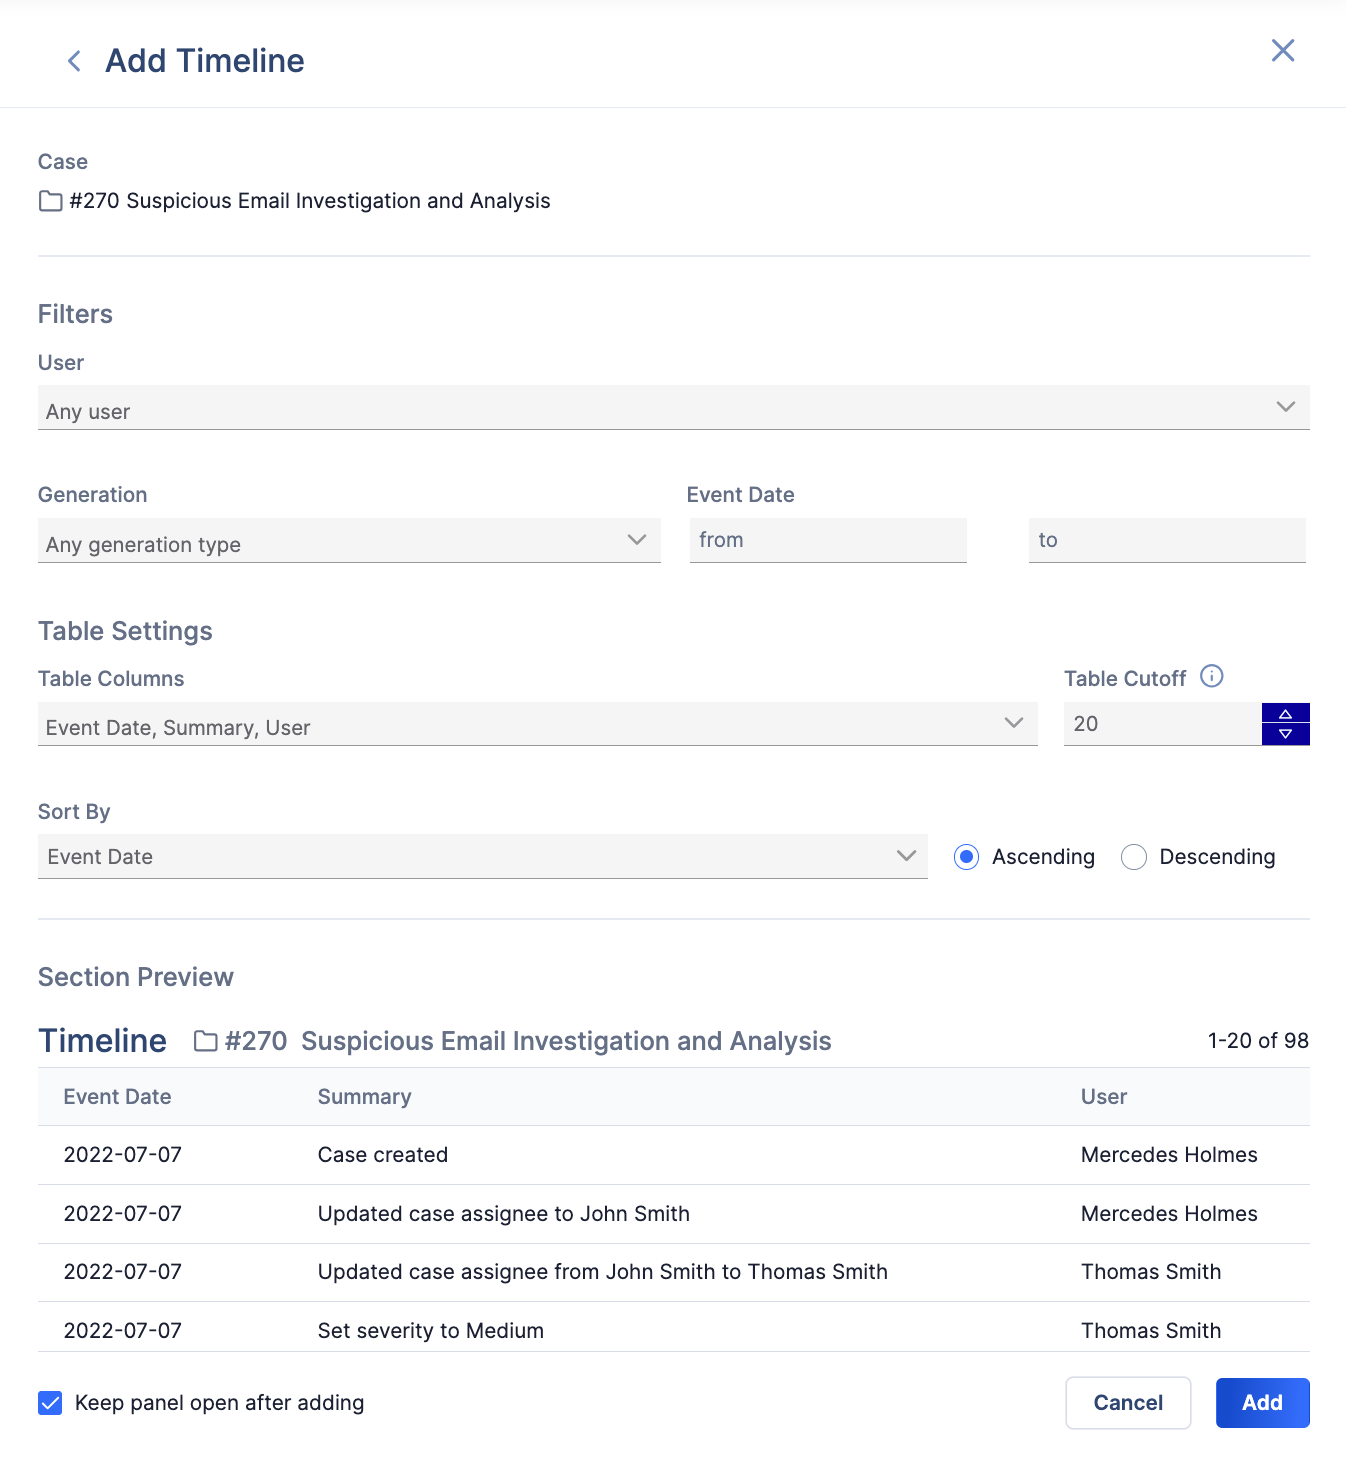
- Filters: By default, all Timeline Events added to the selected Case will be displayed in the Timeline table. If desired, use the following options in this section to filter Timeline Events displayed in the table:
- User: Select one or more users. Only Timeline Events created by the selected users will be displayed in the table.
- Generation: Select whether to display system-generated Timeline Events, user-created Timeline Events, or both in the table.
- Event Date: Click the from and to fields and use the date selectors to select the beginning and end of a date range, respectively. Only Timeline Events that took place within the specified range will be displayed in the table.
- Table Settings: Use the following options in this section to customize the display settings for the Timeline table:
- Table Columns: By default, all available table columns will be displayed in the table. To prevent a table column from being displayed in the table, clear the checkbox corresponding to its name.
- Table Cutoff: Enter the maximum number of Timeline Events to display in the table. The minimum value you can enter is 5, and the maximum value you can enter is 80.
- Sort By: Select the table column by which to sort Timeline Events in the table. You can sort Timeline Events by any table column, including those not displayed in the table.
- Ascending/Descending: Select whether to sort Timeline Events in ascending or descending order. The sort order will correspond to the column by which the table is sorted.
- Section Preview: This section displays a preview of the Timeline table that will be added to the report.
- Click Add to add the section to the report.
Notes
The Notes section can be used to display the following information about Notes added to the selected Case:
- The user that created the Note
- The contents of the Note
- The date and time when the Note was last modified
To add this section to a report, select Notes from the Add Case Data menu (Figure 1). The Add Notes menu will be displayed (Figure 13).
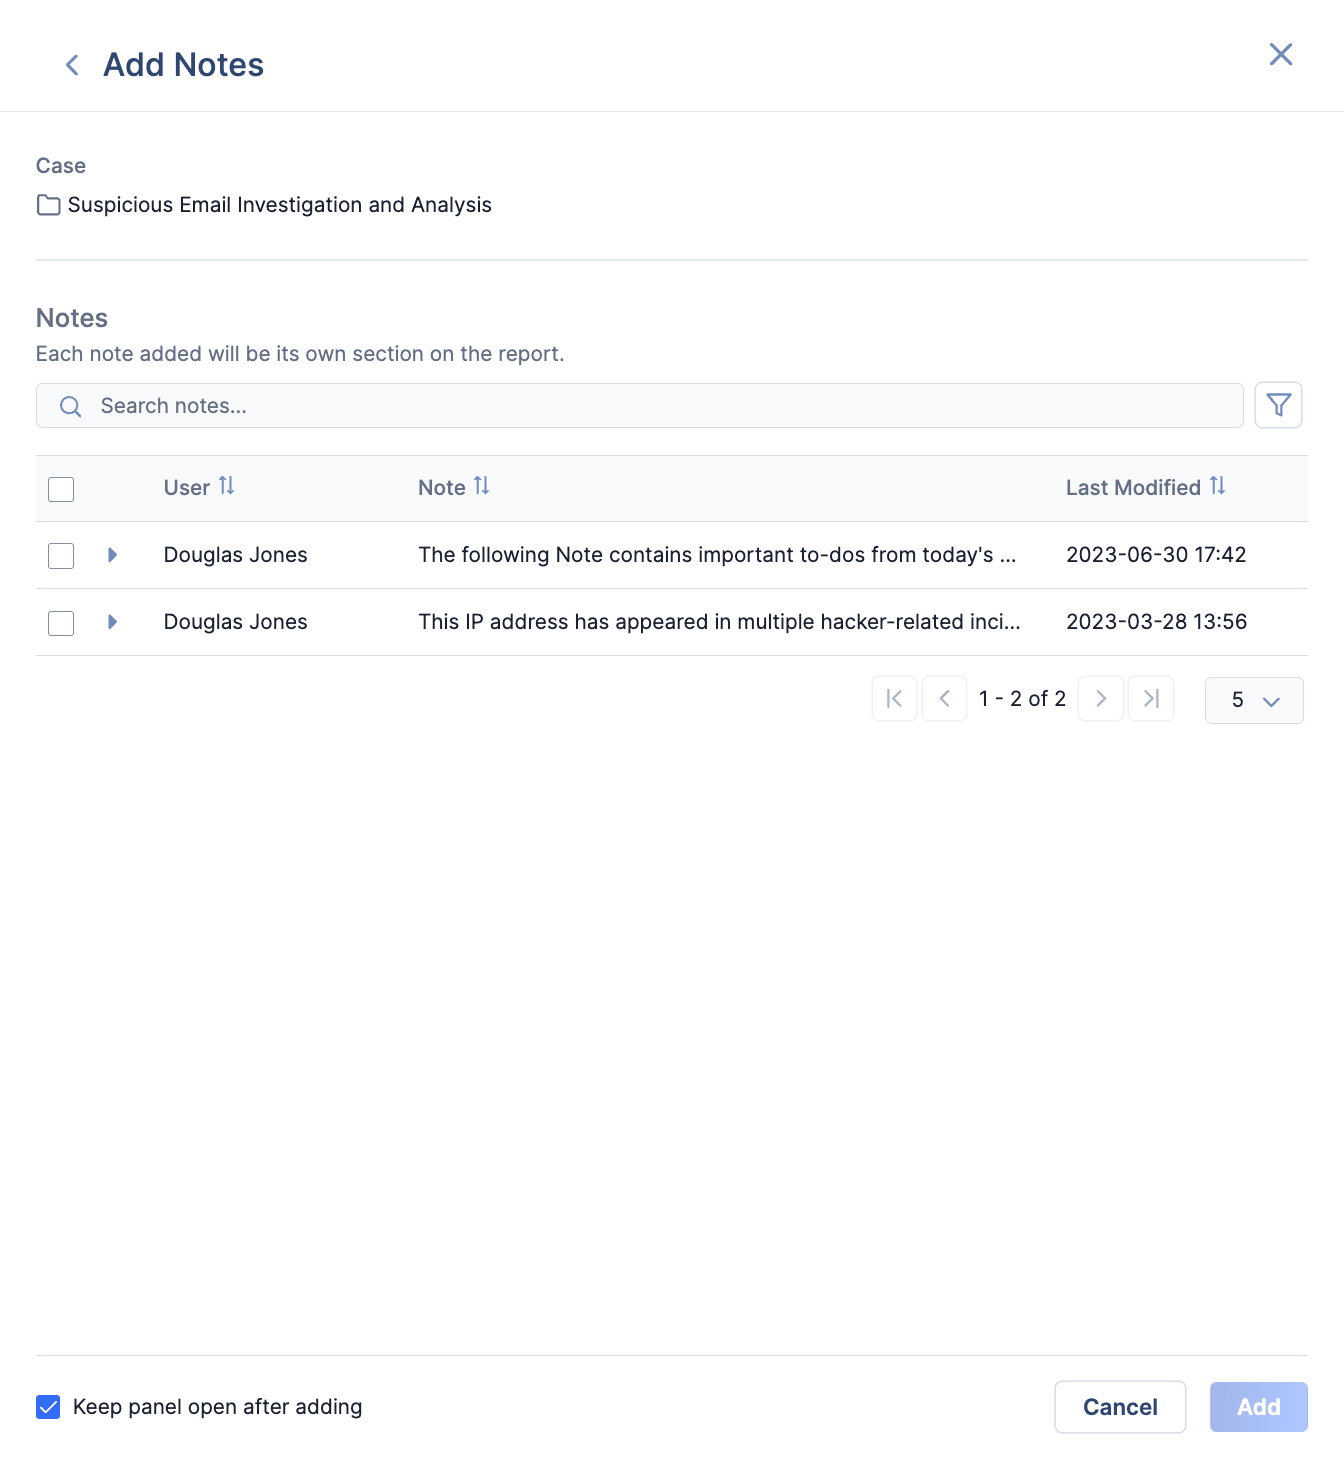
- Notes: Select the checkbox for each Note to add to the report, or select the checkbox in the table’s header to select all Notes on the current table page. To preview how a Note will look in the report, clickto the left of the Note.
- Click Add to add a section to the report for each selected Note.
ThreatConnect® is a registered trademark of ThreatConnect, Inc.
MITRE ATT&CK® and ATT&CK® are registered trademarks of The MITRE Corporation.
20144-10 v.04.C