You can use Intelligence Data sections to capture basic details about Groups and Cases, their Attributes, and their associated objects in a report. For Cases, you can also add details about their Artifacts.
To add an Intelligence Data section to a report, click the + Add Section button along the top of the Report Editor, or click the + Add Above or + Add Below button when hovering over an existing section added to the report, and then select an Intelligence Data section (Figure 1). Available Intelligence Data sections include Case Data and Group Data.
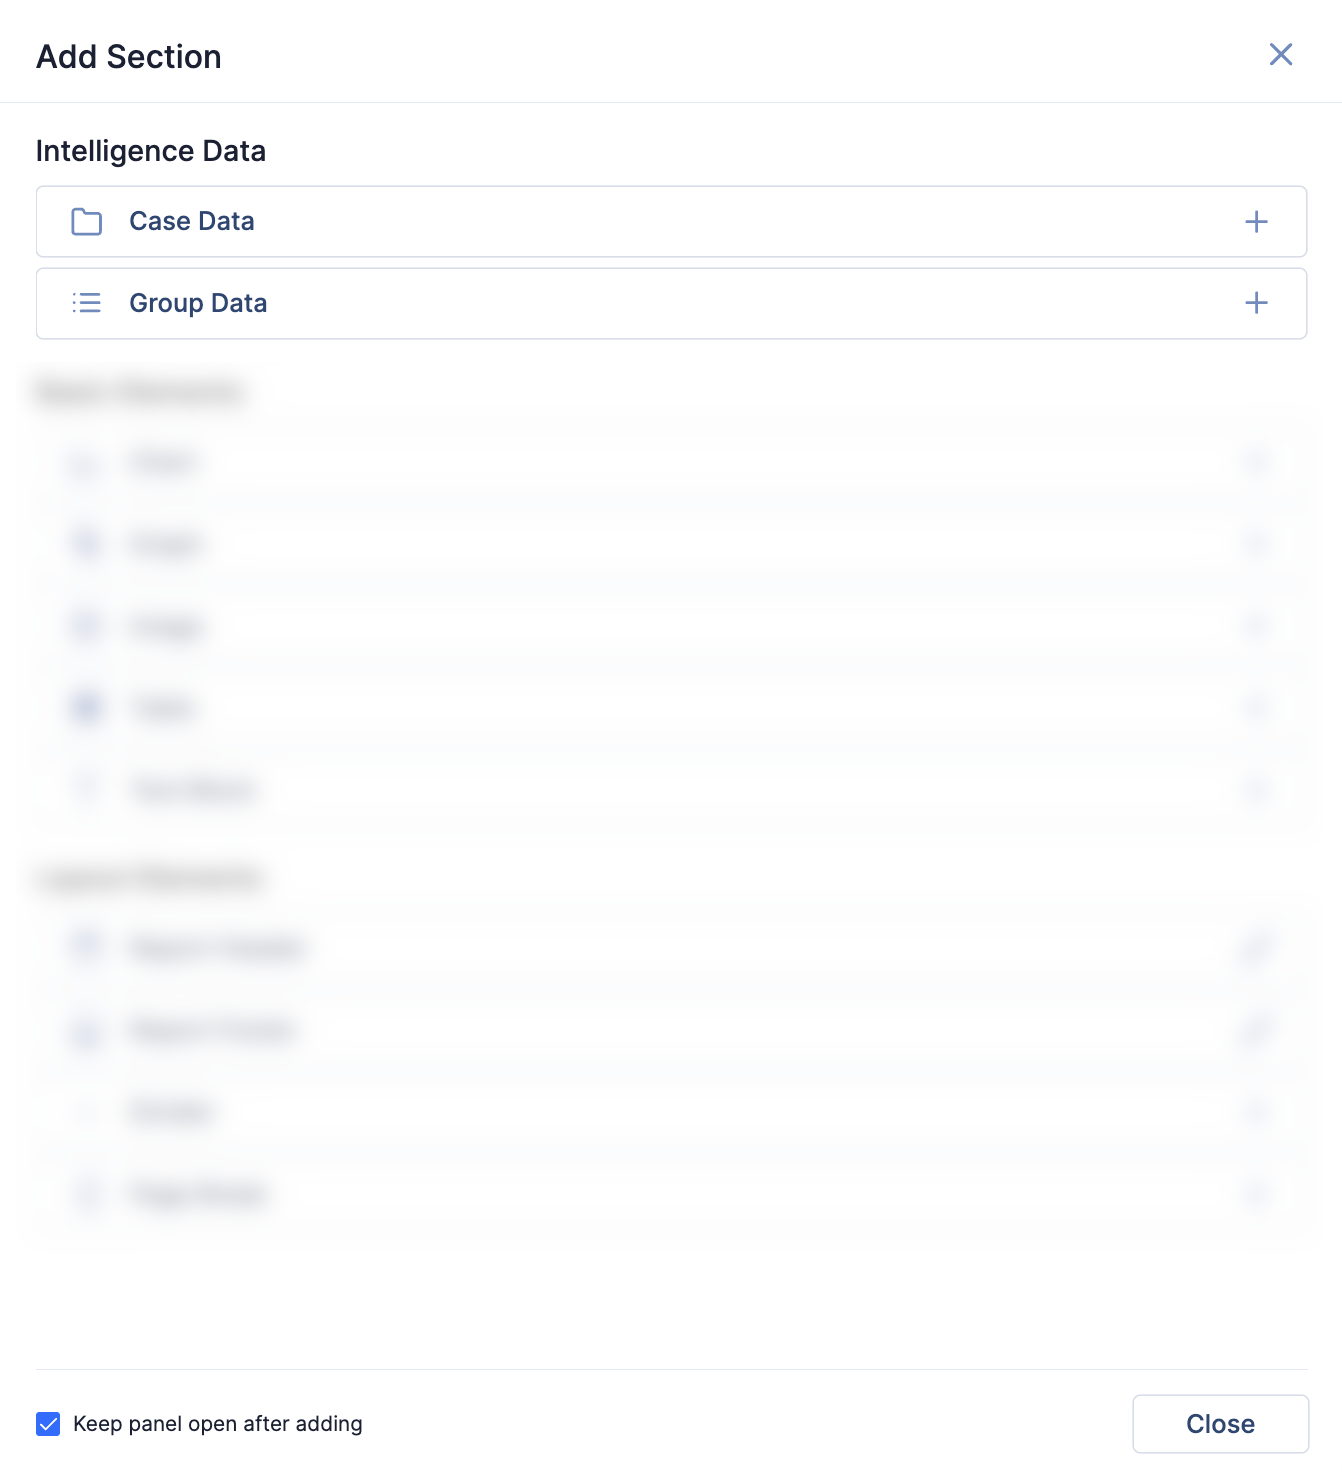
After selecting the Case Data or Group Data section, you will be prompted to select the Case or Group whose data you want to add to the report. Each Case Data and Group Data section can display data from a single Case or Group; however, you can return to the Add Section drawer to add multiple Case Data and Group Data sections containing data from multiple Cases and Groups to a single report.
ThreatConnect® is a registered trademark of ThreatConnect, Inc.
20144-03 v.02.B