Overview
The Browse screen provides a central point where you can view and manage threat intelligence data in ThreatConnect®. On this screen, you can perform the following actions:
- View Intelligence Requirements, Indicators, Groups, Tags, Victims, and Victim Assets in your owners (i.e., your Organization and your Communities and Sources)
- Search and filter threat intelligence data and save search queries for later viewing or use in Query cards in custom dashboards
- Export and delete threat intelligence data
If your instance is opted in to the beta use of the TQL Generator, then you can also generate ThreatConnect Query Language (TQL) queries from plain-English prompts on the Browse screen.
Before You Start
User Roles
- To view, search, filter, and export threat intelligence data in an Organization on the Browse screen, your user account can have any Organization role.
- To view, search, filter, and export threat intelligence data in a Community or Source on the Browse screen, your user account can have any Community role except Banned for that Community or Source.
- To delete threat intelligence data in an Organization on the Browse screen, your user account must have an Organization role of Standard User, Sharing User, Organization Administrator, or App Developer.
- To delete threat intelligence data in a Community or Source on the Browse screen, your user account must have a Community role of Editor or Director for that Community or Source.
Viewing the Browse Screen
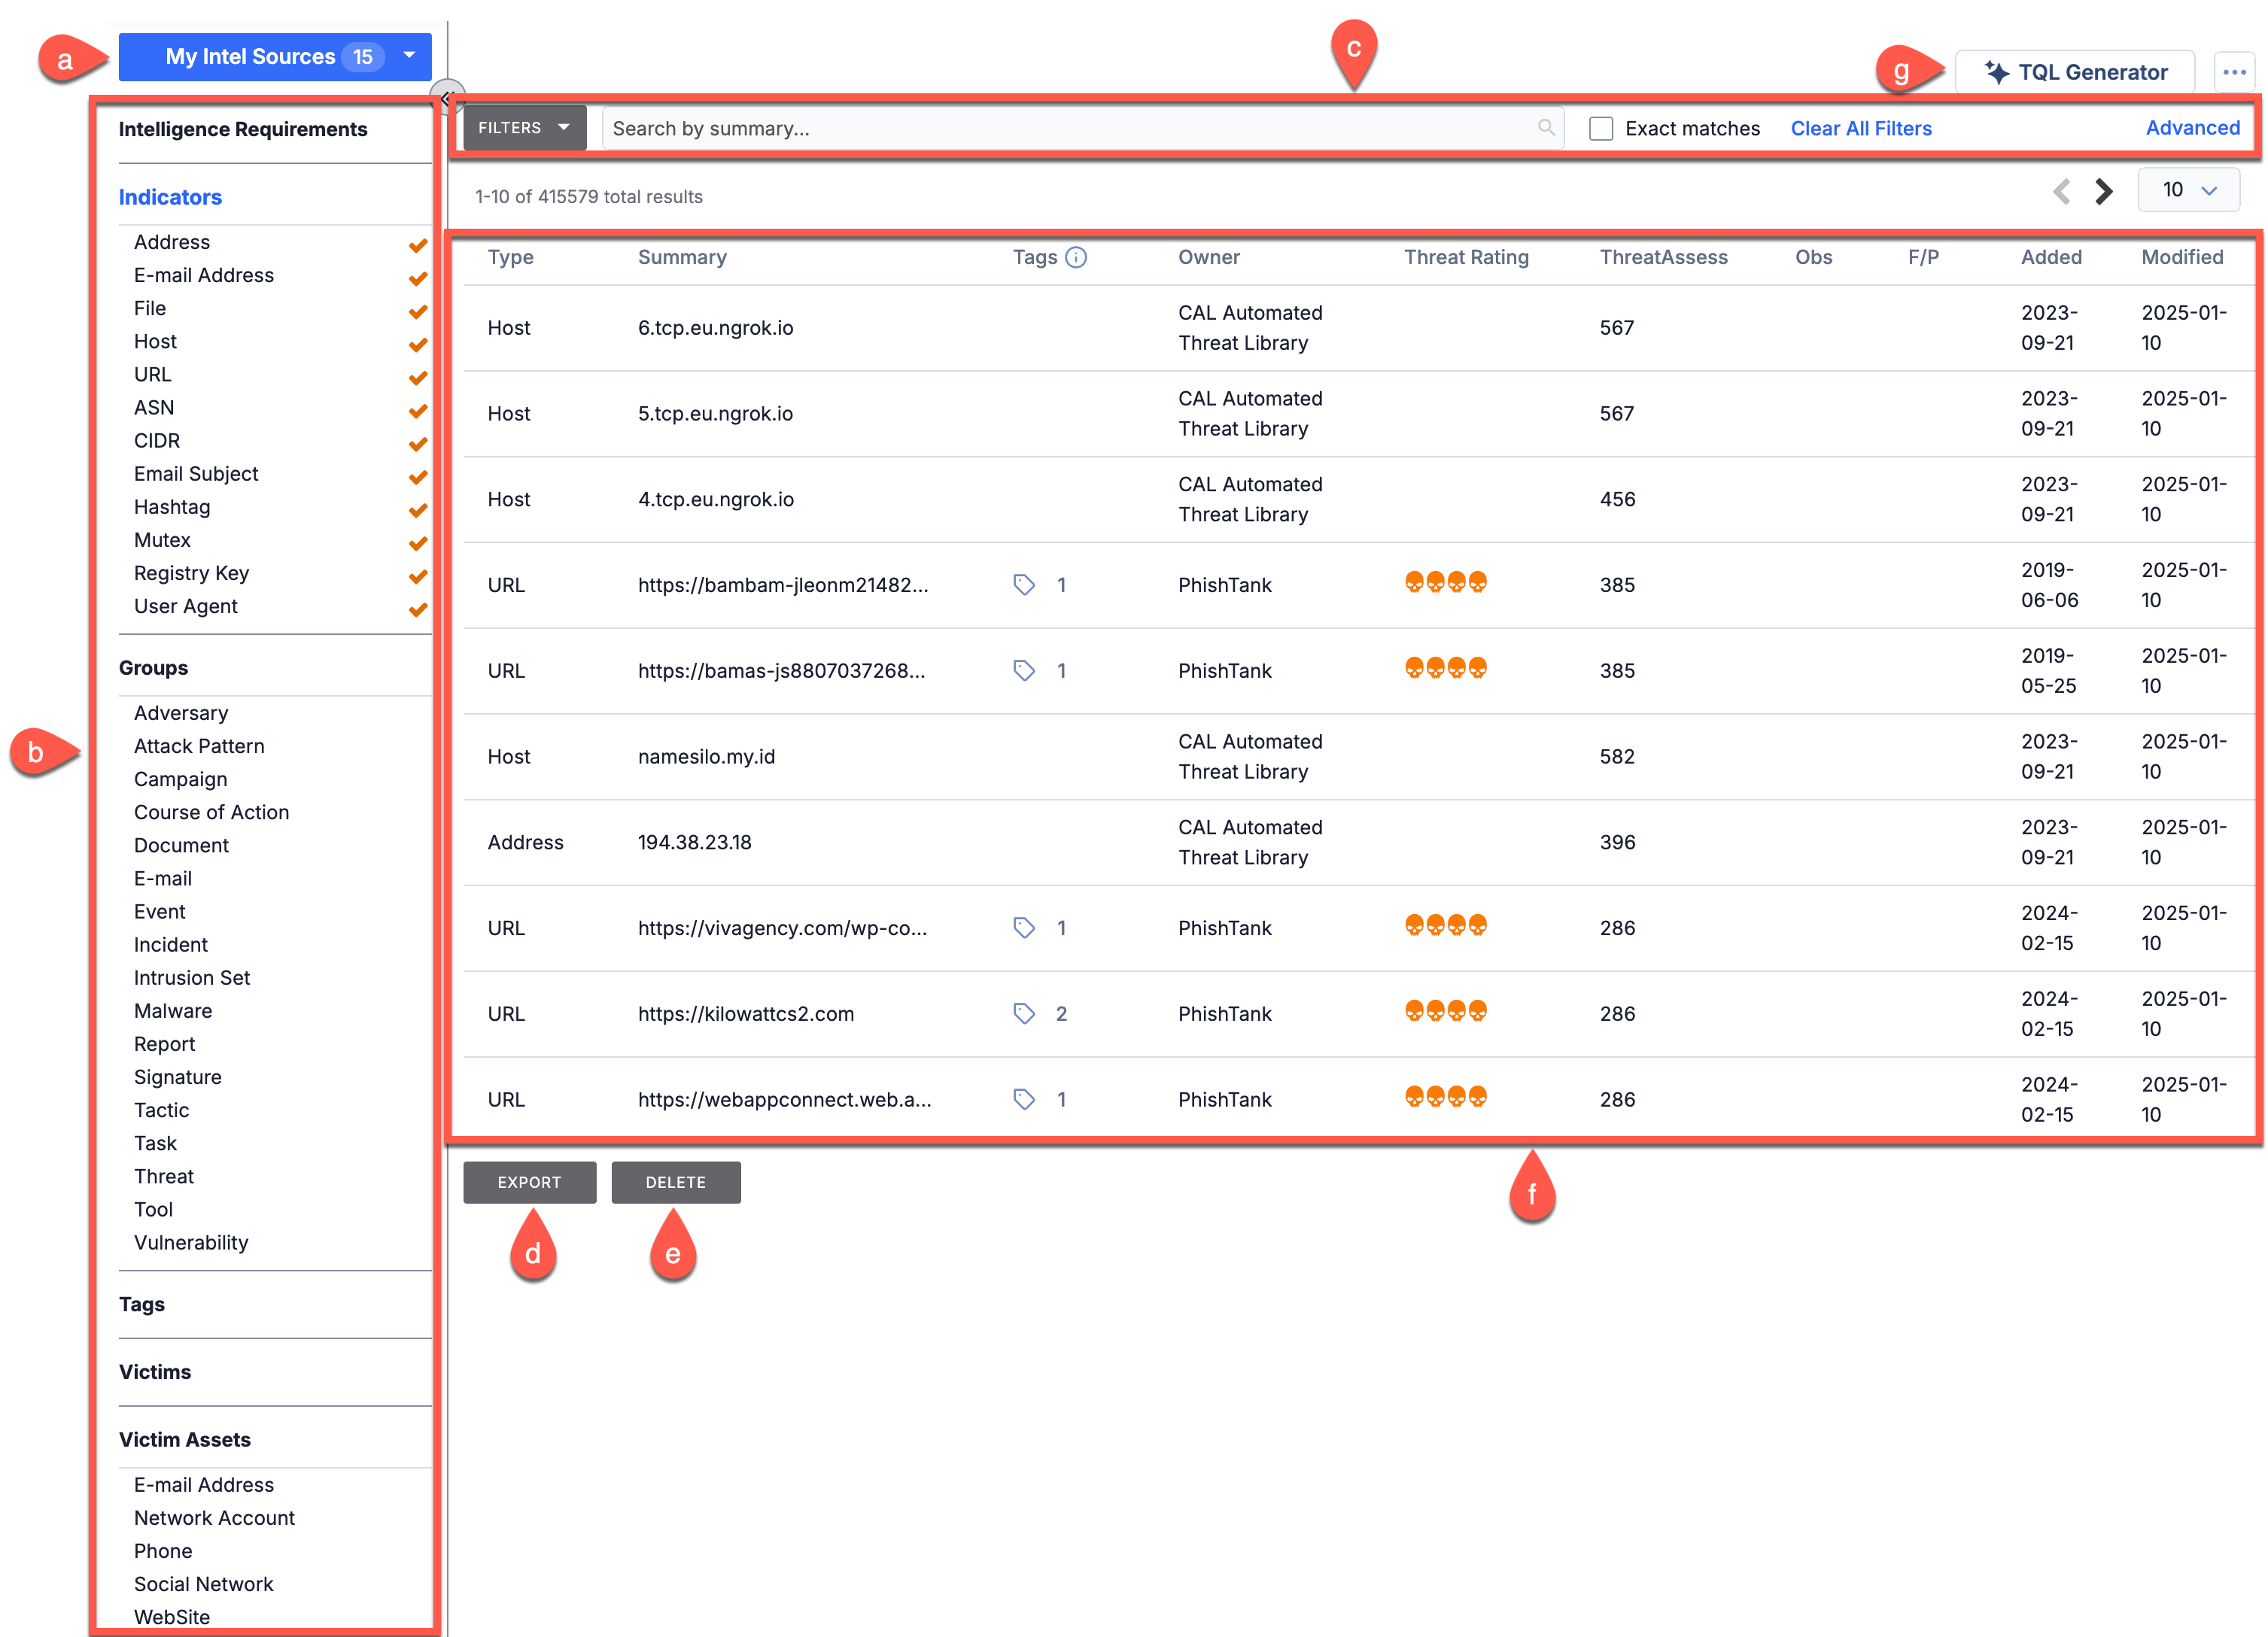
Click Browse on the top navigation bar in ThreatConnect to open the Browse screen. On the Browse screen (Figure 1), you can perform the following actions:
- Select the owners whose threat intelligence data you want to view
- Select the type(s) of threat intelligence data you want to view
- Search and filter threat intelligence data
- Export threat intelligence data
- Delete threat intelligence data
- View details about threat intelligence data
- Use the TQL Generator to generate a TQL query from a plain-English prompt (requires opt-in via your Customer Success Manager)
Selecting Threat Intelligence Data Owners
Use the My Intel Sources selector at the top left of the Browse screen to select the owners whose threat intelligence data you want to view.
Selecting Threat Intelligence Data Types
Use the menu on the left side of the Browse screen to select the type of threat intelligence data you want to view: Intelligence Requirements, Indicators, Groups, Tags, Victims, and Victim Assets. Note that you can view only one type of threat intelligence data at a time on the Browse screen.
Intelligence Requirements
Select Intelligence Requirements from the menu on the left side of the Browse screen to view Intelligence Requirements (IRs). Because IRs can exist only in your Organization, ensure the View <Organization name> toggle is turned on in the My Intel Sources selector. Otherwise, the Browse screen will display no results.
The Browse screen displays IRs in a paginated table with the following columns:
- ID: The IR's ID.
- Requirement: The IR's summary.
- Subtype: The IR's subtype.
- Category: The IR's category.
- Tags: If one or more Tags are applied to the IR, this column displays a count of those Tags; otherwise, this column displays no value. Click on the number in this column to view the standard Tags and ATT&CK® Tags applied to the IR, as well as links to each Tag's Details screen.
- Added: The date when the IR was created.
- Modified: The date when the IR was last modified.
Indicators
Select Indicators from the menu in the left side of the Browse screen to view Indicators of all types in the owners selected in the My Intel Sources selector. Alternatively, select individual Indicator types under Indicators to view only Indicators of those types in the owners selected in the My Intel Sources selector.
The Browse screen displays Indicators in a paginated table with the following columns:
- Type: The Indicator's type.
- Summary: The Indicator's summary.
- Tags: If one or more Tags are applied to the Indicator, this column displays a count of those Tags; otherwise, this column displays no value. Click on the number in this column to view the standard Tags and ATT&CK Tags applied to the Indicator, as well as links to each Tag's Details screen.
- Owner: The Indicator's owner.
- Threat Rating: The Indicator's Threat Rating, if one has been set for the Indicator.
- ThreatAssess: The Indicator's ThreatAssess score.
- Obs: The number of times, if any, the Indicator was observed.
- F/P: The number of times, if any, the Indicator was reported as a false positive.
- Added: The date when the Indicator was created in the owner listed in the Owner column.
- Modified: The date when the Indicator was last modified in the owner listed in the Owner column.
If you are viewing only Address Indicators, the table on the Browse screen will display an additional column labeled Version that indicates whether the Address Indicator represents an IPv4 or IPv6 address.
Groups
Select Groups from the menu in the left side of the Browse screen to view Groups of all types in the owners selected in the My Intel Sources selector. Alternatively, select individual Group types under Groups to view only Groups of those types in the owners selected in the My Intel Sources selector.
The Browse screen displays Groups in a paginated table with the following columns:
- Type: The Group's type.
- Summary: The Group's summary.
- Tags: If one or more Tags are applied to the Group, this column displays a count of those Tags; otherwise, this column displays no value. Click on the number in this column to view the standard Tags and ATT&CK Tags applied to the Group, as well as links to each Tag's Details screen.
- Owner: The Group's owner.
- Added: This column displays the date when the Group was created.
- Modified: This column displays the date when the Group was last modified.
Table 1 outlines the additional table columns the Browse screen will display when only one of the following Group types is selected: Campaign, Document, E-mail, Event, Incident, Report, or Task.
| Group Type | Column Name | Description |
|---|---|---|
| Campaign | First Seen | The date when the Campaign was first seen. |
| Document | Format | The type of file uploaded to the Document. |
| Score | The E-mail's Threat Score. | |
| Event | Event Date | The date when the Event took place. |
| Status | The Event's status. | |
| Incident | Event Date | The date when the Incident took place. |
| Status | The Incident's status. | |
| Report | Format | The type of file uploaded to the Report. |
| Publish Date | The date when the Report was published. | |
| Signature | Format | The format of the signature file uploaded to the Signature. |
| Task | Status | The Task's status. |
| Due Date | The date when the Task is due. |
Tags
Select Tags from the menu on the left side of the Browse screen to view Tags in the owners selected in the My Intel Sources selector.
The Browse screen displays Tags in a paginated table with the following columns:
- Type: This column displays "Tag" for all entries.
- Summary: The Tag's summary.
- Synonymous Tags: For main Tags defined in Tag normalization rules (i.e., Tags with an
 icon displayed to the left of their name in the Summary column), this column displays a count of synonymous Tags defined in the corresponding rule; for all other Tags, this column displays no value. Click on the number in this column to view a list of synonymous Tags associated with the main Tag.
 - Owner: The Tag’s owner.
- Last Used: The date when the Tag was last used. For Tags that have not been used since the Last Used date for Tags was introduced in ThreatConnect, this column displays a value of Unknown.
Victims
Select Victims from the menu on the left side of the Browse screen to view Victims in the owners selected in the My Intel Sources selector.
The Browse screen displays Victims in a paginated table with the following columns:
- Type: This column displays “Victim” for all entries.
- Summary: The Victim’s summary.
- Tags: If one or more Tags are applied to the Victim, this column displays a count of those Tags; otherwise, this column displays no value. Click on the number in this column to view the standard Tags and ATT&CK Tags applied to the Victim, as well as links to each Tag’s Details screen.
- Owner: The Victim’s owner.
- Org: The Victim’s organization.
- Sub-Organization: The Victim’s sub-organization.
- Nationality: The Victim’s nationality.
- Location: The Victim’s work location.
Victim Assets
Select Victim Assets from the menu in the left side of the Browse screen to view Victim Assets of all types in the owners selected in the My Intel Sources selector. Alternatively, select individual Victim Asset types under Victim Assets to view only Victim Assets of those types in the owners selected in the My Intel Sources selector.
The Browse screen displays Victim Assets in a paginated table with the following columns:
- Type: The Victim Asset’s type.
- Summary: The Victim Asset’s summary.
- Victim: The Victim to which the Victim Asset belongs.
- Asset: For E-mail Address, Network Account, and Social Network Victim Assets, this column displays the type of email address, network account, or social network, respectively, to which the Victim Asset corresponds.
Searching and Filtering Threat Intelligence Data
There are four elements you can use to search and filter threat intelligence data on the Browse screen, all of which are available at top of the screen:
- A search bar for running a “contains” search
- An Exact matches (for Indicators, Groups, Victims, and Victim Assets) or Exact Match (for IRs and Tags) checkbox for running an “exact match” search
- A FILTERS menu (for Indicators, Groups, Victims, and Victim Assets) or Filters
 menu (for IRs and Tags) for filtering data
 - An Advanced (for Indicators, Groups, Victims, and Victim Assets) or Advanced Search toggle (for IRs and Tags) that lets you switch to the advanced search feature
When one or more filters are applied on the Browse screen, you can click Clear All Filters (for Indicators, Groups, Victims, and Victim Assets) or Clear all filters & search (for IRs and Tags) to the right of the search bar to clear the filters.
Running a “Contains” Search
A “contains” search lets you narrow down results based on whether they contain the text entered into the search bar at the top of the Browse screen. Use a “contains” search when you want to filter IRs, Indicators, Groups, Tags, Victims, or Victim Assets by summary, IRs by ID, or ATT&CK Tags by technique ID.
If you run a “contains” search on Indicators, Groups, Victims or Victim Assets, the Browse screen will display the entered text above the results table and a Clear![]() button that lets you clear the filter. If you run a “contains” search on IRs or Tags, the Browse screen will display the entered text in the search bar.
button that lets you clear the filter. If you run a “contains” search on IRs or Tags, the Browse screen will display the entered text in the search bar.
Running an “Exact Match” Search
An “exact match” search lets you narrow down results to those whose summary is an exact match to the text entered into the search bar at the top of the Browse screen. This type of search is helpful when filtering large datasets for a specific object, as an “exact match” search takes less time to complete than a “contains” search and will yield a more targeted result set.
To run an “exact match” search, enter the text to filter results by into the search bar, and then select the Exact matches (for Indicators, Groups, Victims, and Victim Assets) or Exact Match (for IRs and Tags) checkbox to the right of the search bar.
Filtering Results
Depending on the type of threat intelligence data you are viewing on the Browse screen, one of the following filter elements will be displayed at the top of the screen:
- A FILTERS menu to the left of the search bar (for Indicators, Groups, Victims and Victim Assets)
- A Filtersmenu to the right of the search bar (for IRs and Tags)
Use the filters menu to define one or more filters to apply to the results on the Browse screen. After you define the desired filters, click Apply to apply them to the results. Table 2 outlines the filters available for each type of threat intelligence data.
| Object Type | Filter Parameters |
|---|---|
| IR | Subtype, Category, Date Added, Last Modified |
| Indicator | Tags, Created After, Created Before, Modified After, Modified Before, Indicator Status, Observed Since, Threat and Confidence Ratings, ThreatAssess Score, Observations, False Positives, Attributes that exist within ThreatConnect |
| Group | Tags, Created After, Created Before, Modified After, Modified Before, Attributes that exist within ThreatConnect |
| Tag | Last Used |
| Victim | Tags, Organization, Sub-Organization, Nationality, Work Location, Attributes that exist within ThreatConnect |
| Victim Asset | Victim, Asset |
Running an Advanced Search
Click Advanced at the top right of the Browse screen (for Indicators, Groups, Victims, and Victim Assets) or turn on the Advanced Search toggle above the search bar (for IRs and Tags) to switch to the advanced search feature (Figure 2). The advanced search feature lets you build structured queries using an SQL-like query language called ThreatConnect Query Language (TQL). With this feature, you can specify criteria that cannot be defined using the basic search and filter capabilities.
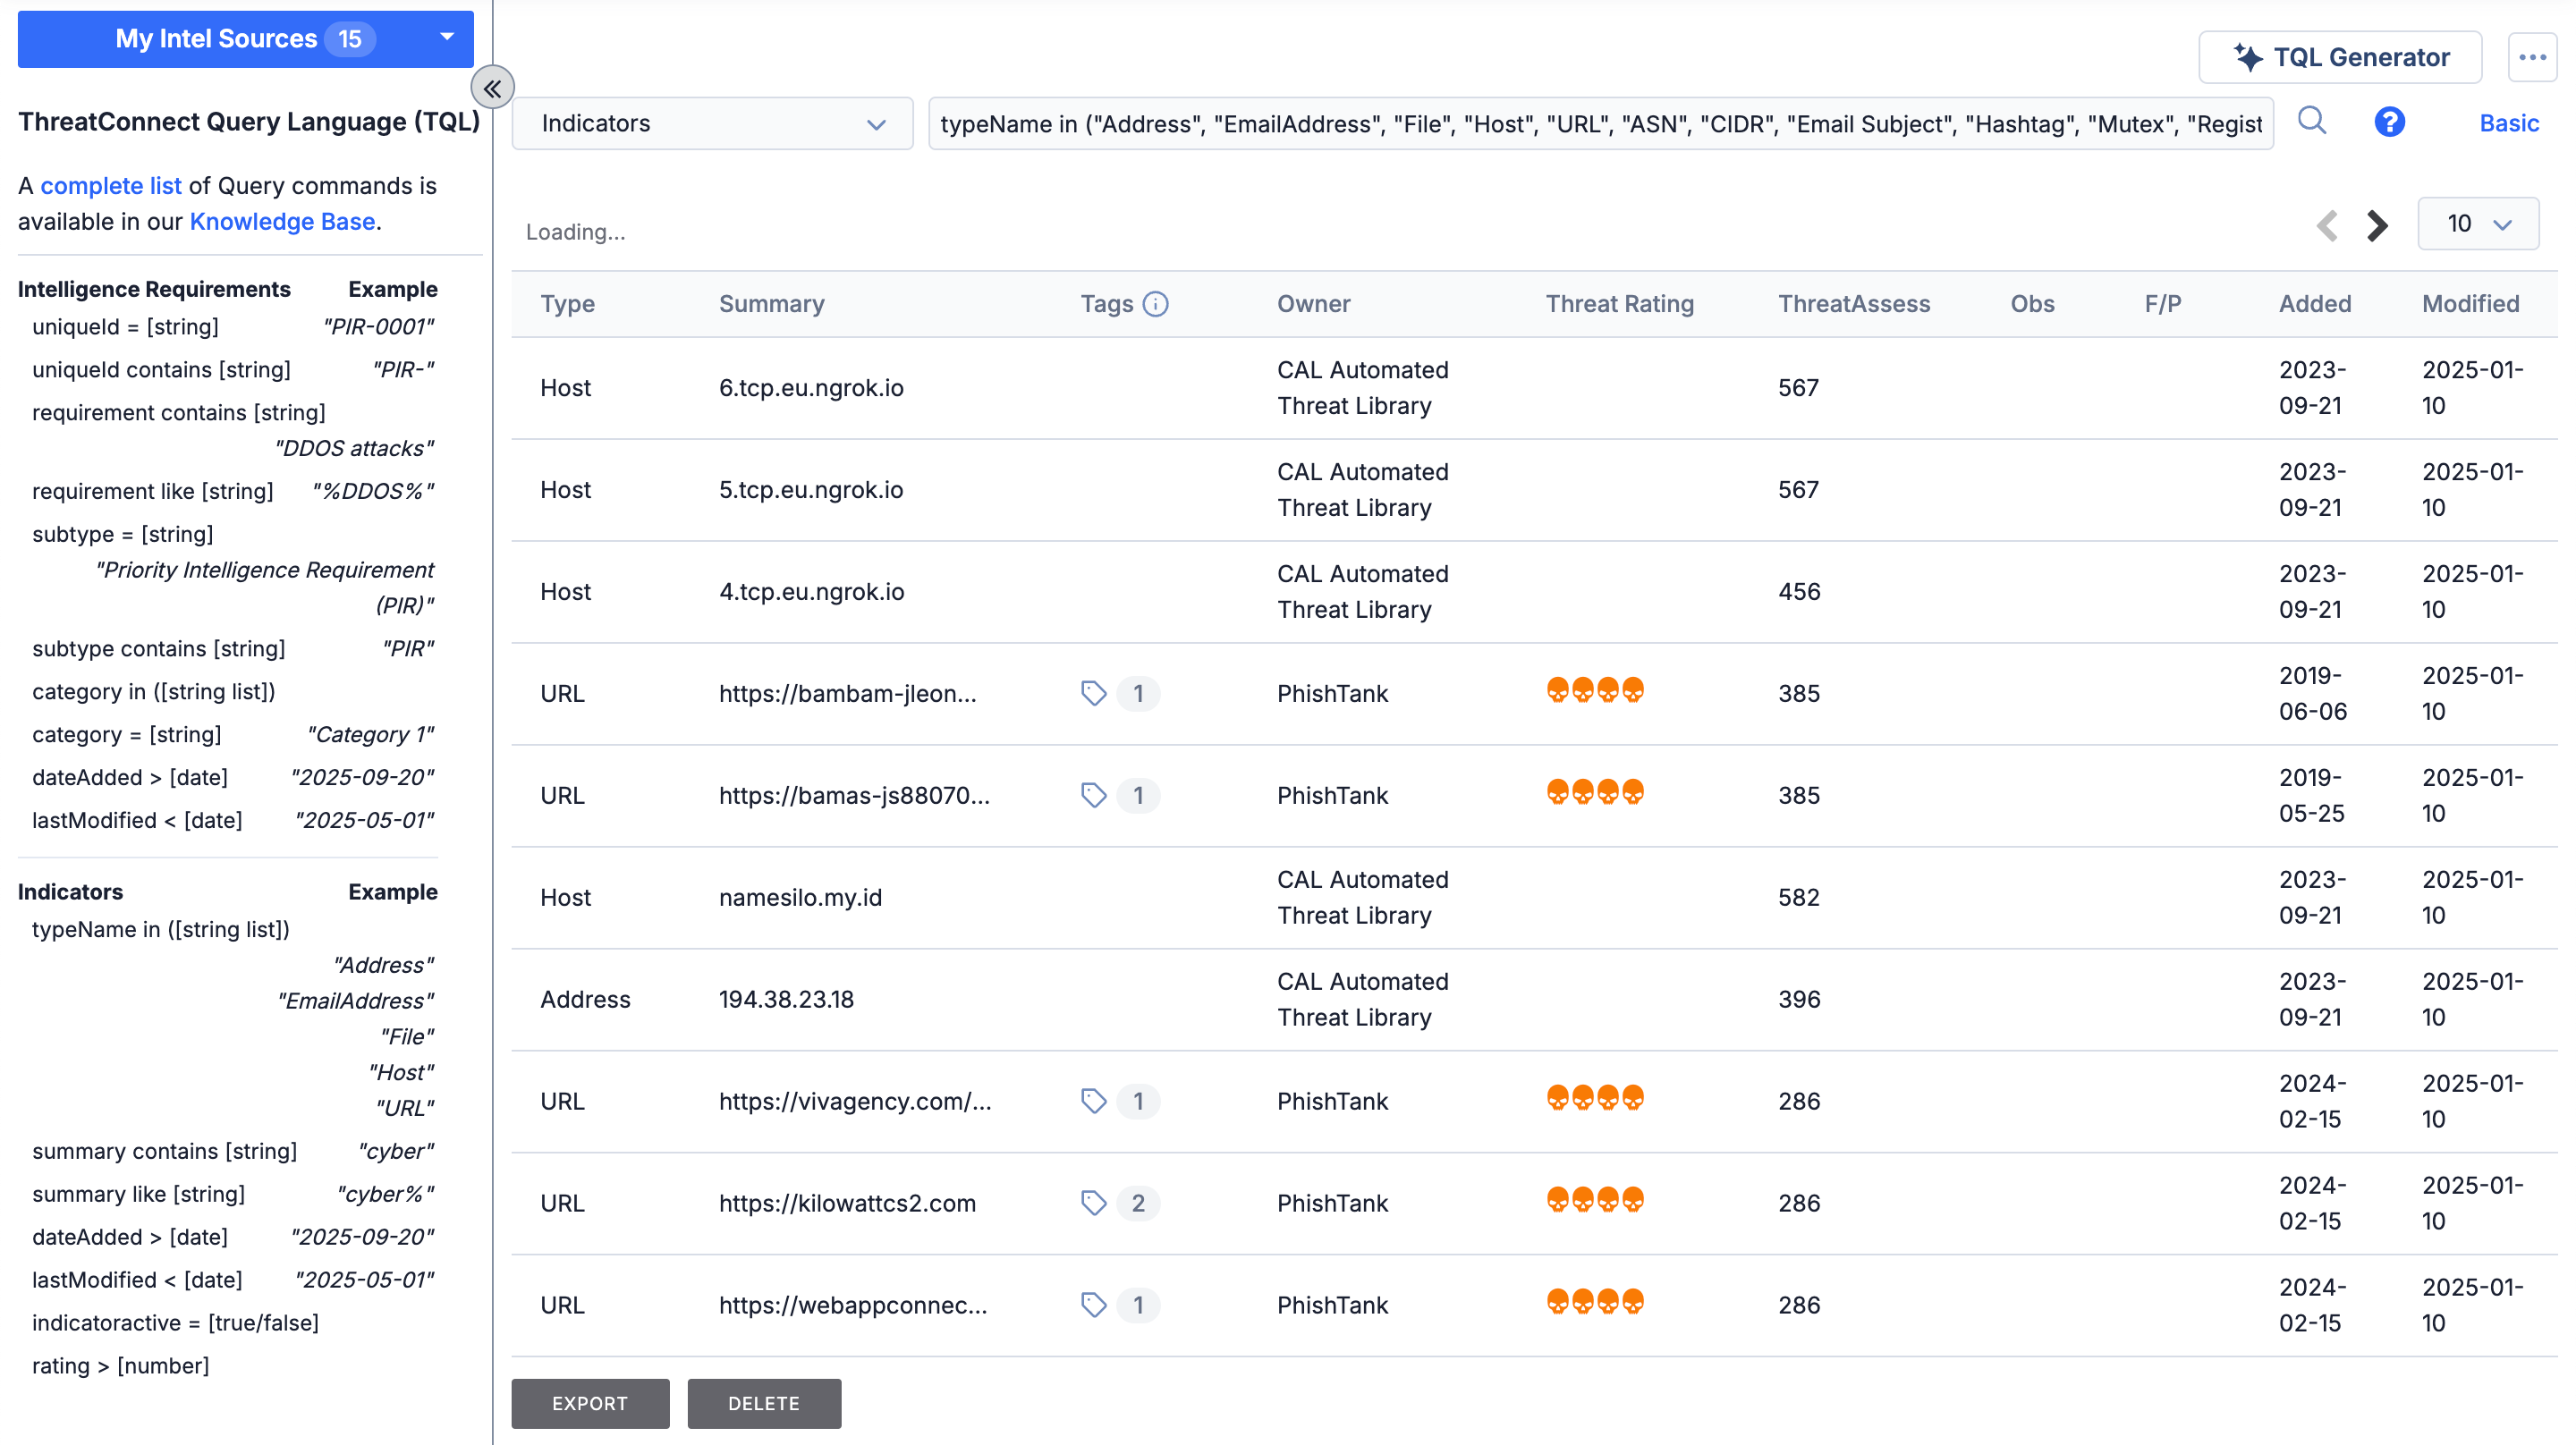
To switch back to the basic search features (i.e., the search bar for running a “contains” search, the checkbox for running an “exact match” search, and the filters menu), click Basic at the top right of the Browse screen (for Indicators, Groups, Victims, and Victim Assets) or turn off the Advanced Search toggle above the search bar (for IRs and Tags).
Saving Search Queries
You can save search queries created on the Browse screen. This is helpful when you want to view the results of the saved query at a later time, use the saved query in Query cards in custom dashboards, or add the saved query to an IR or Group to create associations to objects returned via the query.
To save a search query, click the ⋮ menu at the top right of the Browse screen and select Save Current Query….
Viewing and Managing Saved Search Queries
Click the ⋮ menu at the top right of the Browse screen and select View Queries to view and manage your saved search queries.
Exporting Threat Intelligence Data
When viewing Indicators or Groups, the Browse screen will display an EXPORT button at the bottom of the screen. Click EXPORT to export the Indicators or Groups in the results table to a comma-separated values (CSV) file with select data points.
Deleting Threat Intelligence Data
Click DELETE at the bottom of the Browse screen to delete all objects in the results table. If you attempt to delete more than 50 objects, you will be prompted to type “OK” in the Delete window to confirm the deletion.
Viewing Threat Intelligence Data Details
You can open the Details drawer or screen for a threat intelligence data object in the results table on the Browse screen and view more details about the object using the following methods:
- Details drawer: Click on an object's row in the table on the Browse screen to open the object's Details drawer.
- Details screen: Hover over the object's row in the table on the Browse screen and select one of the following icons in the Summary cell:
- View full details
 : Open the Details screen in the current browser tab.
 - View details in new tab
 : Open the Details screen in a new browser tab.
- View full details
ThreatConnect® is a registered trademark, and TC Exchange™ and CAL™ are trademarks, of ThreatConnect, Inc.
MITRE ATT&CK® and ATT&CK® are registered trademarks of The MITRE Corporation.
20051-02 v.19.A