Overview
Dashboards in ThreatConnect® display their content via a series of cards. When configuring a dashboard card, you can choose the card’s format, color scheme, and chart type to ensure the card displays data clearly and logically. There are three types of cards you can add to a dashboard: Widget, Metric, and Query.
Query cards let you display the results of newly created or saved queries written in ThreatConnect Query Language (TQL).
Before You Start
User Roles
- To add Query cards to custom dashboards you created or another user in your Organization shared, your user account can have any Organization role.
- To add Query cards to System-level dashboards that are not built-in dashboards, your user account must have a System role of Administrator.
Prerequisites
- To add Query cards to custom dashboards, turn on custom dashboards for your Organization on the Account Settings screen (must be an Accounts Administrator, Operations Administrator, or System Administrator to perform this action).
Adding a Query Card
The following steps demonstrate how to add a specific Query card (New Query) to a dashboard. However, you can follow a similar process when adding other types of Query cards to a dashboard.
- Hover over Dashboard on the top navigation bar and select an existing dashboard to open or create a custom dashboard.
- Click Add
 at the upper-right corner of the dashboard, or click Add Your First Card in the middle of the dashboard if no cards have been added to it.
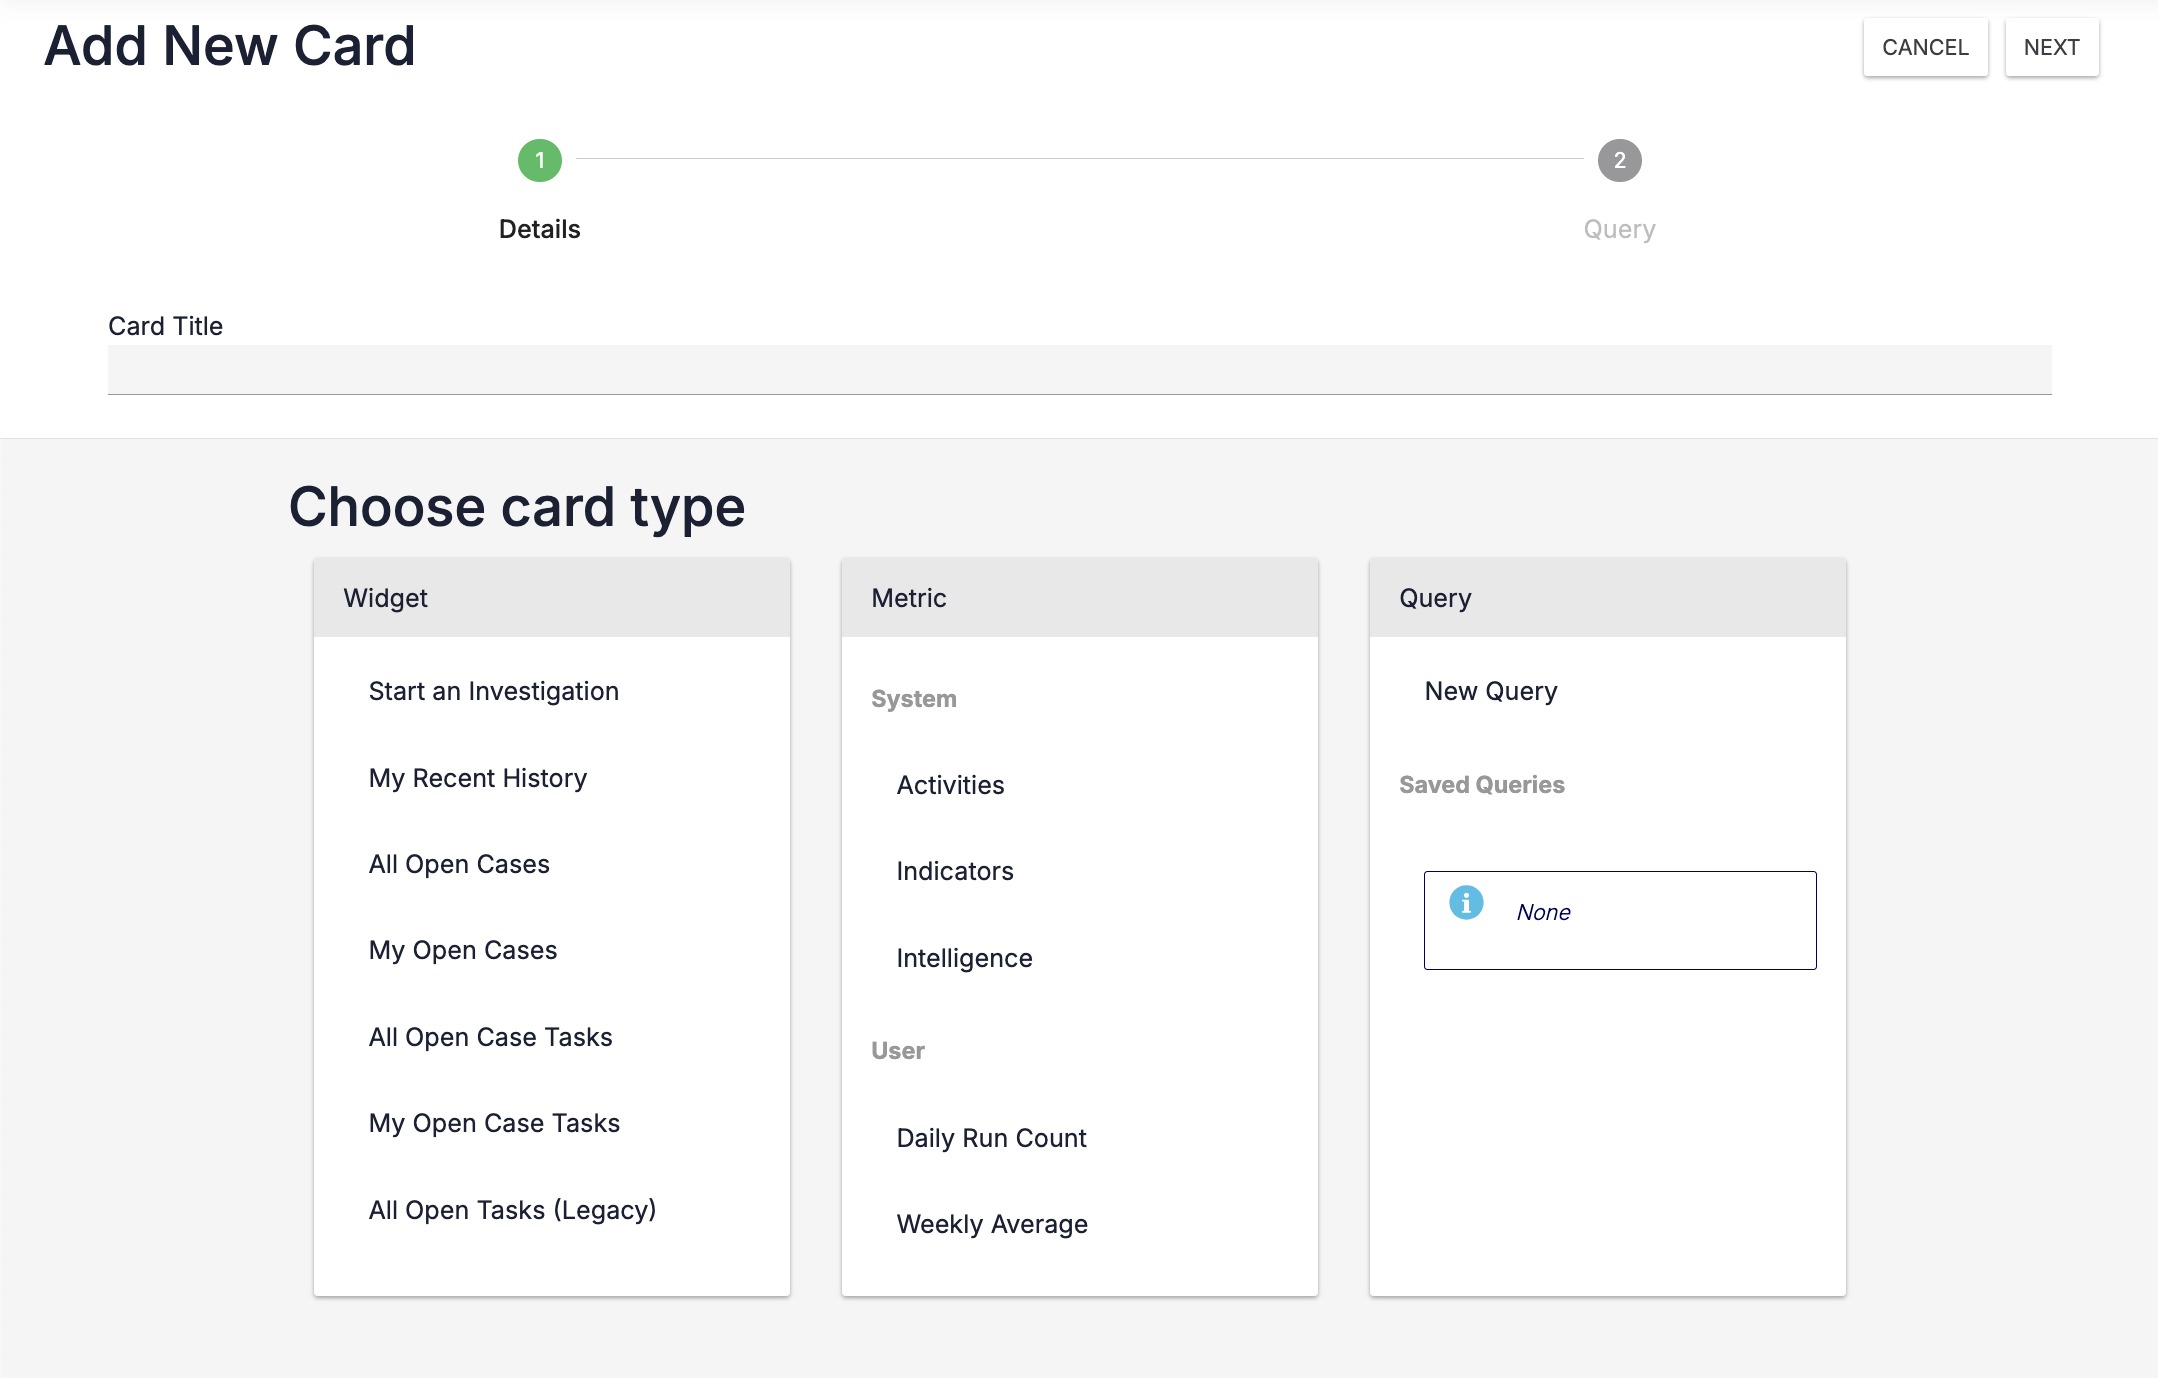
 - On the Details step of the Add New Card drawer (Figure 1), enter a title for the card, and then select New Query from the Query section. If you do not enter a title for the card before selecting New Query, then the card’s title will be New Query.NoteTQL queries you saved while using the advanced search feature on the Browse screen will be listed under the Saved Queries subsection of the Query section.
- After you select New Query on the Details step, you will proceed to the Query step automatically (Figure 2). On this step, configure the data to display on the New Query card as follows:NoteAs you configure options on the Query step, the preview of the dashboard card will update automatically based on the configuration.
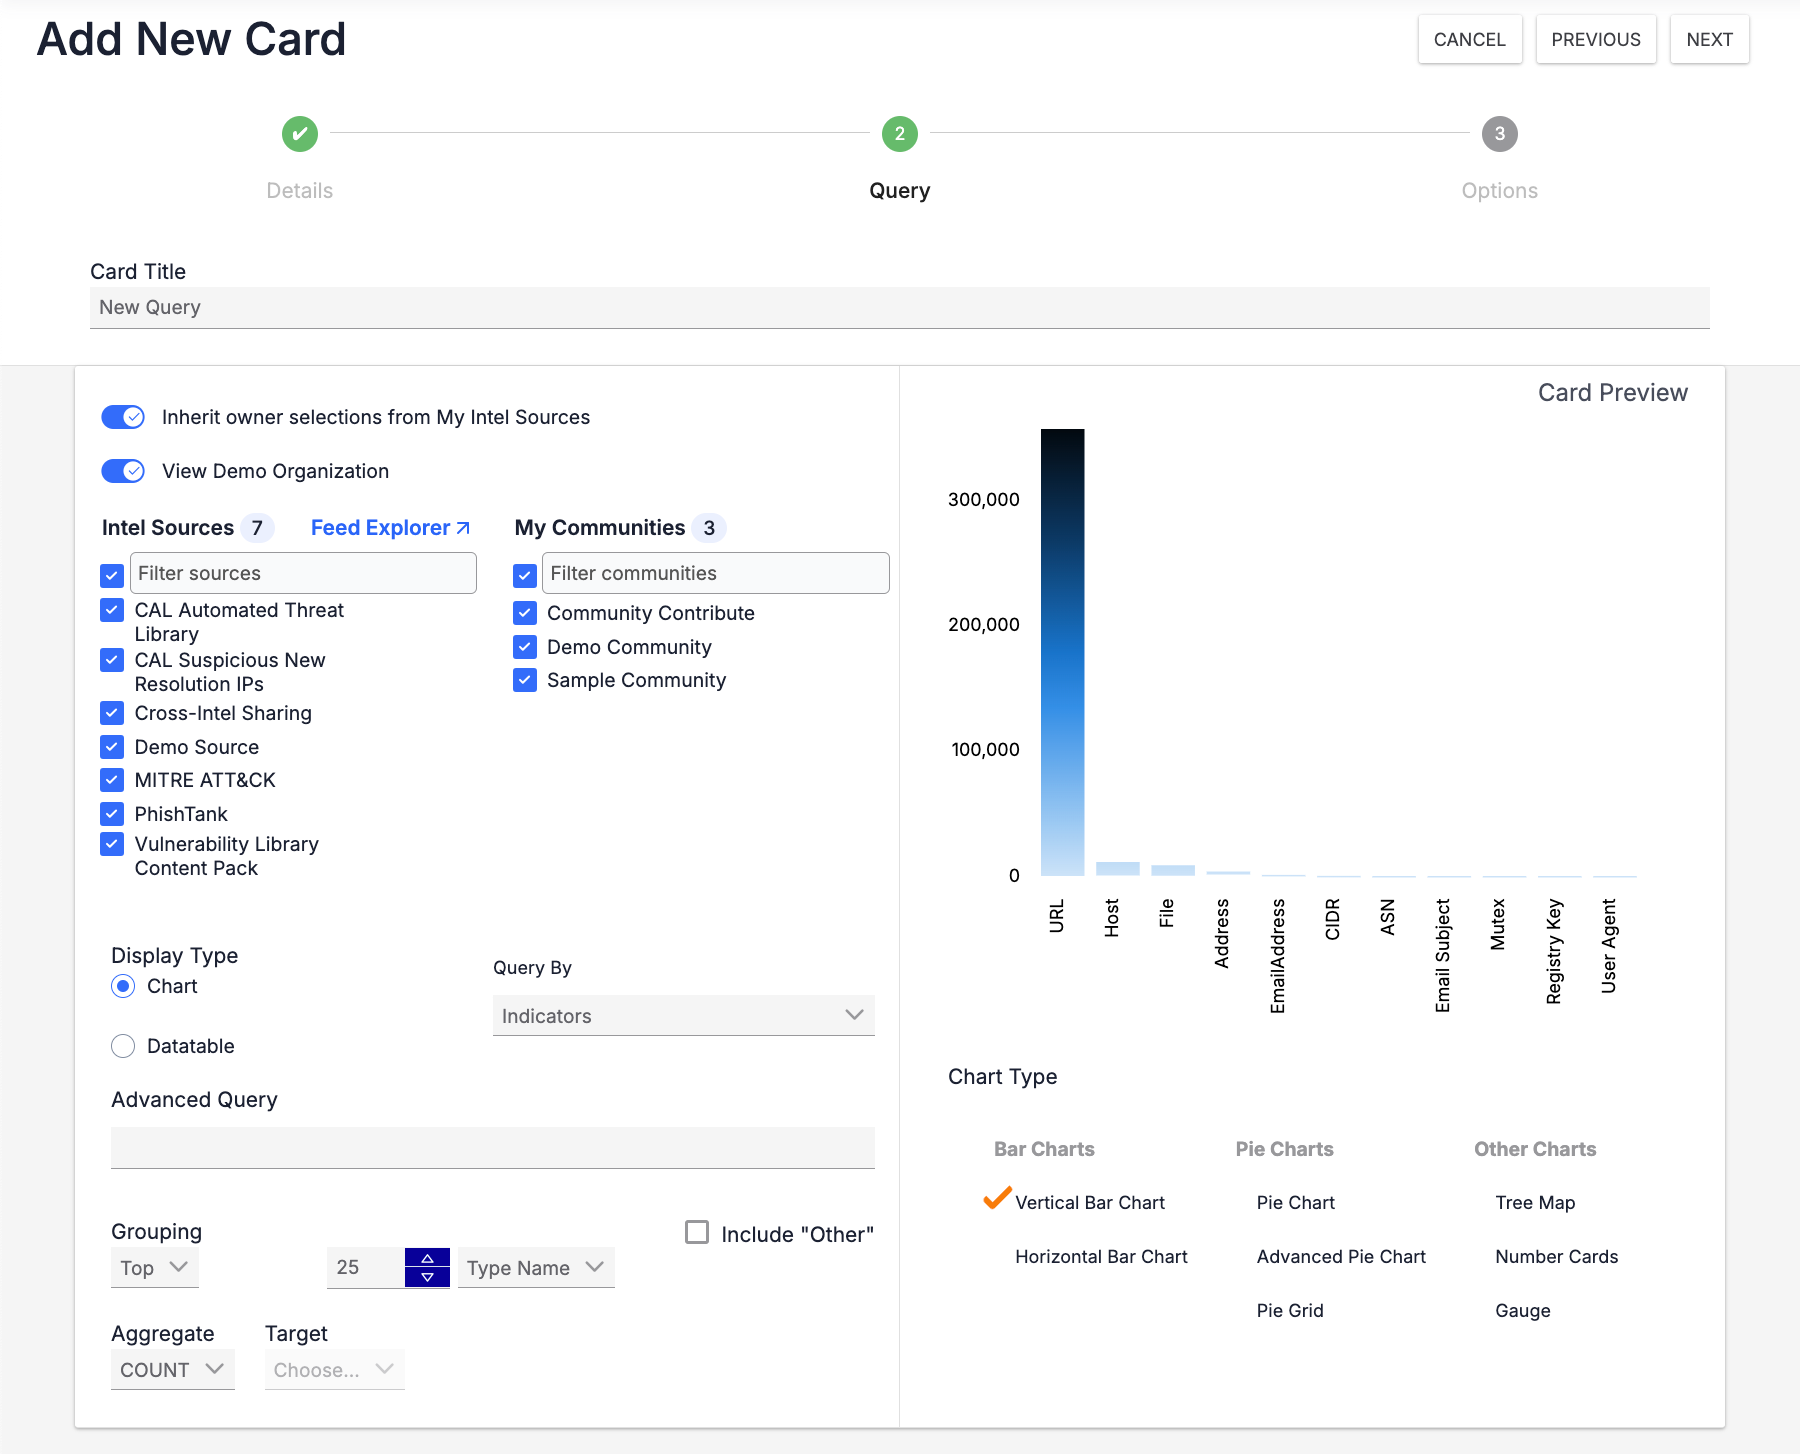
- Owners: Select one or more owners to display data from on the card. To select the same owners that are selected in the My Intel Sources selector, turn on the Inherit owner selections from My Intel Sources toggle. To select a single owner, hover over the owner’s name and click
 only.NoteIf you deselect an owner on the Query step, the Inherit owner selections from My Intel Sources toggle will turn off automatically.NoteIf you are a Super User, a My Orgs section will be displayed in place of the View <Organization name> toggle that you can use to select the Organizations to display data from on the card.ImportantIf you are creating a Query card for Cases or Case Tasks, turn off the Inherit owner selections from My Intel Sources toggle, clear all selections under Intel Sources and My Communities, and leave the View <Organization name> toggle turned on in order to circumvent permissions errors.
 - Display Type: Select whether to display the data as a Chart or a Datatable.
- Query By: Select the ThreatConnect object type for which to query.
- Advanced Query: Enter the TQL query that the card will use.ImportantWhen writing a TQL query that includes an OR operator, enclose the entire query in parentheses to ensure that the query condition is maintained when viewing the Browse screen for a selected chart element displayed on the Query card.NoteSuper Users can construct TQL queries that search for objects belonging to multiple Organizations. See the “Query for Objects Belonging to Multiple Owners” section of Constructing Query Expressions for more information.
- Grouping:
- Select whether to group the results by Top or Bottom from the dropdown under the Grouping heading.
- Enter the number of results to display on the card in the text box to the right of the dropdown under the Grouping heading.
- Select the type of results to display on the card from the dropdown to the right of the text box where you entered the number of results to display on the card.
- Include “Other”: Select this checkbox to include an “Other” category that groups the rest of the results outside of the selections made in the Grouping section. For example, if you configured Top 10 Tags in the Grouping section and selected the Include “Other” checkbox, then in addition to the 10 Tags, there will be an “Other” element (e.g., a bar in a bar graph) that aggregates the results of the remaining Tags.
- Aggregate: This dropdown allows you to aggregate Attributes across Sources in ThreatConnect, so that, for example, they can rate Groups in a Source. For integer-type Attribute Types, these are the available aggregations: AVG, MIN, MAX, and SUM. For non-integer Attribute Types, COUNT is available as an aggregation.
- Target: This dropdown contains the intelligence data that can be aggregated. For example, you can select the aggregation AVG of Confidence Ratings.
- Chart Type: Select the type of chart to display.
- Owners: Select one or more owners to display data from on the card. To select the same owners that are selected in the My Intel Sources selector, turn on the Inherit owner selections from My Intel Sources toggle. To select a single owner, hover over the owner’s name and click
- Click NEXT at the top right of the drawer to proceed to the Options step.
- On the Options step (Figure 3), you can configure the appearance of the New Query card. The available options on this step depend on the type of chart you selected on the Query step. In this example (Vertical Bar Chart), you can configure the card’s color scheme, scheme type, width, height, and bar gap size. You can also specify whether to show the chart’s axes, axis labels, legend, and grid lines; whether to display tooltips when users hover over a chart element on the card in a dashboard; and whether to apply a gradient to the chart’s color scheme.NoteAs you configure options on the Options step, the preview of the dashboard card will update automatically based on the configuration.
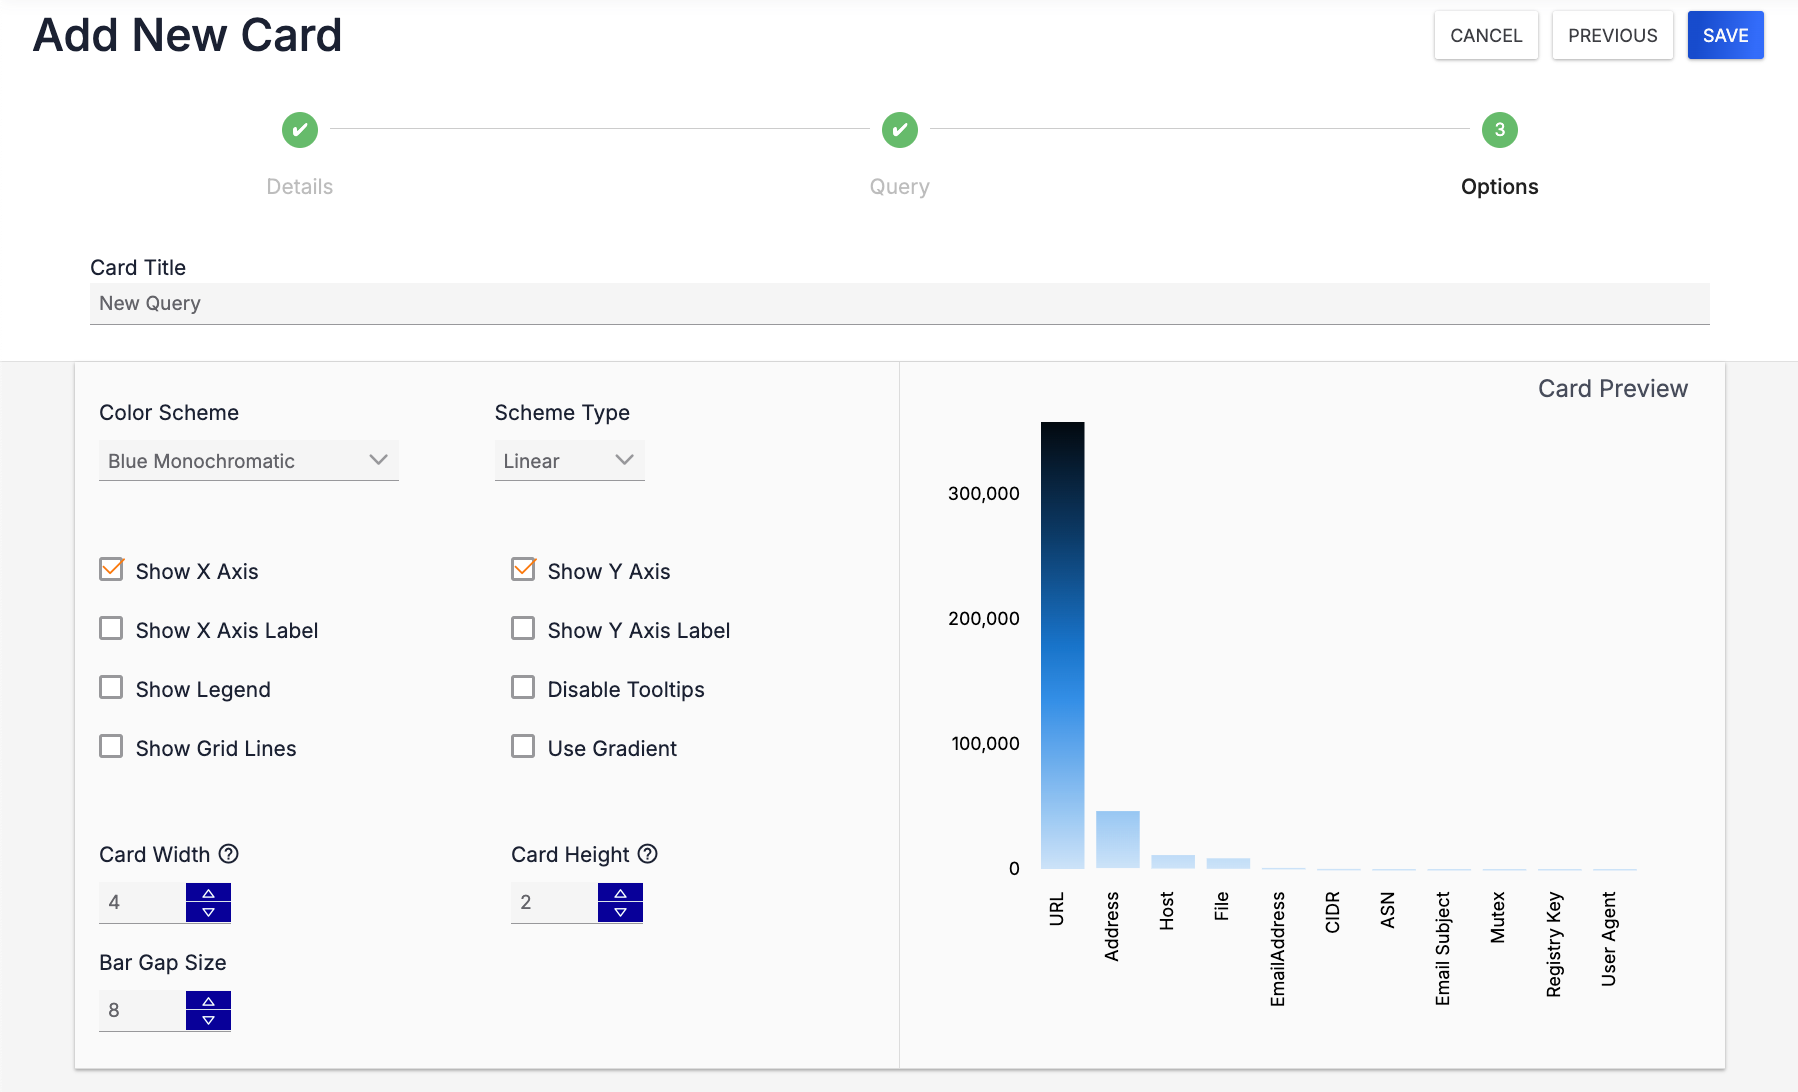
- Click SAVE at the top right of the drawer to add the New Query card to the dashboard.
ThreatConnect® is a registered trademark of ThreatConnect, Inc.
20044-12 v.01.B