Overview
Basic Elements sections let you add visual and text-based elements to a report, including charts, saved Threat Graphs, images, tables, and text blocks.
Before You Start
User Roles
- To add Basic Elements sections to a report, your user account must have an Organization role of Standard User, Sharing User, Organization Administrator, or App Developer.
Adding a Basic Elements Section
Follow these steps to add a Basic Elements section to a report:
- Create a new report or open a saved report.
- If the Add Section drawer does not open automatically in the Report Editor, click + Add Section in the Report Editor toolbar. Alternatively, hover over an existing section in the report and click + Add Above or + Add Below.
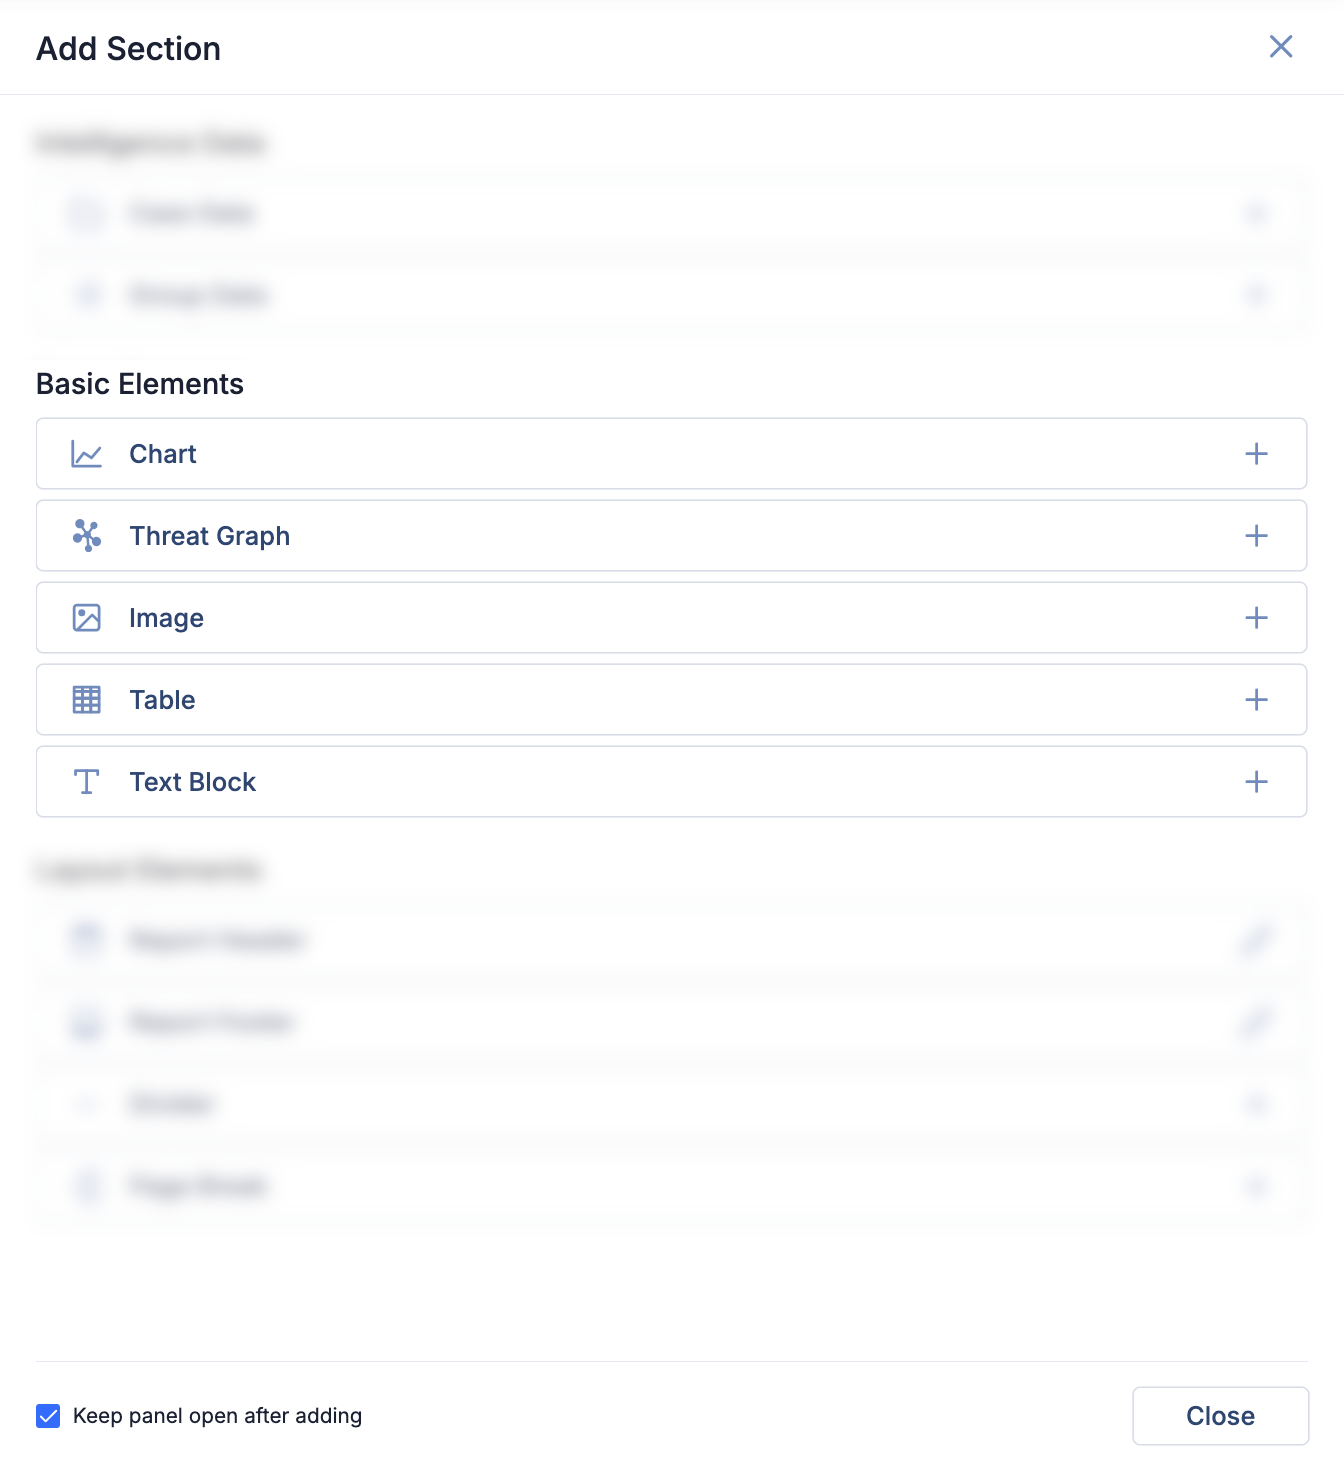
- Select a Basic Elements section from the Add Section drawer (Figure 1), and then configure the section.
Basic Elements Sections
You can add any of the following Basic Elements sections to a report:
Chart
The Chart section can be used to display two types of charts in a report: Query and Metric Charts. To add this section to a report, select Chart from the Add Section drawer (Figure 1). The Add Chart menu will be displayed (Figure 2).
Query
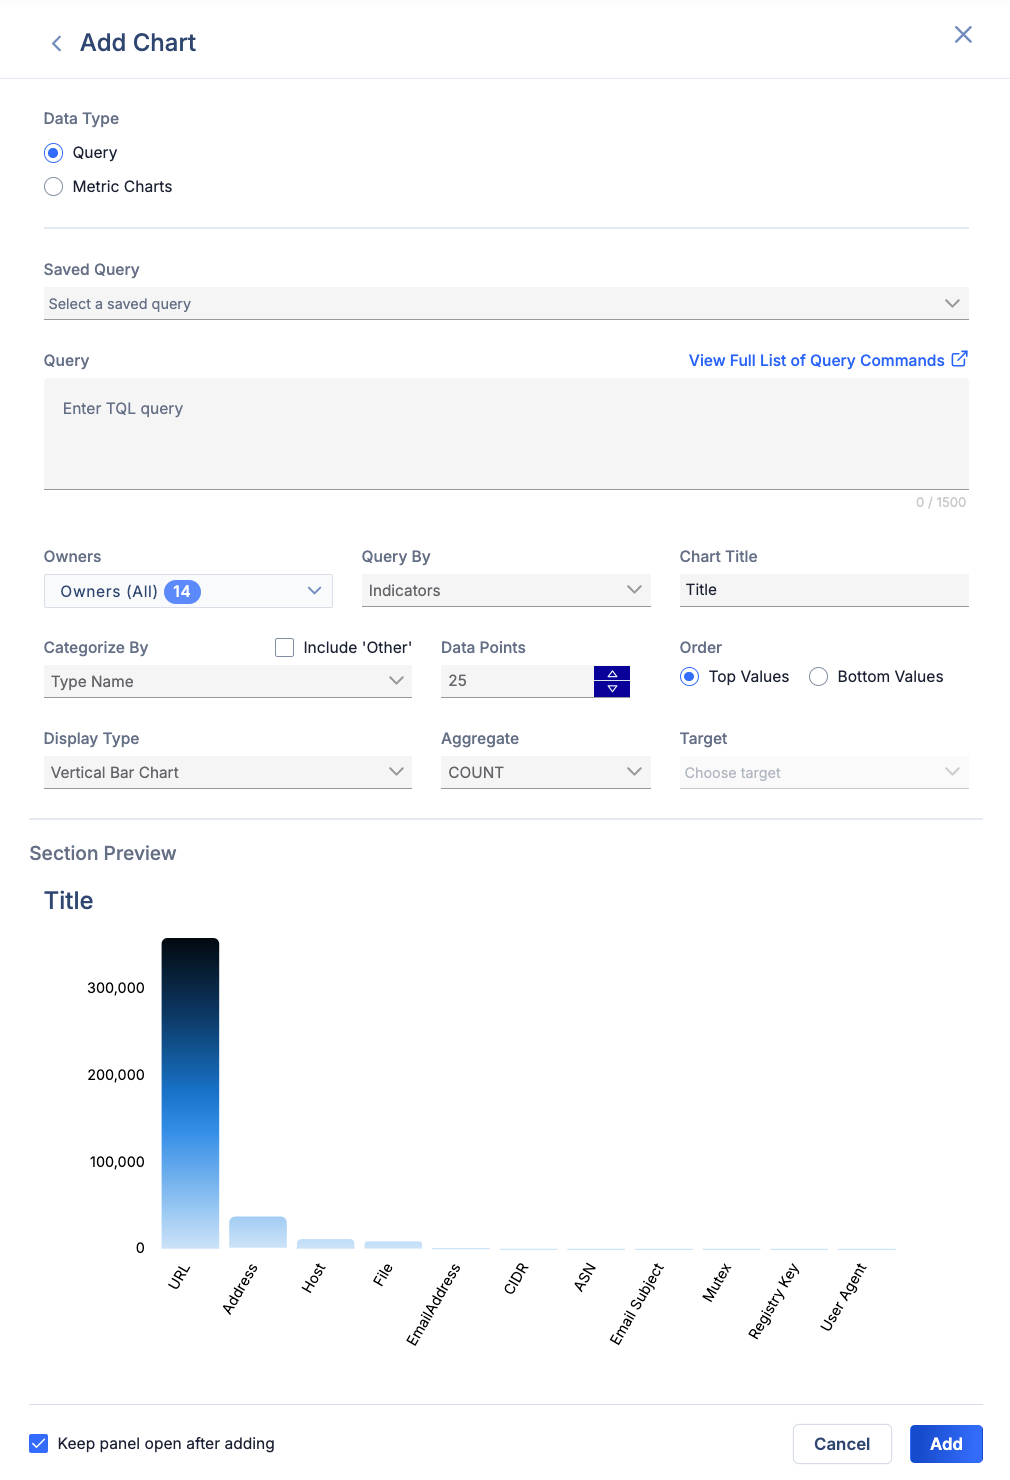
To add a chart based on a ThreatConnect Query Language (TQL) query, select Query as the Data Type. The Add Chart menu will display the following options, as illustrated in Figure 2:
- Saved Query: Select a saved TQL query, if desired. After you select a query, it will be populated in the Query field.ImportantIf there are no TQL queries saved to your user account, the Saved Query dropdown will not be displayed.
- Query: If you did not select a saved TQL query, you may enter a TQL query into this field manually. If you selected a saved TQL query, you may edit the query that is pre-populated in this field, if desired.
- Owners: Select the owner(s) whose data are to be displayed on the chart.
- Query By: Select the type of object by which to query.
- Chart Title: Enter a title for the chart.
- Categorize By: Select the method by which results will be categorized on the chart.
- Data Points: Enter the maximum number of data points (e.g., bars on a bar graph) to display on the chart. The minimum value you can enter is 1, and the maximum value you can enter is 100.
- Include 'Other': Select this checkbox to include an Other category that contains results that do not belong to the categories displayed on the chart. For example, if you select Security Label from the Categorize By dropdown, enter 2 for the Data Points option, and select the Include 'Other' checkbox, two data points will be displayed on the chart: one corresponding to a category representing a single Security Label (e.g., TLP:GREEN) and another corresponding to an Other category containing results without that Security Label applied to them (i.e., results without the TLP:GREEN Security Label applied to them).
- Order: Select whether to order data points from highest to lowest values (Top Values) or lowest to highest values (Bottom Values).NoteIf you selected the Include 'Other' checkbox, the data point corresponding to the Other category will not be affected by the specified sort order (i.e., it will always be placed at the “end” of the chart).
- Display Type: Select the type of chart to display.
- Aggregate: Select the aggregate function to use for calculating data point values. Available options include the following:
- COUNT: Select this option to return the number of items found in each category displayed on the chart.
- AVG: Select this option to return the average of all values in the selected Target for each category displayed on the chart. For example, if you are querying by Indicators and select Threat Rating from the Target dropdown, each category’s data point will represent the average Threat Rating of all Indicators in that category.
- MIN: Select this option to return the minimum value in the selected Target for each category displayed on the chart. For example, if you are querying by Indicators and select Threat Rating from the Target dropdown, each category’s data point will represent the minimum Threat Rating of all Indicators in that category.
- MAX: Select this option to return the maximum value in the selected Target for each category displayed on the chart. For example, if you are querying by Indicators and select Threat Rating from the Target dropdown, each category’s data point will represent the maximum Threat Rating of all Indicators in that category.
- SUM: Select this option to return the sum of all values in the selected Target for each category displayed on the chart. For example, if you are querying by Indicators and select Threat Rating from the Target dropdown, each category’s data point will represent the total Threat Rating of all Indicators in that category.
- Target: If using the AVG, MIN, MAX, or SUM functions, select a target data source for the function to use in its calculations. If using the COUNT function, this field will be grayed out.
- Section Preview: This section displays a preview of the chart that will be added to the report.
- Click Add to add the section to the report.
Metric Charts
To add a System Metrics, User Metrics, Case Metrics, or Playbook Metrics chart, select Metric Charts as the Data Type. The Add Chart menu will display the following options, as illustrated in Figure 3:
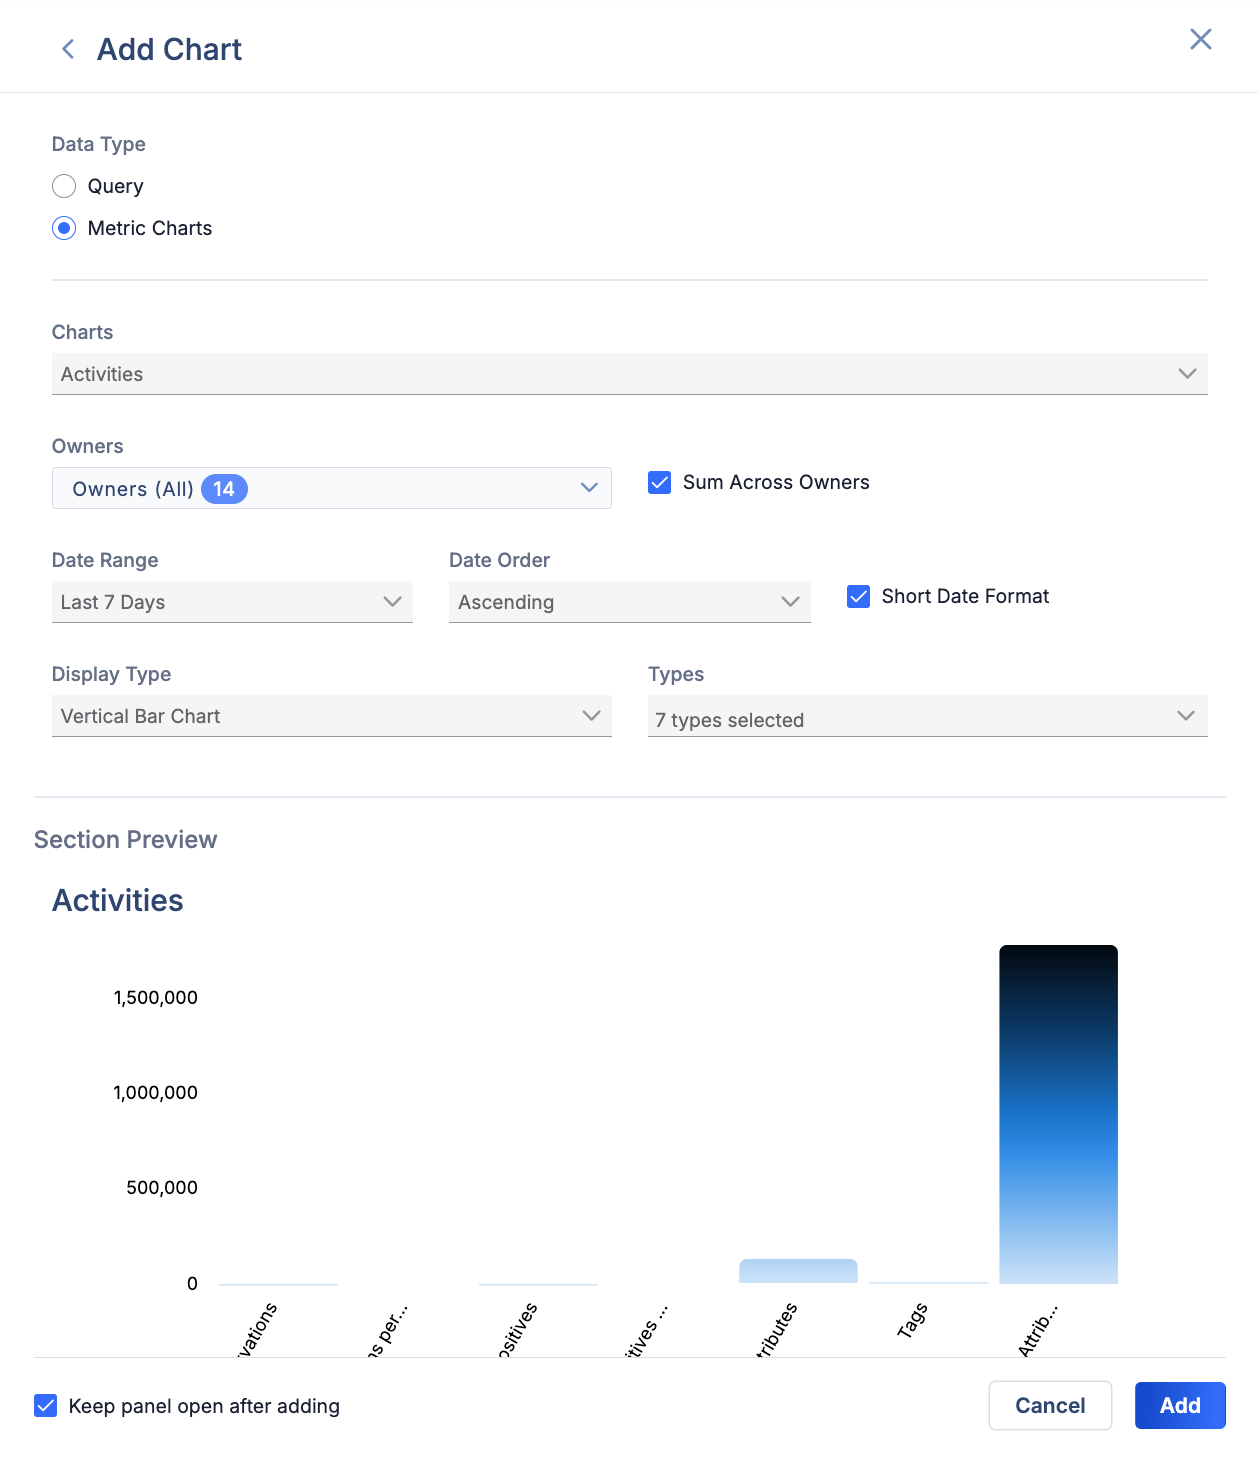
- Charts: Select a chart to add to the report. These charts are similar to the Metrics cards available for dashboards. For more information on System Metrics, User Metrics, and Playbook Metrics, see the “Metric Card” section of Adding Content to a Dashboard. For more information on Case Metrics, see Cases Metrics.
- Chart configuration options: The configuration options displayed on the Add Chart menu will vary based on the chart selected from the Charts dropdown. After selecting a chart, configure the available options as desired.
- Section Preview: This section displays a preview of the chart that will be added to the report.
- Click Add to add the section to the report.
Threat Graph
The Threat Graph section can be used to display a saved Threat Graph in a report. To add this section to a report, select Threat Graph from the Add Section drawer (Figure 1). The Add Threat Graph menu will be displayed (Figure 4).
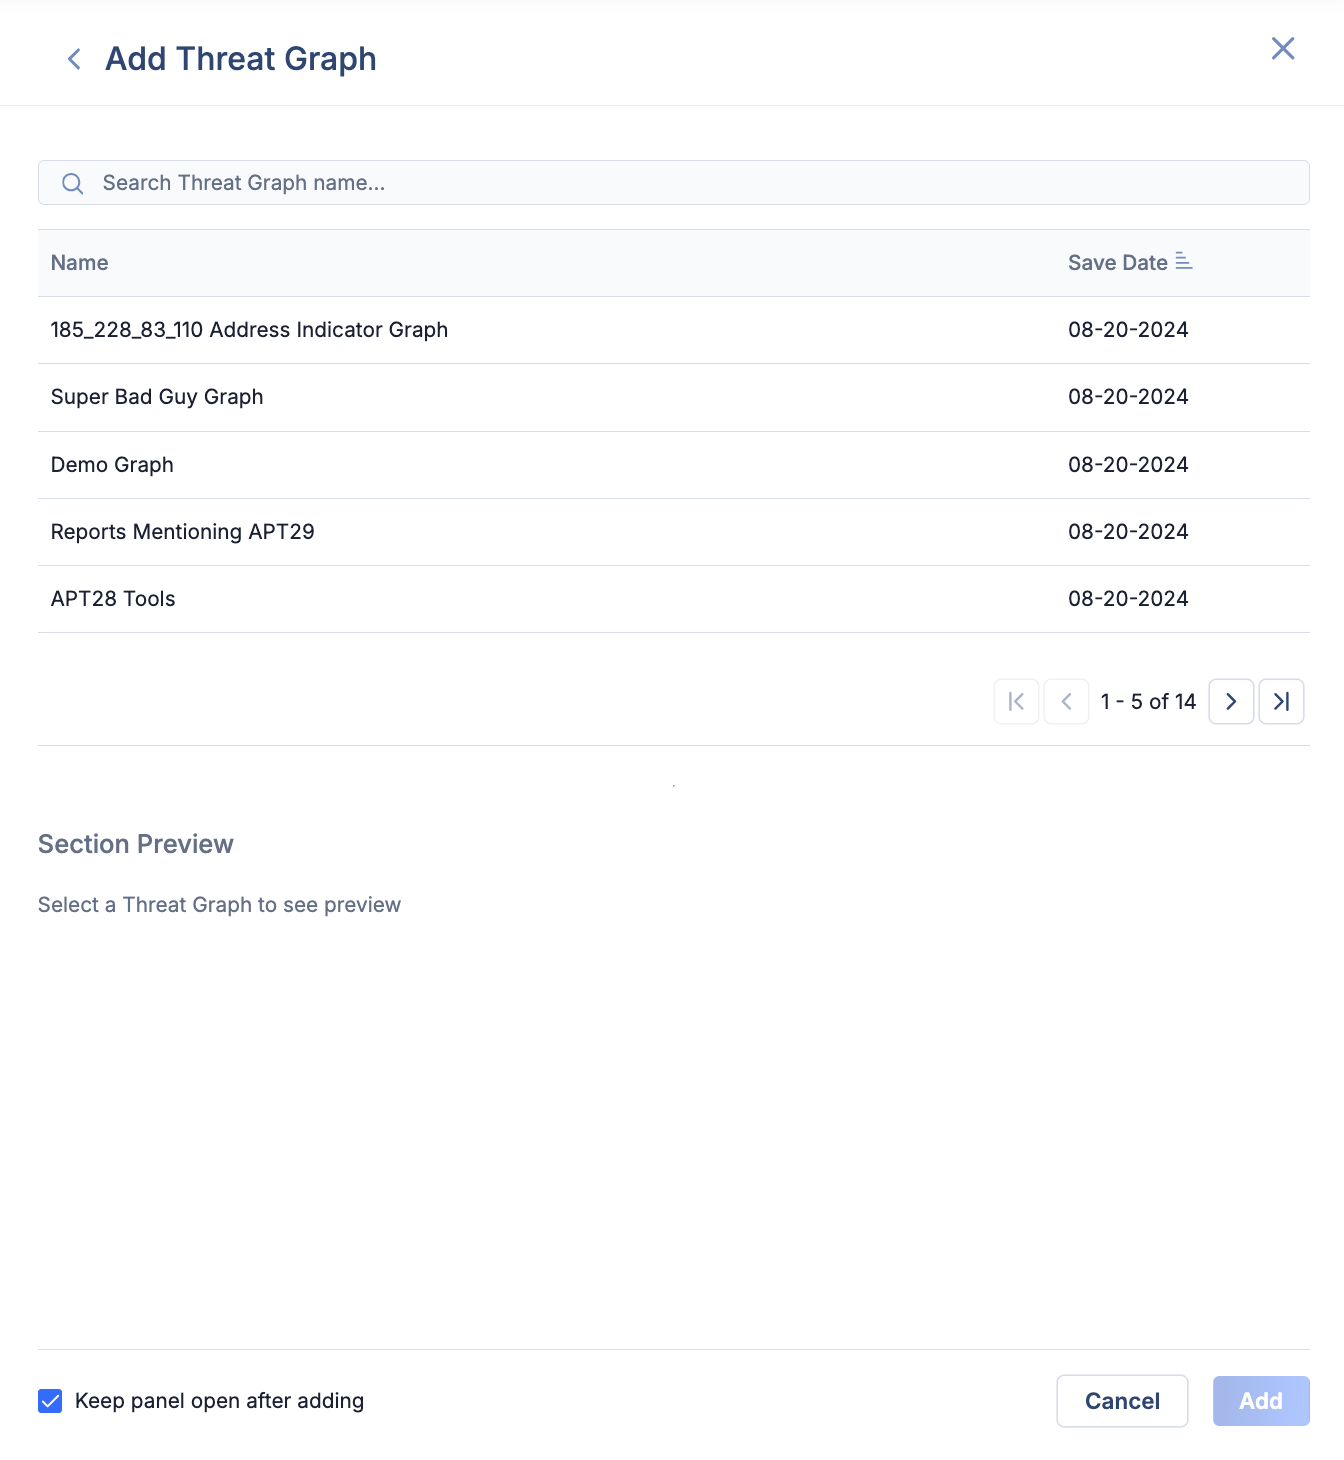
- Select a saved Threat Graph from the table. To filter saved Threat Graphs by name, enter the desired term in the search bar above the table. To sort saved Threat Graphs in the table by name or their most recent save date, click the Name or Save Date column header, respectively.
- Section Preview: After you select a saved Threat Graph, this section will display a preview of the Threat Graph that will be added to the report.
- Click Add to add the section to the report.
Image
The Image section can be used to upload and display an image in a report. Before uploading your image, ensure that the image file meets the following conditions:
- File type: PNG, JPG, or JPEG file
- Maximum file size: 500 kilobytes (KB)
- Maximum width: 755 pixels
- Maximum height: 854 pixels
To add this section to a report, select Image from the Add Section drawer (Figure 1). The Add Image menu will be displayed (Figure 5).
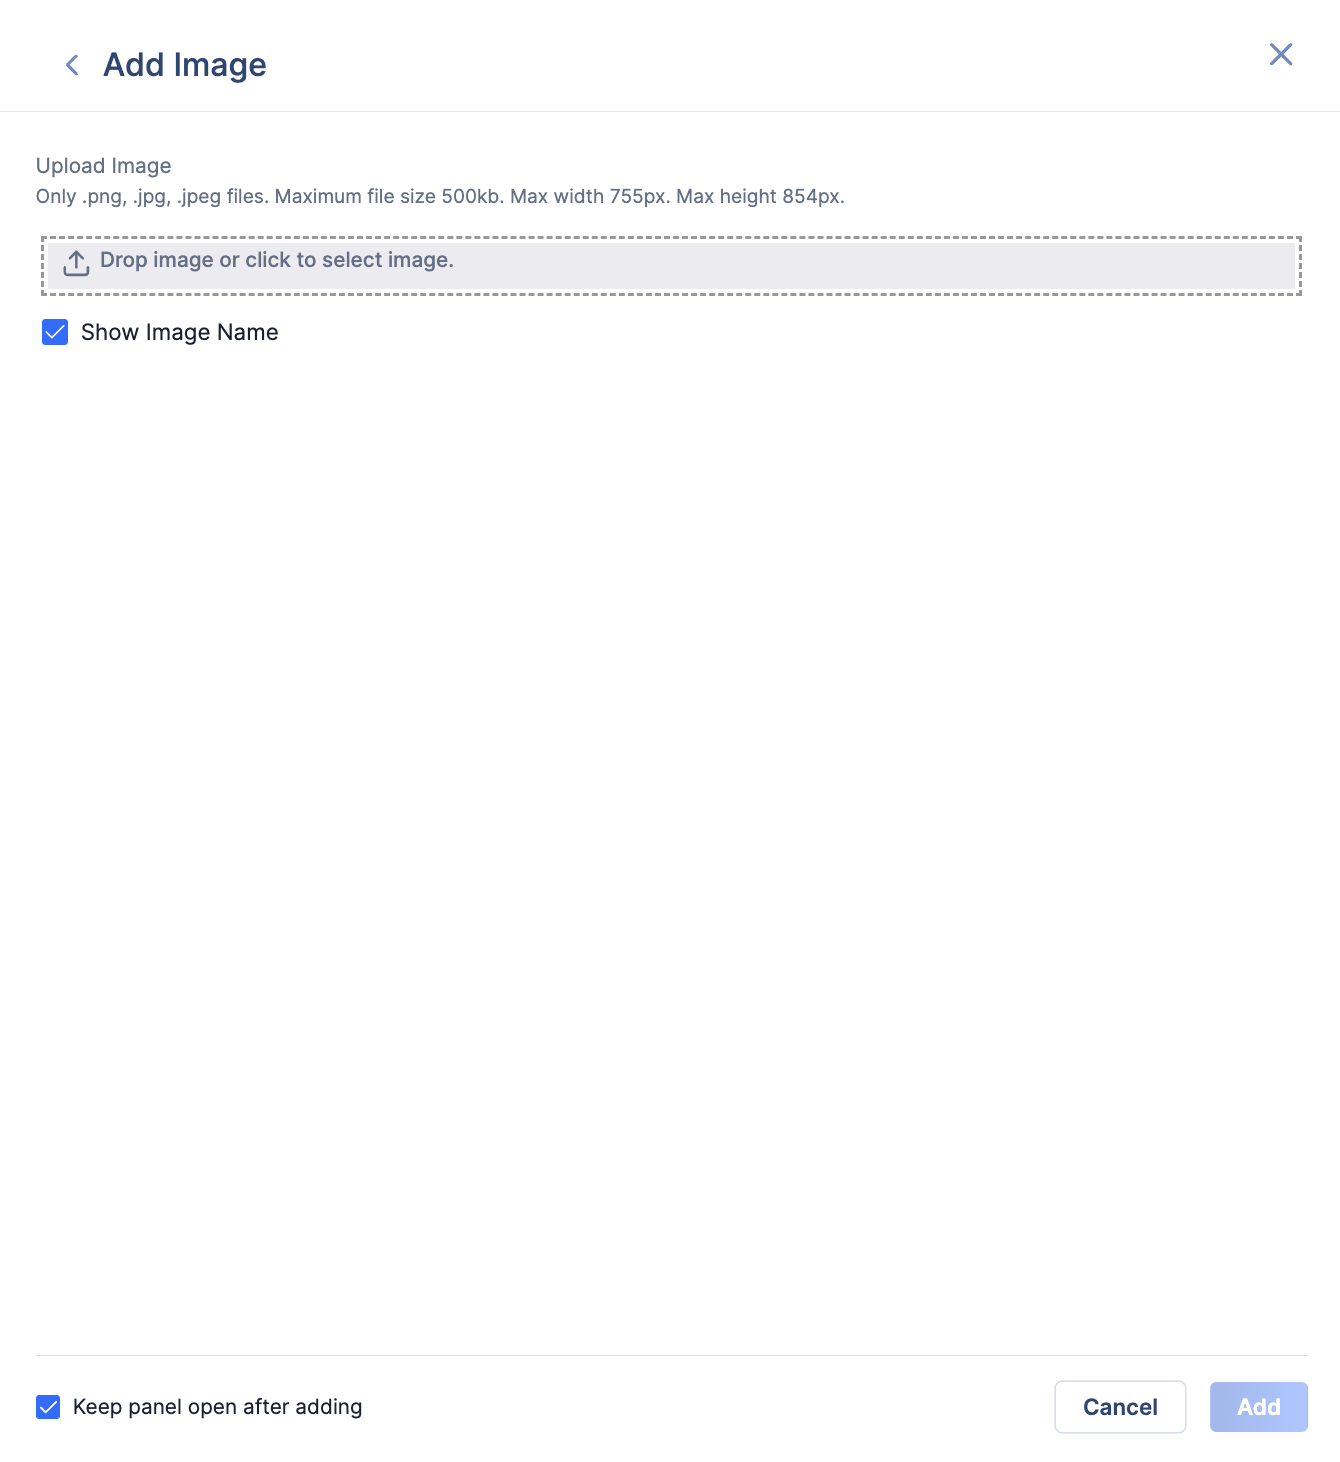
- Drop image or click to select image.: Drag and drop a file into the box, or click the box to browse for and select a file. If the image was successfully uploaded, a preview of it will be displayed below the Show Image Name checkbox; otherwise, an error message will be displayed below the Drop image or click to select image. box indicating why the image was not uploaded.
- Show Image Name: Select this checkbox to display the image’s filename in the Image section that will be added to the report.
- Click Add to add the section to the report.
Table
The Table section can be used to display two types of tables in a report: Query and Preset tables. To add this section to a report, select Table from Add Section drawer (Figure 1). The Add Table menu will be displayed (Figure 6).
Query
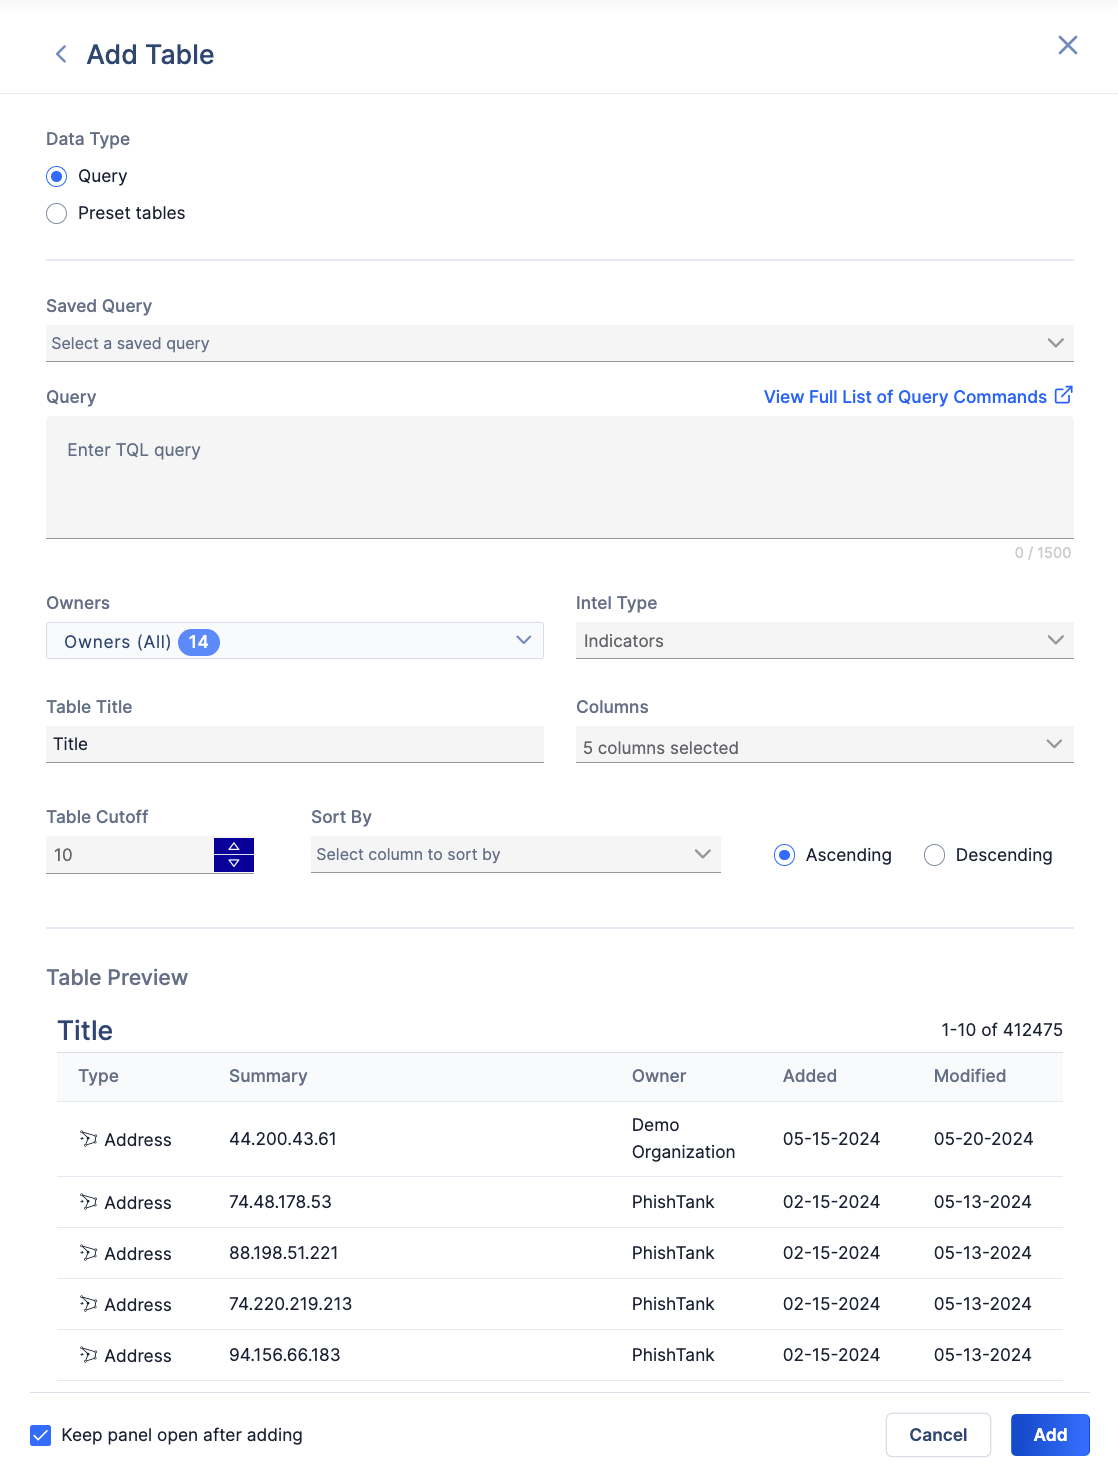
To add a table based on a TQL query, select Query as the Data Type. The Add Table menu will display the following options, as illustrated in Figure 6:
- Saved Query: Select a saved TQL query, if desired. After you select a query, it will be populated in the Query field.ImportantIf there are no TQL queries saved to your user account, the Saved Query dropdown will not be displayed.
- Query: If you did not select a saved TQL query, you may enter a TQL query into this field manually. If you selected a saved TQL query, you may edit the query that is pre-populated in this field, if desired.
- Owners: Select the owner(s) whose data are to be displayed on the table.
- Intel Type: Select the type of object by which to query.
- Table Title: Enter a title for the table.
- Columns: Select the columns to display on the table. Available table columns will vary based on the type of object selected from the Intel Type dropdown.
- Table Cutoff: Enter the maximum number of objects to display in the table. The minimum value you can enter is 5, and the maximum value you can enter is 80.
- Sort By: Select the column by which to sort objects in the table. You can sort the table only by the columns selected in the Columns dropdown.
- Ascending/Descending: Select whether to sort objects displayed in the table in ascending or descending order. The sort order will correspond to the column by which the table is sorted.
- Table Preview: This section displays a preview of the table that will be added to the report.
- Click Add to add the section to the report.
Preset Tables
To add a predefined table to a report, select Preset tables as the Data Type. The Add Table menu will display the following options, as illustrated in Figure 7:
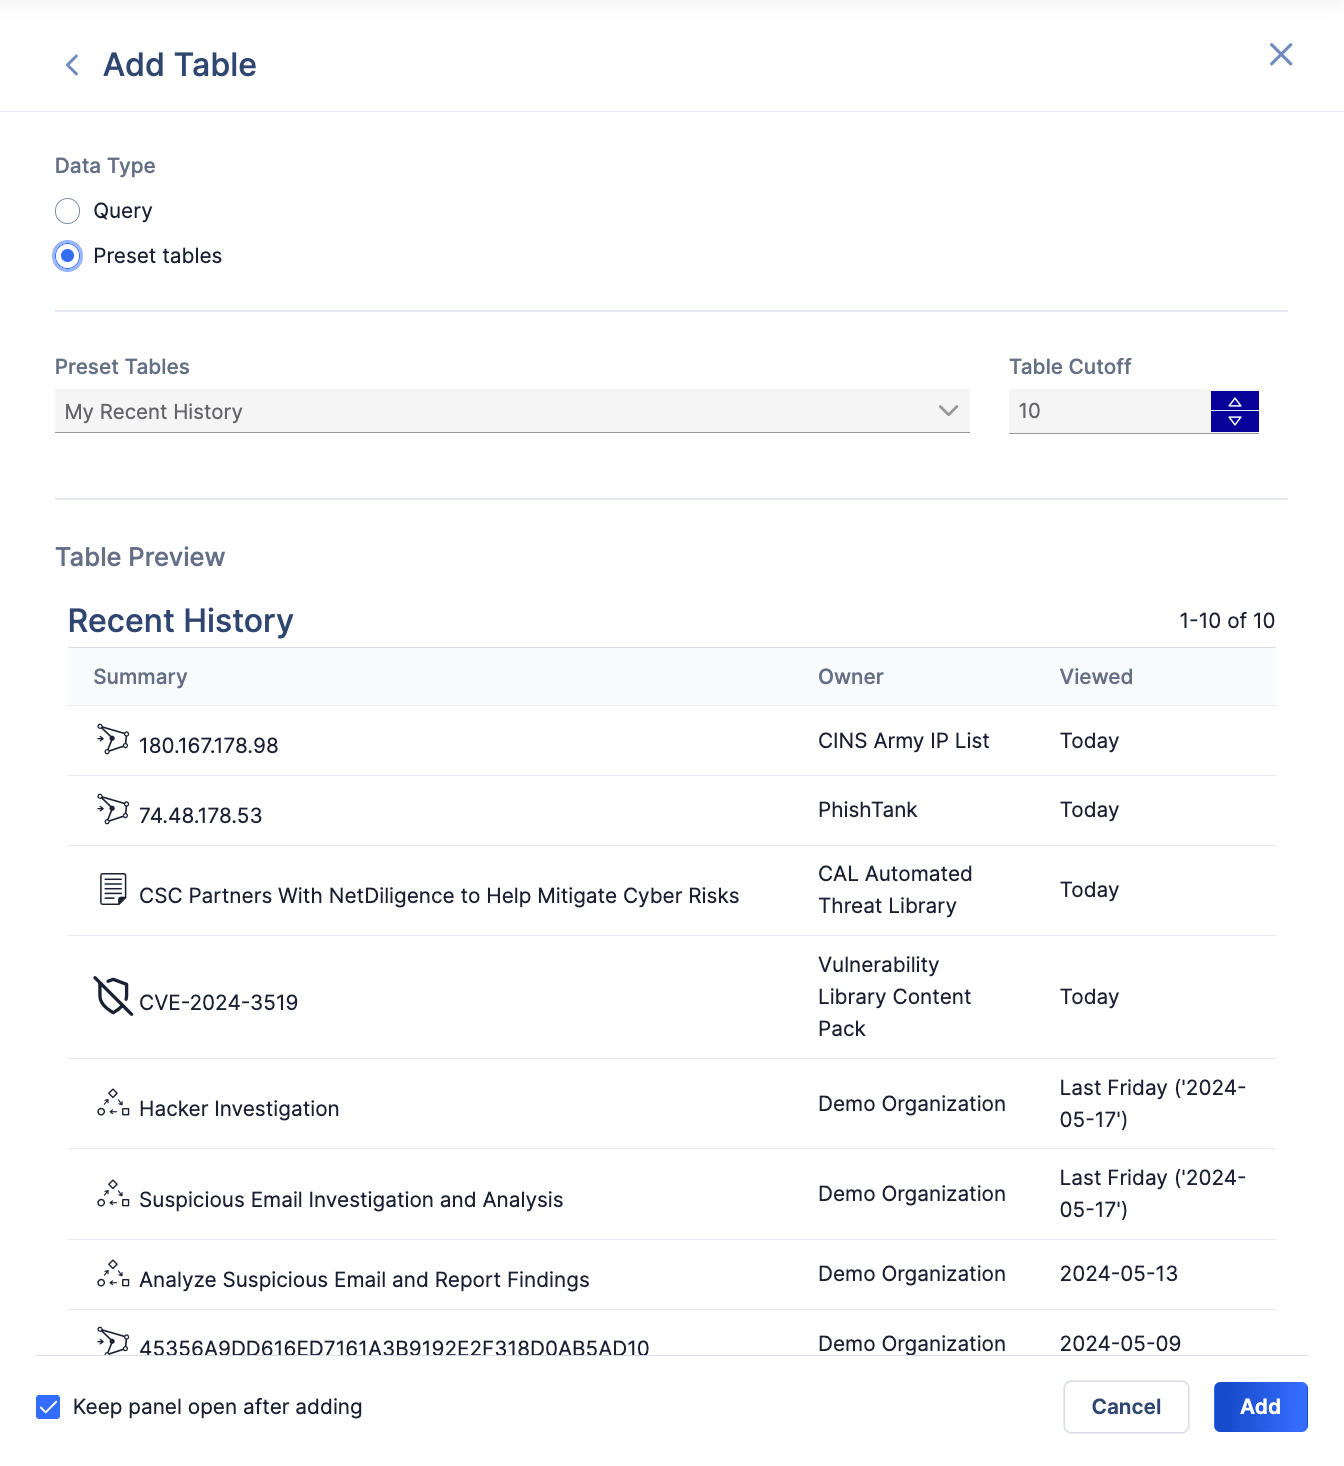
- Preset Tables: Select a table to add to the report. Preset tables are predefined and cannot be configured, other than to adjust how many objects to display in the table.
- Table Cutoff: Enter the maximum number of objects to display in the table. The minimum value you can enter is 5, and the maximum value you can enter is 80.
- Table Preview: This section displays a preview of the table that will be added to the report.
- Click Add to add the section to the report.
Text Block
The Text Block section can be used to display a block of formatted text in a report. To add this section to a report, select Text Block from the Add Section drawer (Figure 1). The Add Text Block menu will be displayed (Figure 8).
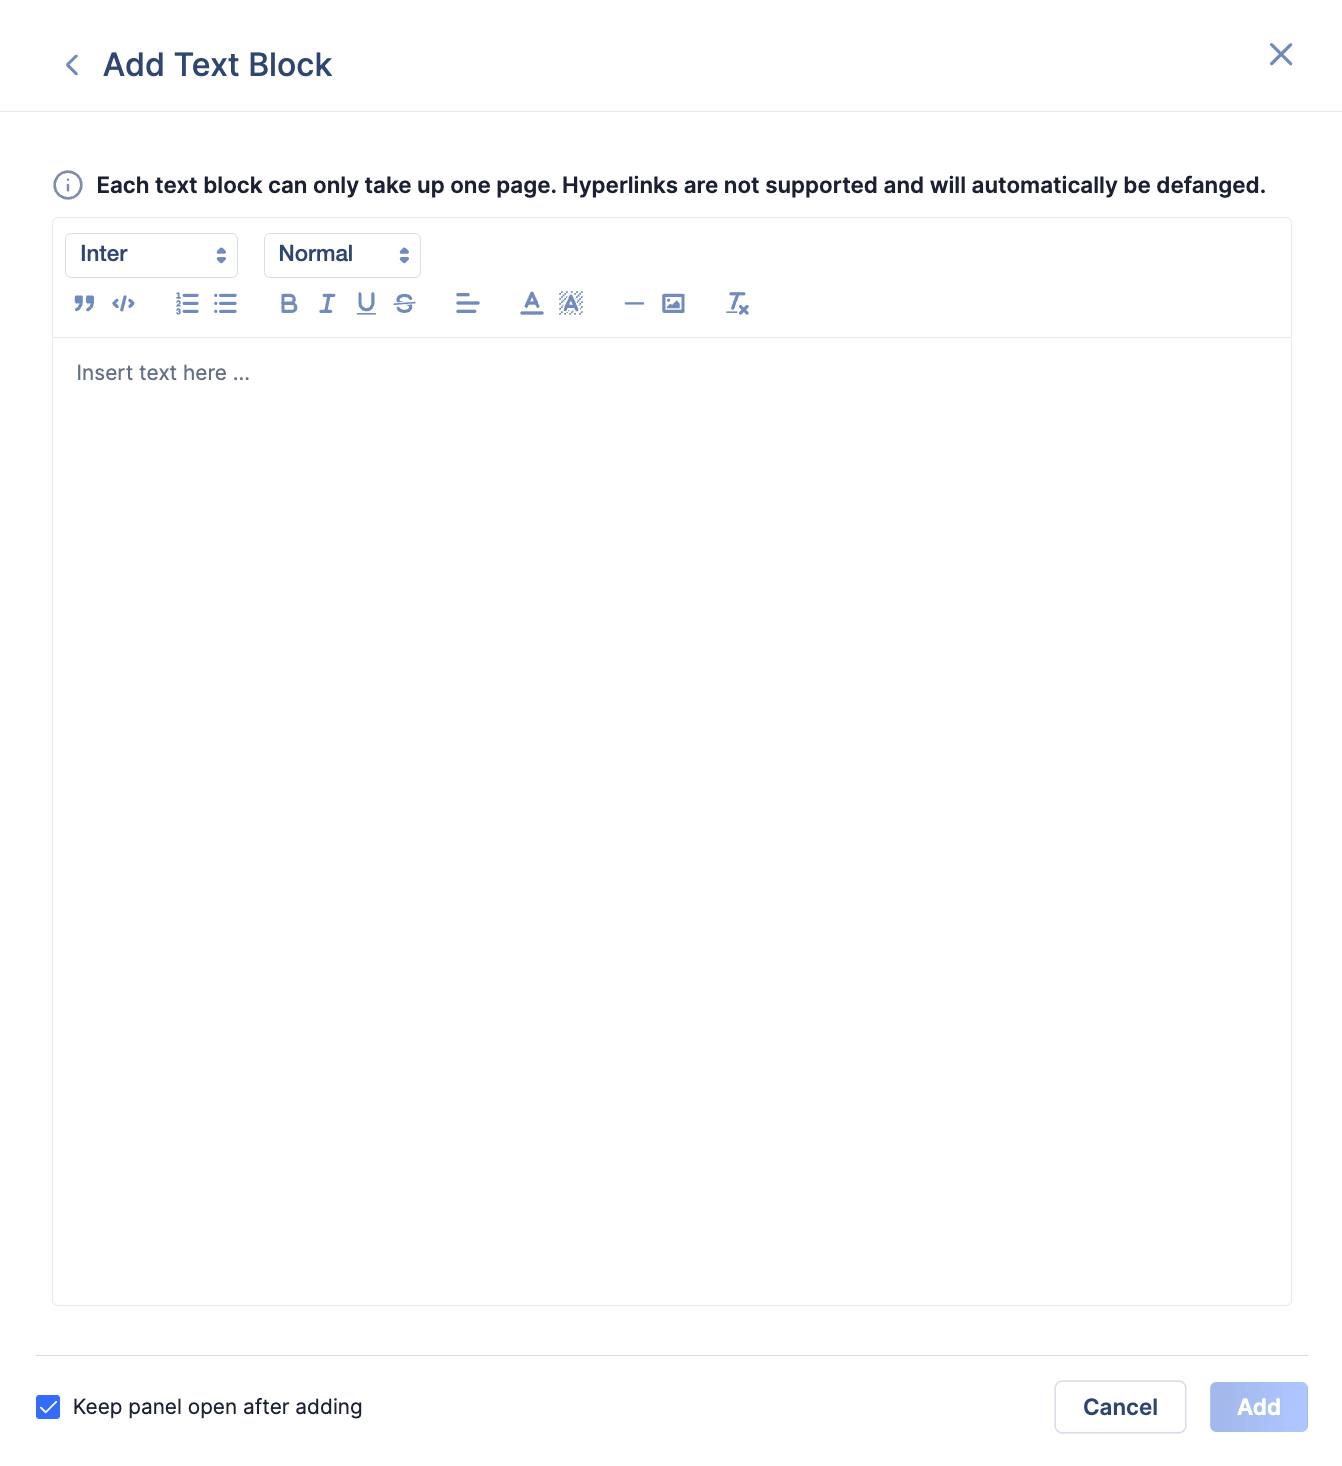
- Enter text into the text editor. You can format text using the toolbar along the top of the text box. Available formatting options include the following:
- Fonts: Select a font style to use.
- Headings: Select a heading level to use, or select Normal to use normal text.
 : Click this icon to create a block quote.
 : Click this icon to create a code block.
 : Click this icon to create an ordered (i.e., numbered) list.
 : Click this icon to create an unordered (i.e., bulleted) list.
 : Click this icon to bold text.
 : Click this icon to italicize text.
 : Click this icon to underline text.
 : Click this icon to strike through text.
 : Click this icon to set the text alignment.
 : Click this icon to set the text color.
 : Click this icon to set the background color for text.
 : Click this icon to create a horizontal rule.
 : Click this icon to insert a JPEG or PNG file. You can also drop images directly into the text editor to insert them. Once an image is inserted, you can adjust its size by clicking on it and using its resize handles.
 : Click this icon to clear all formatting applied to the selected text.
- Click Add to add the section to the report.
A Text Block section may take up only one page of a report. If the length of the text entered into the text editor exceeds this limit, a message stating Height of your content must be less than a report page. will be displayed at the top of the Add Text Block menu, and the Add button will be grayed out.
Text Block Tips and Considerations
- If you are working with a report created before the release of ThreatConnect 7.4 that contains a Text Block section, the existing content in that section will be preserved and migrated to the new text editor introduced in ThreatConnect 7.4 automatically.
- To add a table to a Text Block section, create and format the table in Google Docs™ and then copy and paste it into the text editor. If making changes to a table added to a Text Block section, copy and paste the table into Google Docs, make the desired changes, and copy and paste it back into the Text Block text editor.NoteNative support for tables will be added to the Text Block section in a future release of ThreatConnect.
- Images inserted into a Text Block section are compressed and optimized automatically. This process includes resizing the image to have either a maximum width of 762 pixels or a maximum height of 1000 pixels, whichever is greater.
- You cannot add functioning hyperlinks to a Text Block section. URLs entered into the text editor, including URLs for web addresses and images, will be defanged automatically in the Text Block section displayed on the Report Editor and for exported PDF and HTML files.
ThreatConnect® is a registered trademark of ThreatConnect, Inc.
Google Docs™ is a trademark of Google LLC.
20144-04 v.04.A