Overview
The Threat Graph feature in ThreatConnect® provides a graph-based interface that you can use to discover, visualize, and contextualize associations and relationships between Indicators, Groups, Cases, and Tags. The first step in this process is to open Threat Graph and view an Indicator, Group, Case, or Tag within it. From there, you can click on a node corresponding to the object and begin analyzing and exploring it further.
Before You Start
User Roles
- To view Indicators, Groups, and Tags in an Organization in Threat Graph, your user account can have any Organization role.
- To view Indicators, Groups, and Tags in a Community or Source in Threat Graph, your user account can have any Community role except Banned for that Community or Source.
- To view Cases in an Organization in Threat Graph, your user account can have any Organization role except App Developer.
Prerequisites
- To view Cases in Threat Graph, turn on Workflow for your Organization on the Account Settings screen (must be an Accounts Administrator, Operations Administrator, or System Administrator to perform this action).
Viewing Indicators, Groups, and Tags in Threat Graph
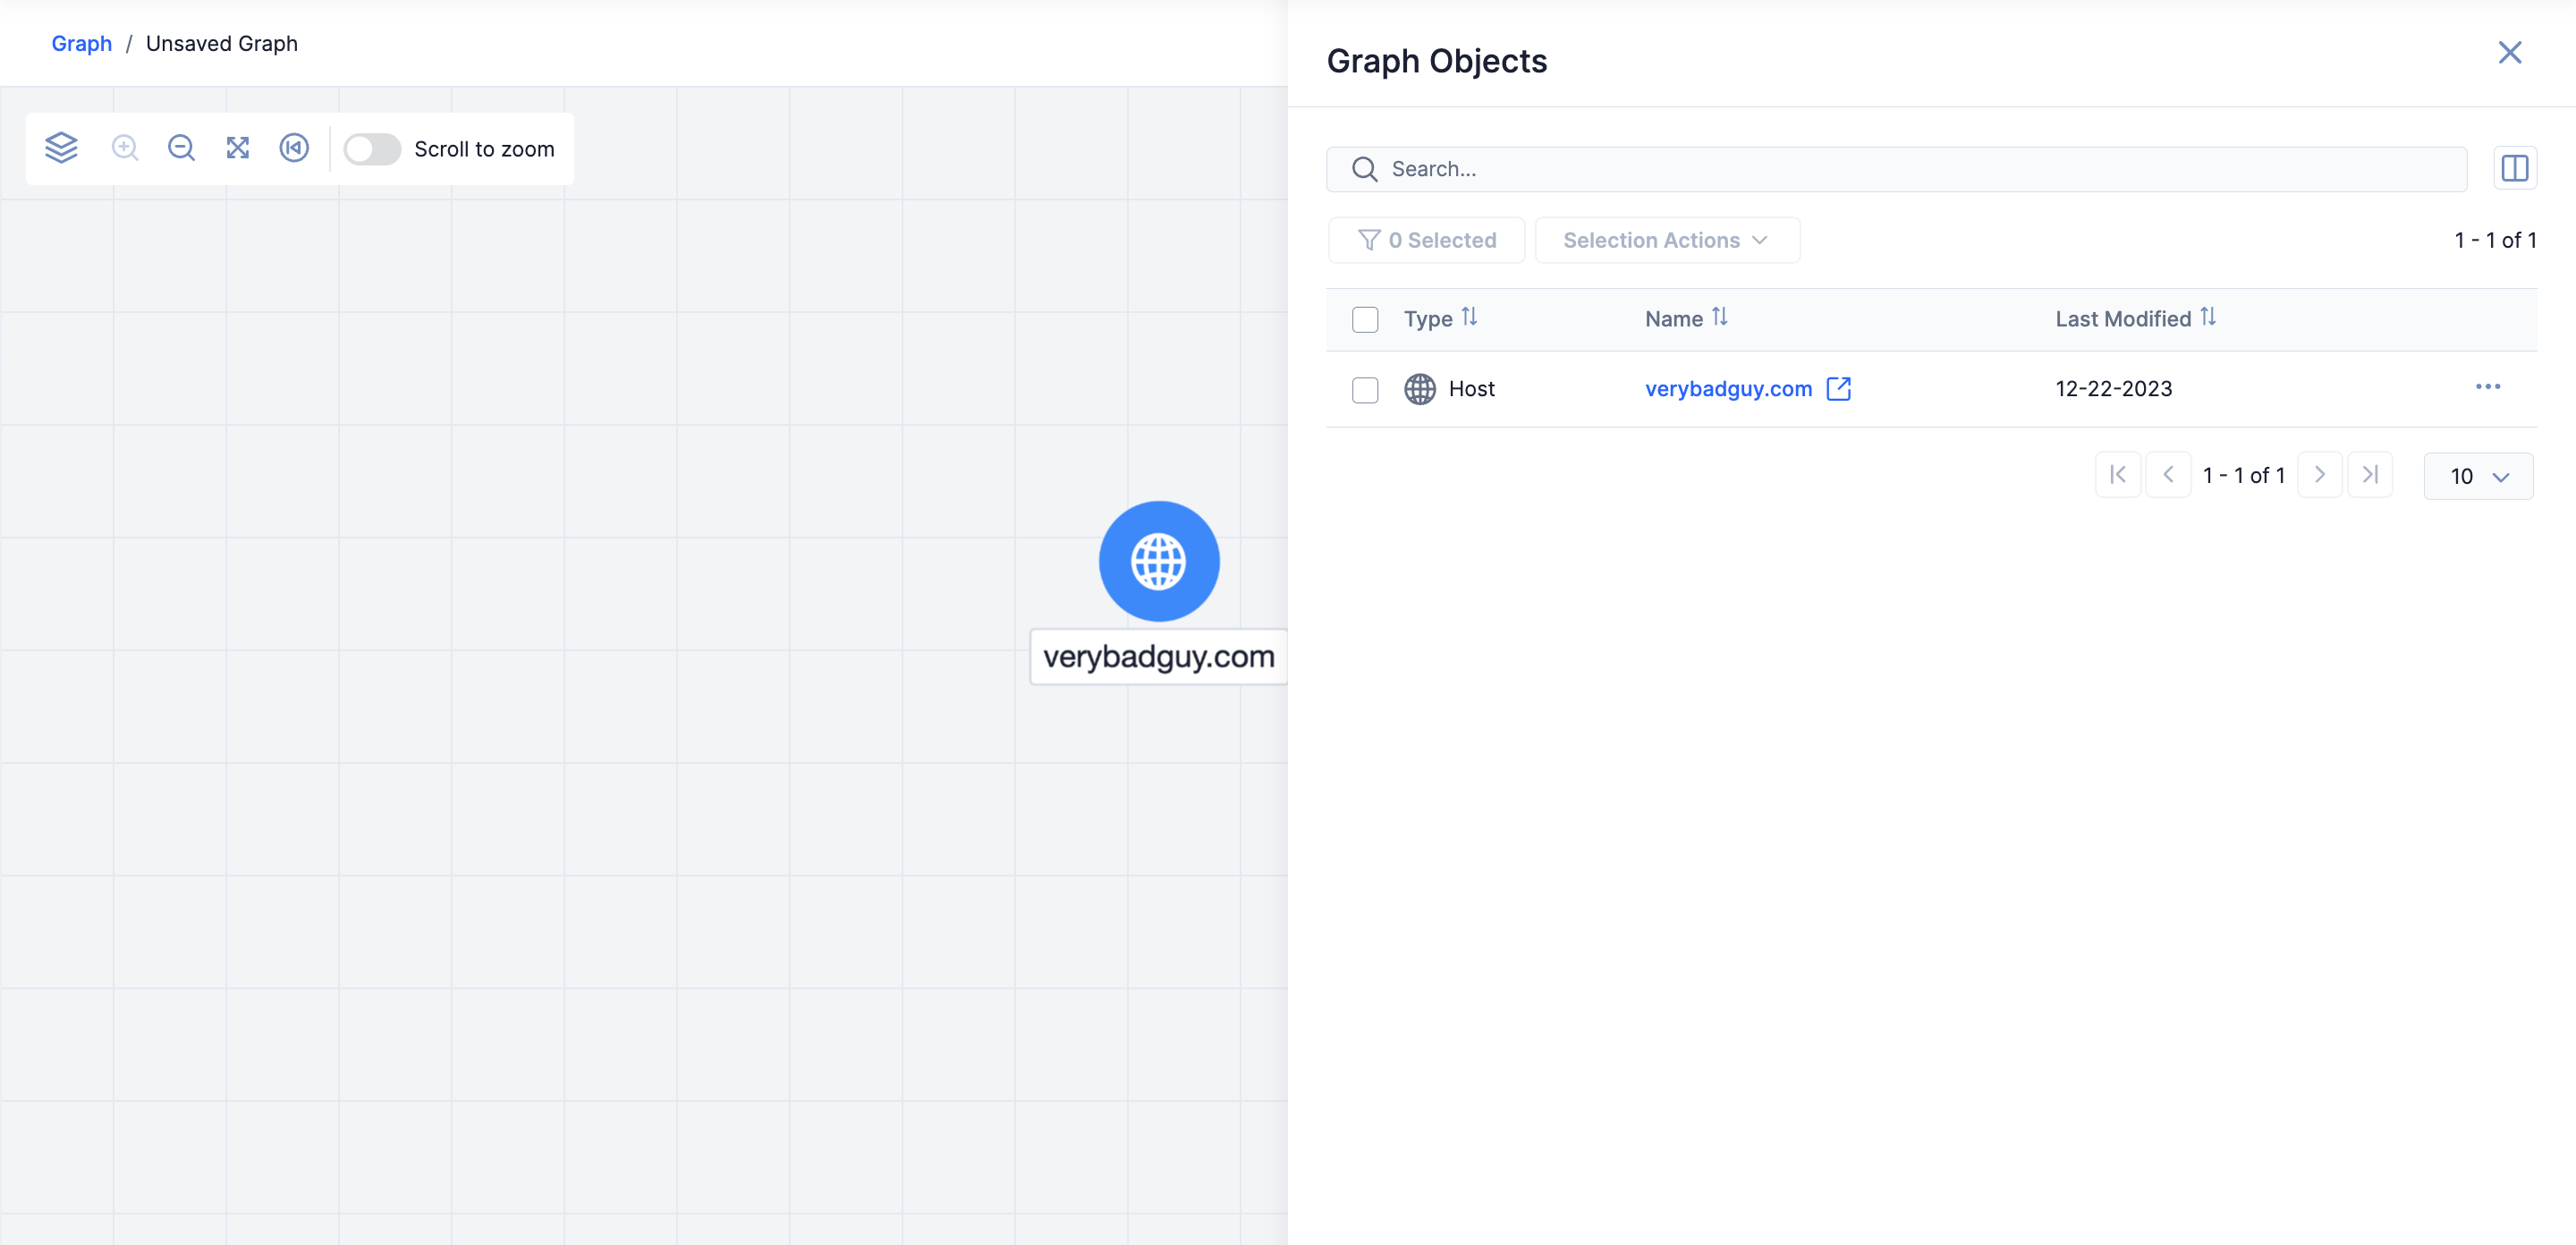
To view an Indicator, Group, or Tag in Threat Graph, you must open Threat Graph from the object’s Details drawer, the object’s Details screen, or the Search screen when the object is returned as a search result. After Threat Graph opens, it will display an origin node corresponding to the selected object on the graph. The node’s shape will depend on the selected object’s type, where a circle represents an Indicator, an octagon represents a Group, and a pentagon represents a Tag.
 in the toolbar at the top left of the graph.
Opening Threat Graph From the Details Drawer (Indicators, Groups, and Tags)
Follow these steps to open Threat Graph from the Details drawer for an Indicator, Group, or Tag:
- Open the Details drawer for an Indicator, Group, or Tag.
- If viewing the Details drawer for an Indicator or Tag, click Explore in Graph in the drawer’s header; if viewing the Details drawer for a Group, click Visual Analysis in the drawer’s header and select Explore in Graph. Threat Graph will open with an origin node corresponding to the selected object on the graph.
Opening Threat Graph From the Details Screen (Indicators and Groups)
Follow these steps to open Threat Graph from the Details screen for an Indicator or Group:
- Navigate to the Details screen for an Indicator or Group.
- If viewing the Details screen for an Indicator, click Explore in Graph in the screen’s header; if viewing the Details screen for a Group, click Visual Analysis in the screen’s header and select Explore in Graph. Threat Graph will open with an origin node corresponding to the selected object on the graph (Figure 1).
Opening Threat Graph From the Legacy Details Screen (Indicators, Groups, and Tags)
Follow these steps to open Threat Graph from the legacy Details screen for an Indicator, Group, or Tag:
- Navigate to the legacy Details screen for an Indicator, Group, or Tag.
- Click Explore In Graph in the screen’s header. Threat Graph will open with an origin node corresponding to the selected object on the graph (Figure 1).
Opening Threat Graph From the Search Screen (Indicators, Groups, and Tags)
Follow these steps to open Threat Graph from the Search screen for a search result that is an Indicator, Group, or Tag:
- Run a search of your ThreatConnect data on the Search screen.
- While viewing search results on the Search screen, click the ⋯ menu for a search result that is an Indicator, Group, or Tag.
- If you clicked the ⋯ menu for a search result that is an Indicator or Tag, select Explore in Graph; if you clicked the ⋯ menu for a search result that is a Group, select Visual Analysis followed by Explore in Graph. Threat Graph will open with an origin node corresponding to the selected object on the graph (Figure 1).
Viewing Cases in Threat Graph
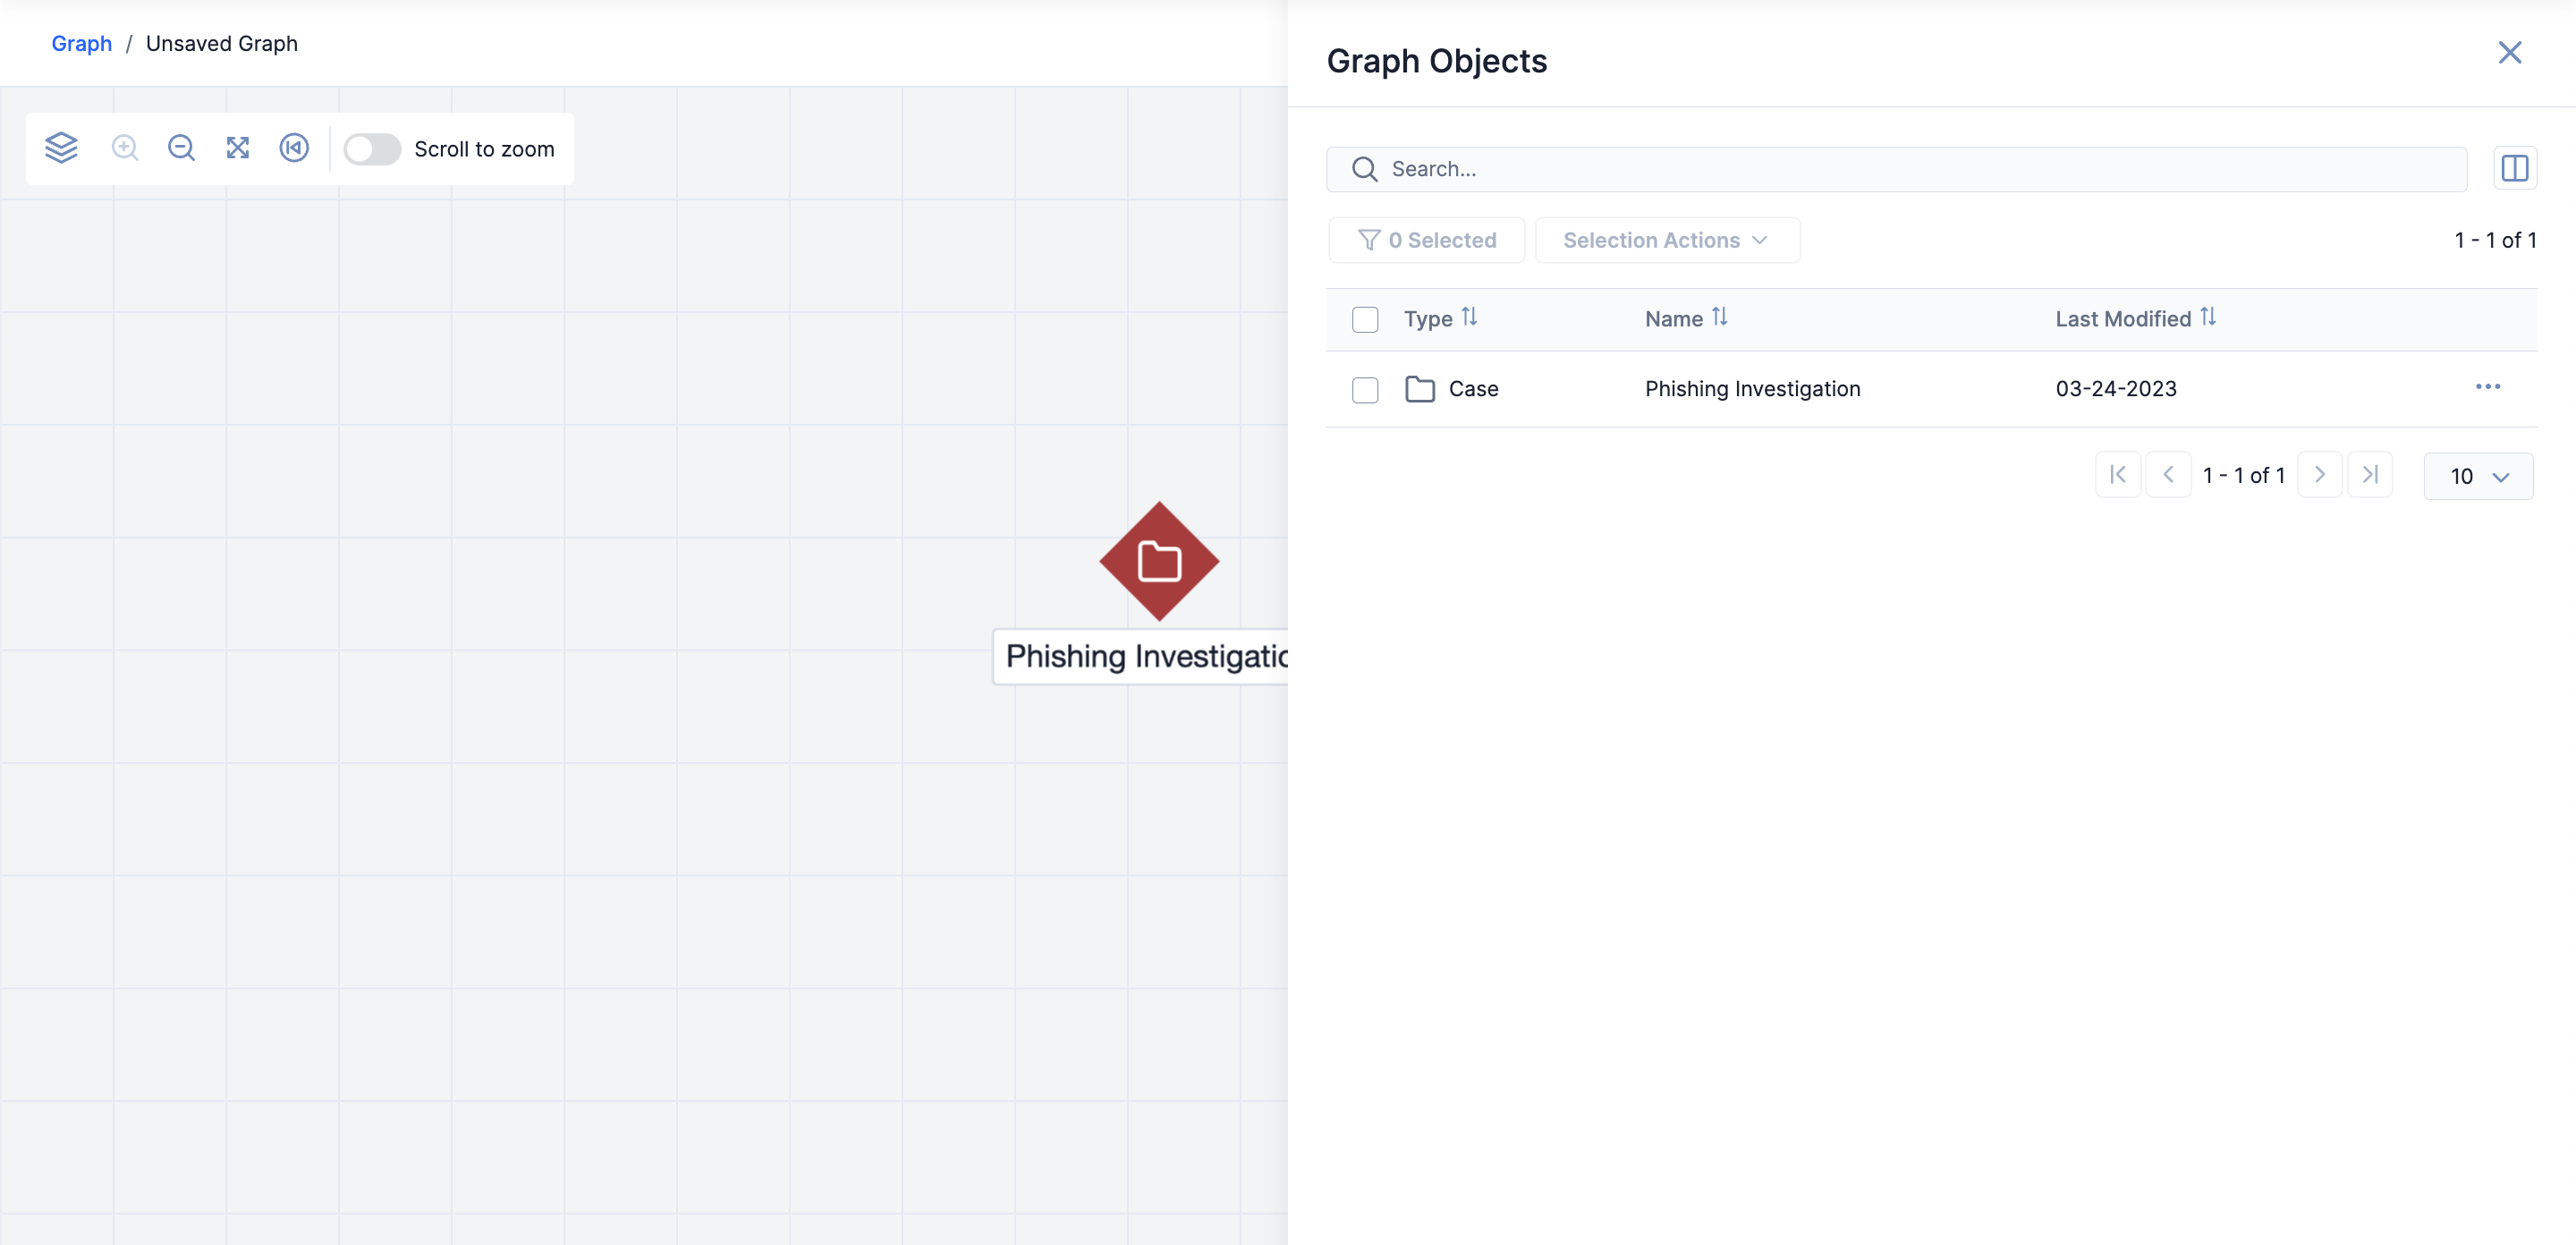
To view a Workflow Case in Threat Graph, open Threat Graph from the Case’s Details drawer, while viewing the Case, or from the Search screen when the Case is returned as a search result. After Threat Graph opens, it will have a diamond-shaped origin node corresponding to the selected Case on the graph.
Opening Threat Graph From the Details Drawer (Cases)
Follow these steps to open Threat Graph from the Details drawer for a Case:
- Open the Details drawer for a Case.
- Click Explore in Graph in the Details drawer’s header. Threat Graph will open with an origin node corresponding to the selected Case on the graph (Figure 2).NoteThe Explore In Graph button is available only when viewing a Case’s Details drawer on the Search screen.
Opening Threat Graph While Viewing a Case
Follow these steps to open Threat Graph while viewing a Case:
- Click Workflow on the top navigation bar. Alternatively, hover over Workflow on the top navigation bar and select Cases.
- Select a Case on the Cases screen to view the Case’s details.
- Click Explore In Graph at the top right of the Case. Threat Graph will open with an origin node corresponding to the selected Case on the graph (Figure 2).
Opening Threat Graph From the Search Screen (Cases)
Follow these steps to open Threat Graph from the Search screen for a search result that is a Case:
- Run a search of your ThreatConnect data on the Search screen.
- While viewing search results on the Search screen, click the ⋯ menu for a search result that is a Case.
- Select Explore in Graph in the ⋯ menu for the Case. Threat Graph will open with an origin node corresponding to the selected Case on the graph (Figure 2).
Threat Graph Node Menu Options
When you click on an Indicator, Group, Tag, or Case node in Threat Graph, a menu with some or all of the options listed in Table 1 will open. The options available in a node’s menu depend on the type of object the node corresponds to and, in some cases, whether the object exists in ThreatConnect.
| Name | Applicable Object Type(s) |
|---|---|
| Pivot in ThreatConnect |
|
| Pivot with CAL1 |
|
| Enrich | Indicators of a type for which a System Administrator turned on and configured a third-party enrichment service |
| Add Associations |
|
| Run Playbook… | Indicators of any type that exist in ThreatConnect |
| View Details |
|
| CAL Alias Information2 | Adversary, Intrusion Set, Malware, Threat, and Tool Groups |
| Combine Group Nodes by Alias2 | Adversary, Intrusion Set, Malware, Threat, and Tool Groups |
1. To use this feature, CAL™ must be turned on for your ThreatConnect instance, and data for the selected object must exist in CAL.
2. To use this feature, CAL must be turned on for your ThreatConnect instance, and known alias information for the Adversary, Intrusion Set, Malware, Threat, or Tool Group must exist in CAL.
ThreatConnect® is a registered trademark, and CAL™ is a trademark, of ThreatConnect, Inc.
20117-03 v.08.A