New Features and Functionality
Service Level Agreement (SLA) Tracking and Management for Cases
When a breach occurs, it is critical to mitigate the threat before the attacker gains a stronger foothold. Managed Security Service Providers (MSSPs) and individual organizations alike strive to contain threats within specific deadlines to minimize impact. Because of the large numbers of clients they service, it is particularly essential for MSSPs to deliver on agreed-upon timelines for threat resolution with their clients.
MSSP customers also require visibility into overdue tasks and investigations. This transparency motivates MSSPs to allocate resources effectively, prioritize high-risk incidents, and drive faster resolution—ultimately enhancing trust, accountability, and service delivery.
To address this need, ThreatConnect 7.9 includes several features that support tracking and management of SLAs for Workflow Cases and empower organizations to define, monitor, and manage incident timelines with precision.
SLA Benchmarks
SLA evaluation is based on two benchmarks for security incidents:
- Time to Detect (TTD): The amount of time it took to detect the incident after it occurred OR the amount of time it took to open a Case for the incident after it was detected. (See the “Configure Time to Detect for SLAs” section for more information.)
- Time to Respond (TTR): The amount of time it took to close the Case for the incident after it was opened.
In ThreatConnect 7.9, you can configure and track deadlines and metrics in near real-time for these benchmarks according to the severity level of the Case used to track and resolve an incident.
Configure Time to Detect for SLAs
To accommodate different operational preferences, ThreatConnect provides flexibility in how it calculates TTD for Cases. System Administrators can configure the TTD calculation setting by navigating to System Settings > Settings > System and selecting one of the following options in the timeToDetectionCalculation dropdown:
- Time of Detection minus Time of Occurrence: (Default) Measures TTD by calculating the amount of time it took to detect the incident after it occurred—in other words, the difference between the Time of Detection and Time of Occurrence values for Cases.
- Case Open Time minus Time of Detection: Measures TTD by calculating the amount of time it took to open a Case for the incident after it was detected—in other words, the difference between the Case Open Time and Time of Detection values for Cases.
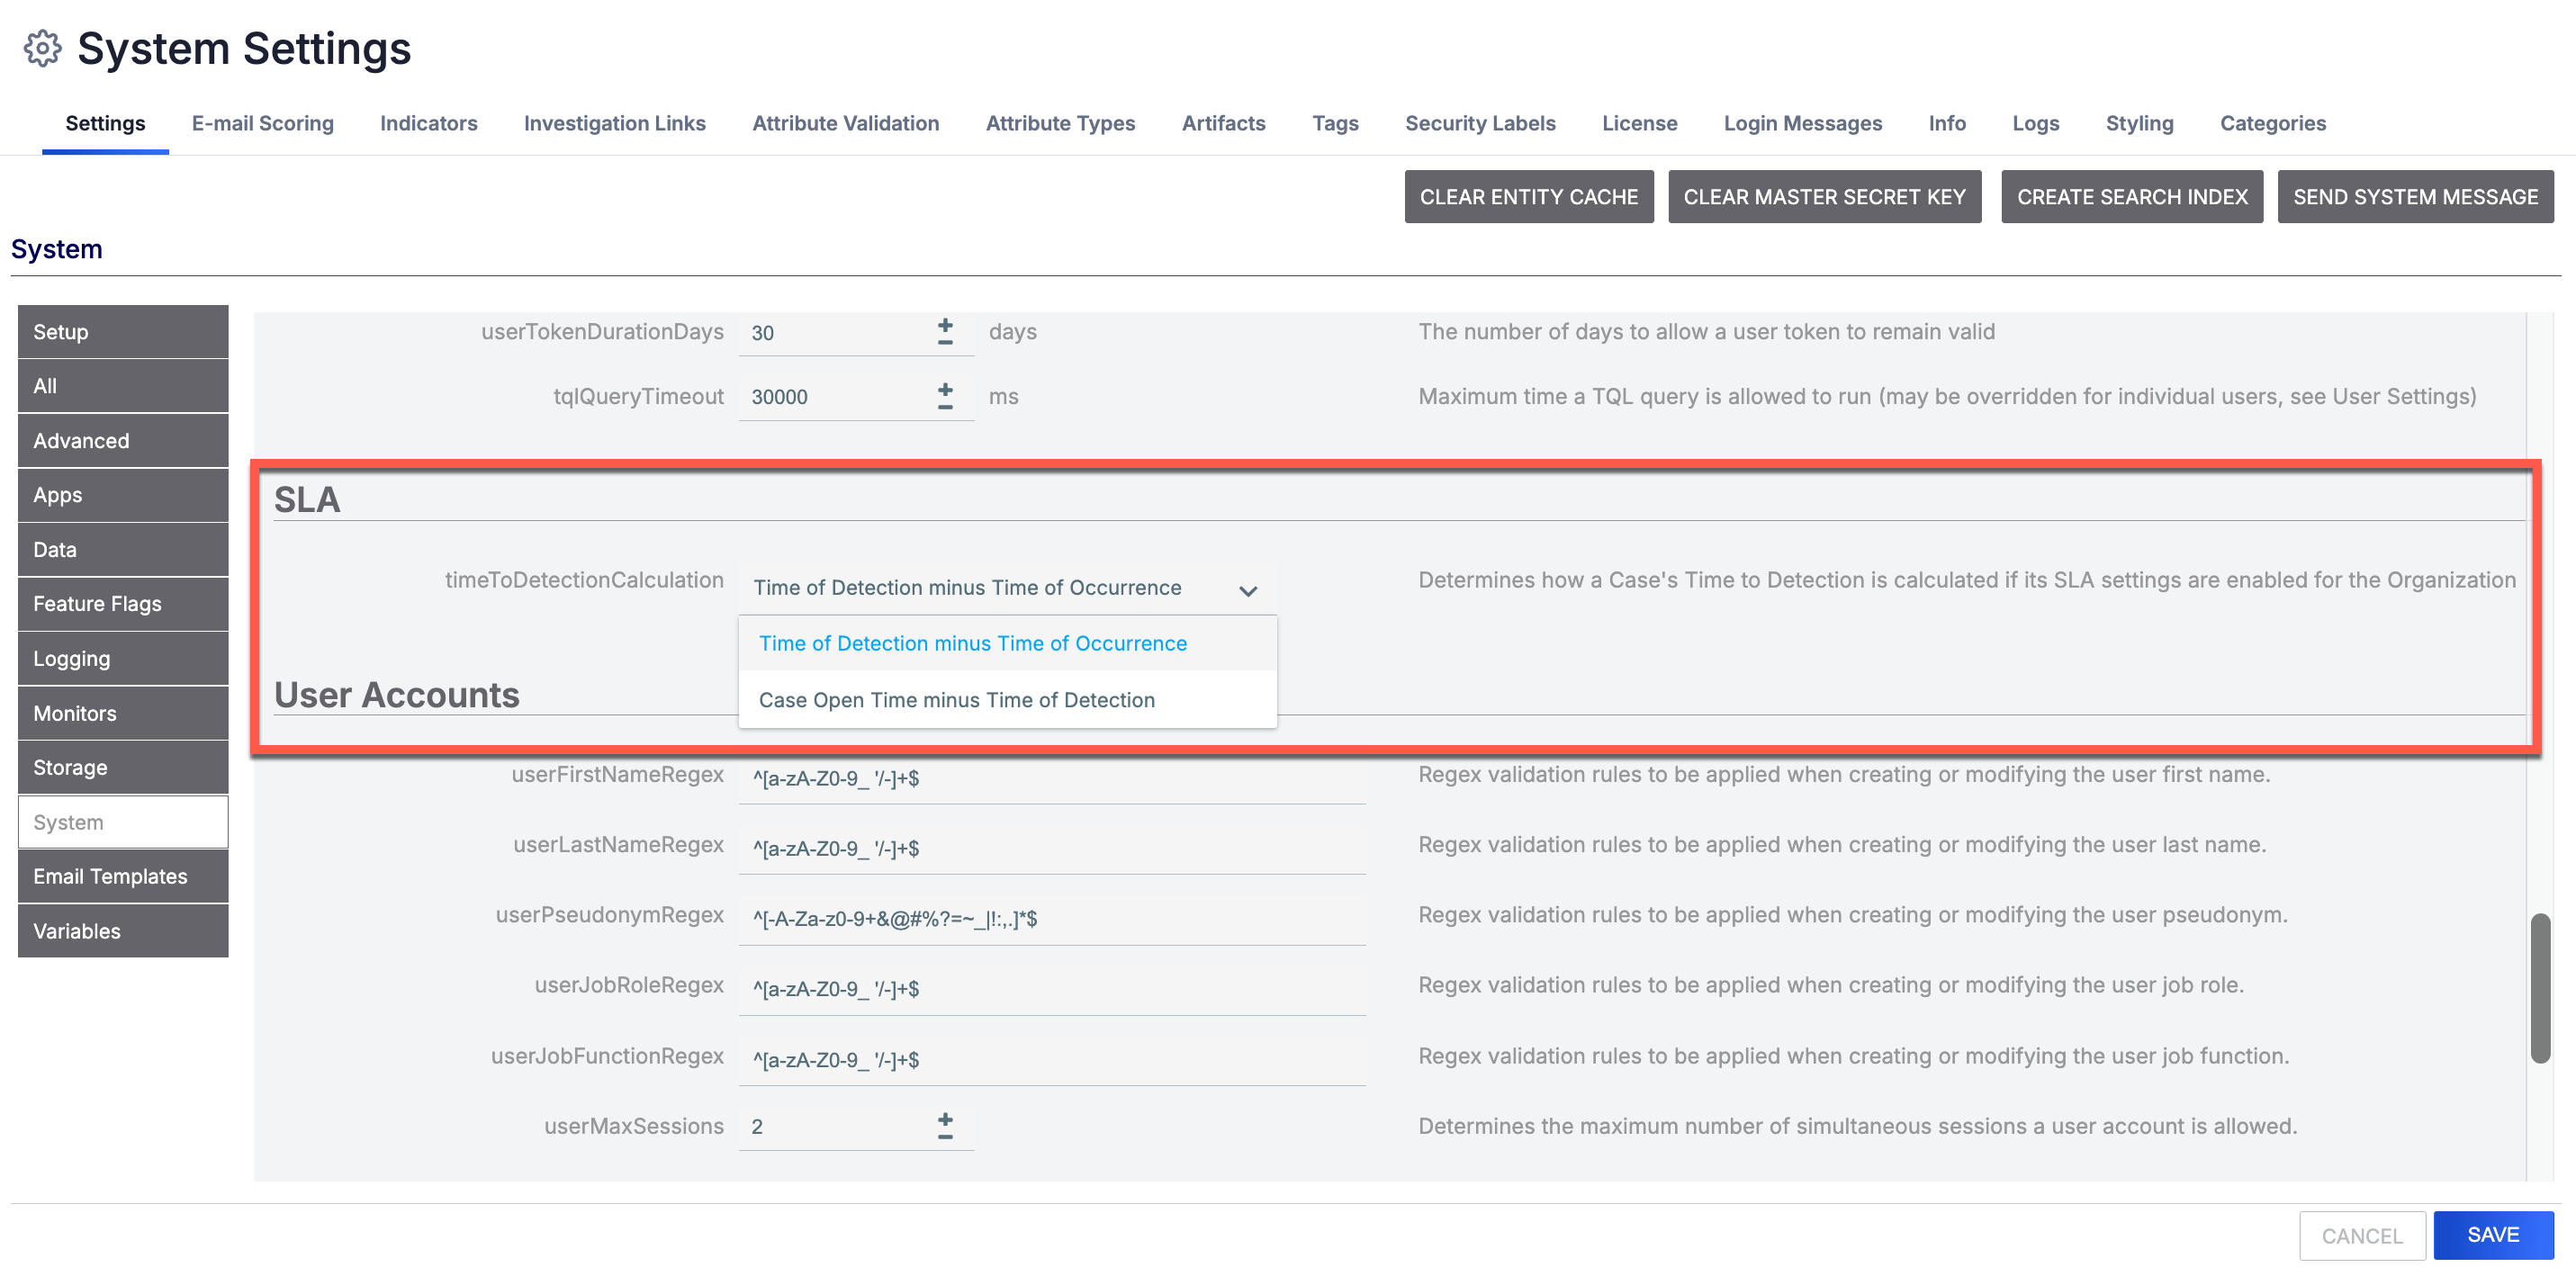
Choose how TTD is calculated for SLAs on your ThreatConnect instance
Configure SLA Due Dates by Case Severity
Organization Administrators can enable and configure how SLA detection and response due dates are set for each Case severity level (Low, Medium, High, and Critical). Enabling and configuring detection and response due dates for a severity level will allow you to track TTD and TTR, respectively, for Cases with that severity level.
To enable and configure SLA due dates for a Case severity level, navigate to Org Config > SLA, select the checkbox for the severity level in the Time to Detect SLA or Time to Respond SLA section, and configure the detection or response due date, respectively, for the severity level. After you configure due dates for all desired severity levels, click Save Changes.
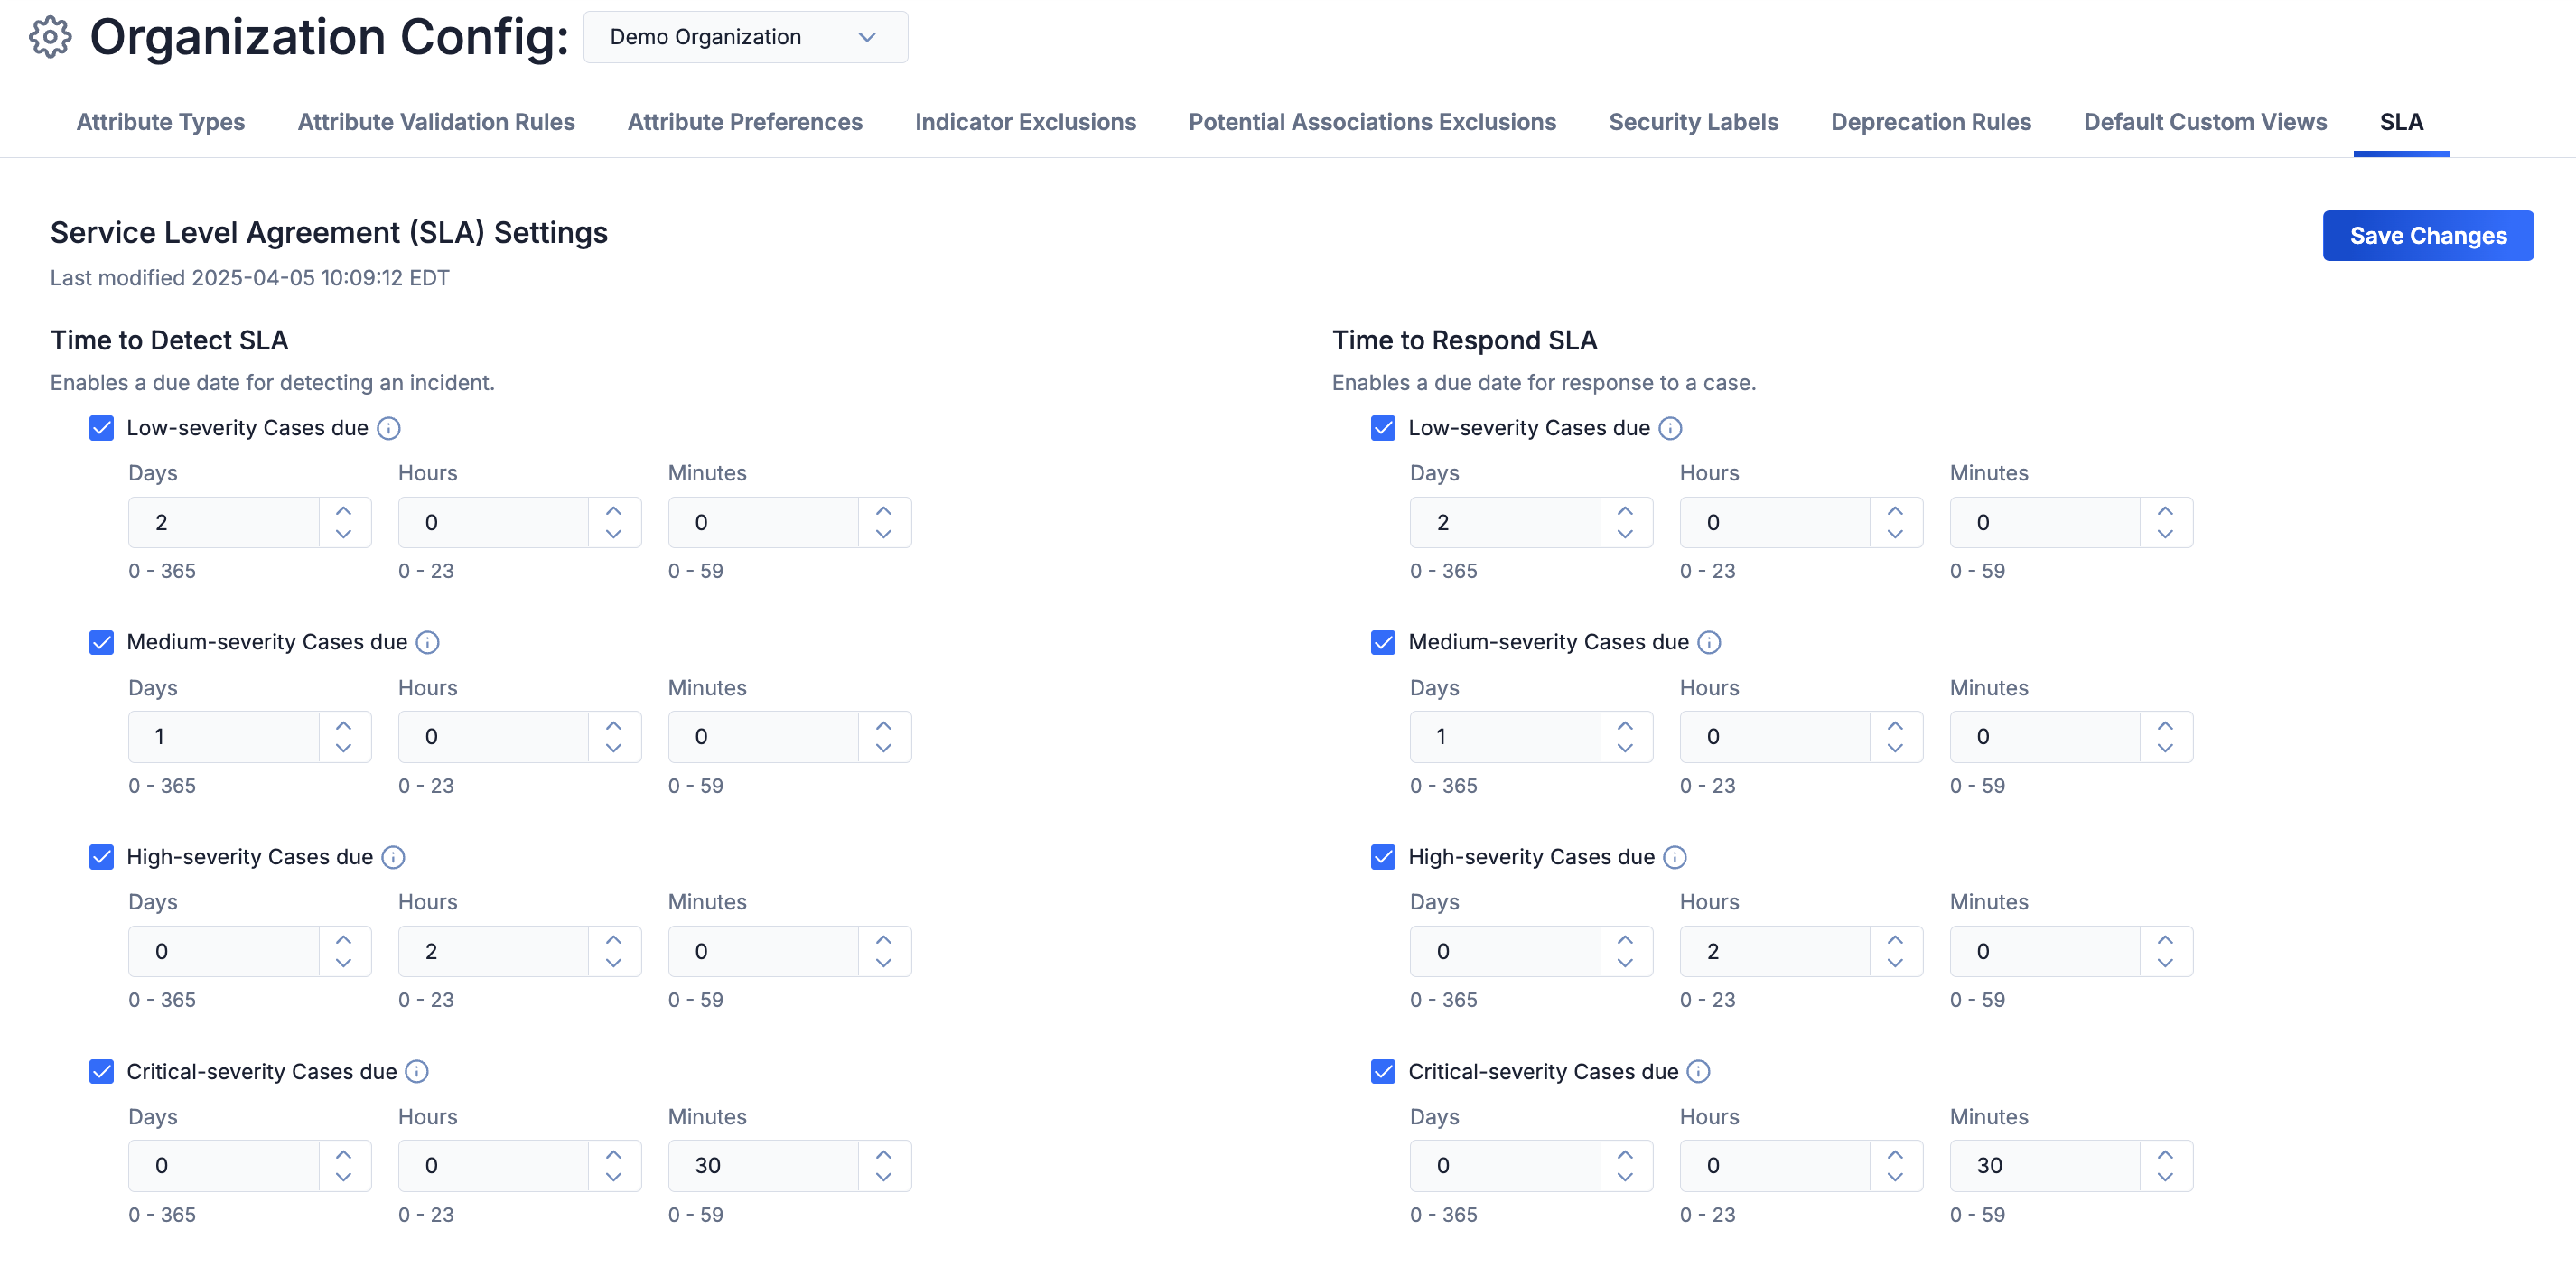
Enable and configure SLA detection and response due dates for Case severity levels
For example, under the configuration in the preceding figure, Cases with a low severity level are configured to allow a 2-day window for detection. If TTD, as defined according to the selected configuration for the timeToDetectionCalculation system setting, exceeds that amount of time, a Case will be considered overdue. Similarly, Cases with a low severity level are configured to allow a 2-day window for response. If TTR exceeds that amount of time (that is, if the Case is not closed within 2 days after it has been opened), it will be considered overdue.
View SLA Insights for Cases
In ThreatConnect 7.9, there are two areas where you can view SLA insights for Cases:
- The Case Details card for a Case
- The Cases screen
Case Details Card
While viewing a Case, the Case Details card now provides a detailed, near real-time view of key incident timestamps and SLA tracking insights. This information helps SOC and threat analysts quickly see how a Case is progressing relative to its SLA commitments and understand whether the Case is on track, approaching a deadline, or overdue.
The new Detection Due and Response Due fields on the Case Details card display the following SLA insights:
- Detection Due and Response Due:
- Due in indicates how much time is left before the SLA deadline.
- Overdue by indicates that the SLA has been breached and displays the amount of time that has passed since the deadline. This value is highlighted in red for increased visibility and awareness.
- Detection Due only:
- Detected in confirms that the threat was detected within the SLA detection deadline and shows the amount of time it took to detect the threat.
- Detection Response only:
- Responded in confirms that the threat was responded to within the SLA response deadline and shows the amount of time it took to respond to the threat.
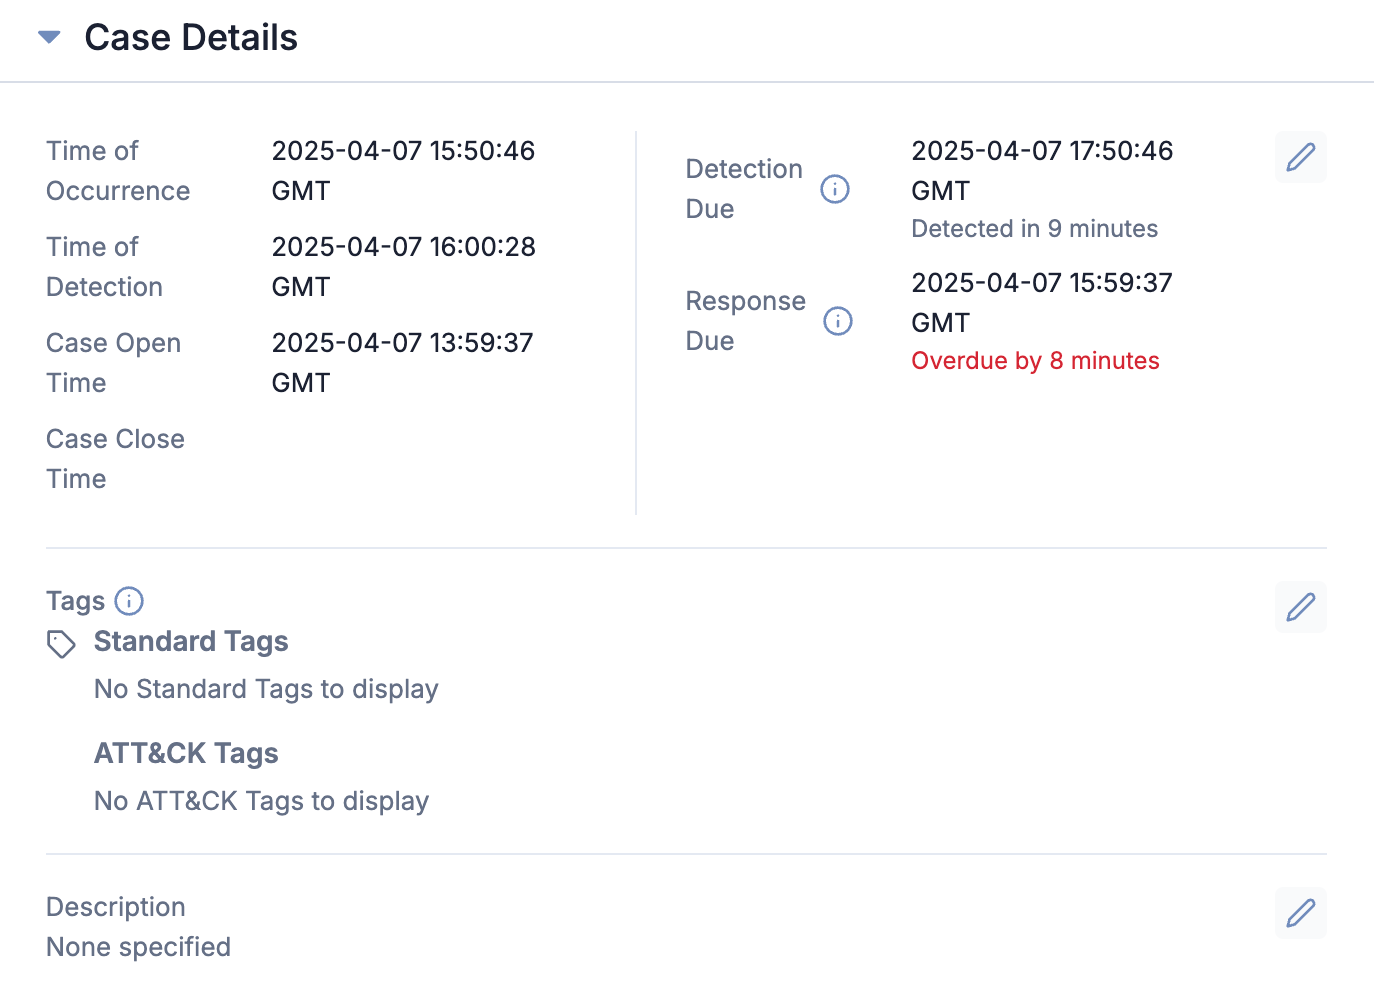
The Case Details card tracks SLA detection and response due dates and outcomes
Cases Screen
On the Cases screen, you can now view the Detection Due and Response Due values for Cases in grid view and list view and sort Cases by these values in list view. This feature enhances your ability to adhere to your organization’s SLA requirements by enabling you to easily identify Cases that are due soon or overdue.
To display the Detection Due and Response Due columns for Cases on the Cases screen when in list view, click Select columns , select the Detection Due and Response Due checkboxes, and click Apply.
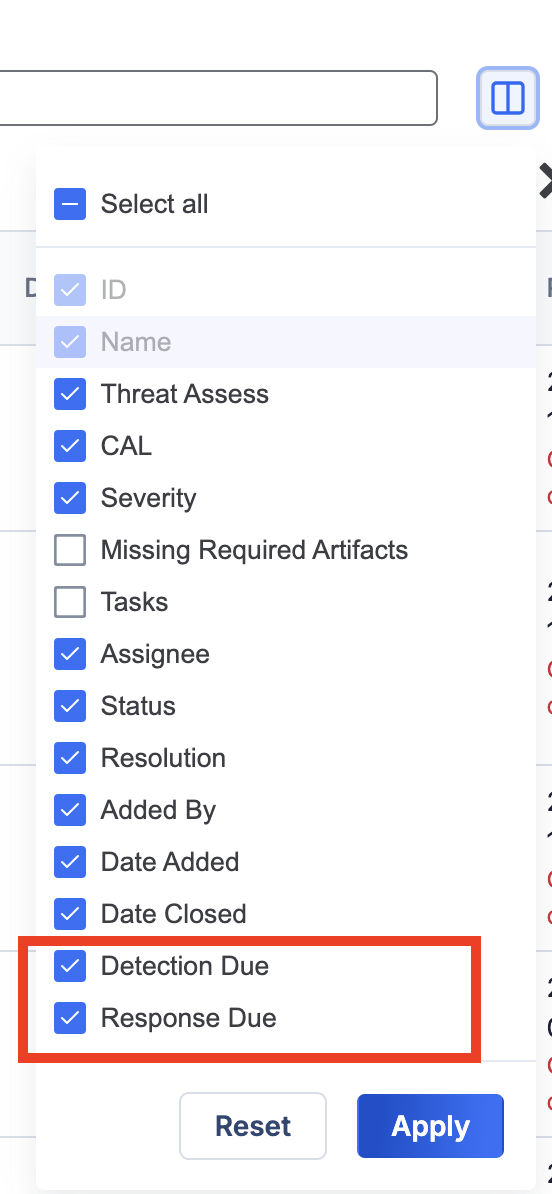
Use the column selector to display the Detection Due and Response Due columns for Cases
Visualize SLAs in Dashboards
SLA Metric Cards
ThreatConnect 7.9 includes two out-of-the-box Metric cards that are designed for visualizing SLA metrics in dashboards: SLA: Time to Detect and SLA: Time to Respond. These cards illustrate TTD and TTR SLA adherence and operational performance by categorizing Cases based on SLA status (SLA Active, SLA Met, and SLA Overdue) and grouping them by severity level (Low, Medium, High, and Critical).
You can add these cards to a dashboard by selecting SLA:Time to Detect and SLA: Time to Respond in the Metric section on the Add New Card drawer.
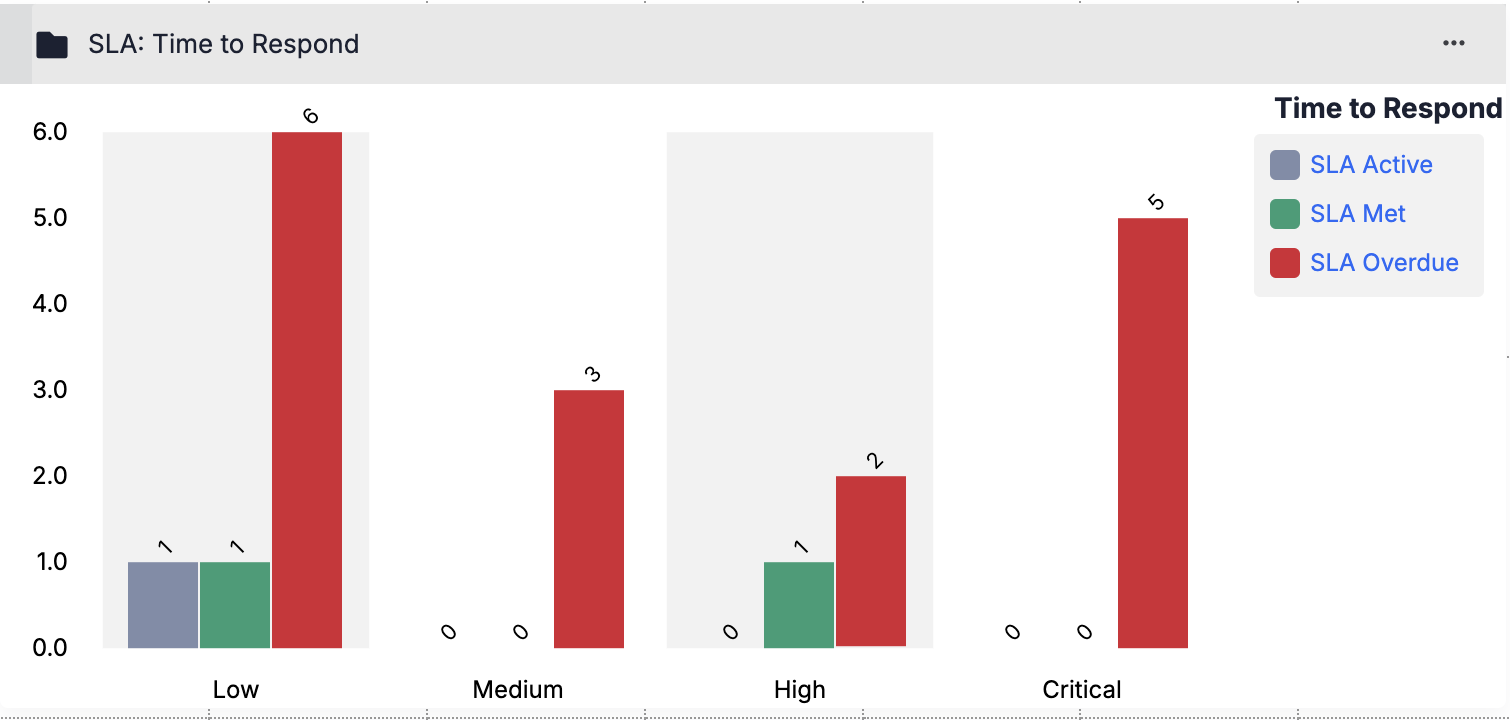
The SLA: Time to Respond dashboard card illustrates TTR SLA performance for Cases
MTTD and MTTR for SLAs in Query Cards
ThreatConnect 7.9 also includes support for building custom Query cards that track Mean Time to Detect (MTTD) and Mean Time to Respond (MTTR) for SLAs. Creating Query cards to track MTTD and MTTR performance for SLAs can help you identify areas where response times are lagging, evaluate the effectiveness of detection mechanisms, and make informed decisions to enhance overall efficiency for your organization. These cards are also useful for tracking trends over time, comparing performance across different organizations, and ensuring that SLA commitments are consistently met for top-priority incidents.
When adding Query cards to a dashboard, you can configure the card to measure MTTD or MTTR performance for SLAs by doing the following:
- Select Cases as the type of object to query by.
- Select Severity as the method to group Cases by.
- Select AVG as the Attribute aggregation method.
- Select Time to Detect (for MTTD) or Time to Respond (for MTTR) as the target.
- Select Days, Minutes, Hours, or Seconds as the time unit.
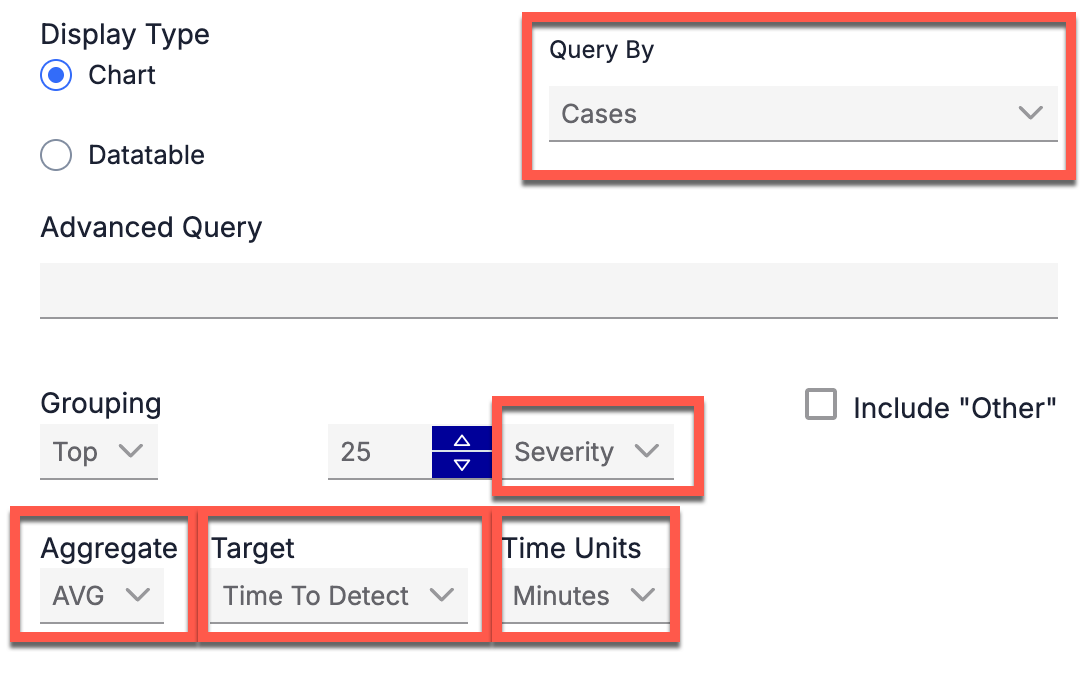
Configure Query cards in dashboards to analyze MTTD and MTTR performance for SLAs
Super Users can further enhance their MTTD and MTTR analysis by selecting specific Organizations for which they want to gain precise and actionable insights when configuring the Query card.
Browse and Search Your Data, All in One Location
Historically, ThreatConnect has provided several different places to search and query your data. This separation of capabilities across multiple areas of the platform was confusing, especially for first-time ThreatConnect users. Building upon the foundation of the Enhanced Search capabilities introduced in previous ThreatConnect releases, ThreatConnect 7.9 debuts an updated Search screen that combines the query functions of our widely used Browse feature with the search capabilities of Enhanced Search. This updated Search screen provides a single location where you can quickly find the data that matter most to you, whether you want to use keywords to search your entire ThreatConnect dataset or browse, filter, or run TQL queries to view a smaller dataset based on object type, metadata, or other details.
In ThreatConnect 7.9, you can access the updated Search screen by clicking the Search icon in the top navigation bar.
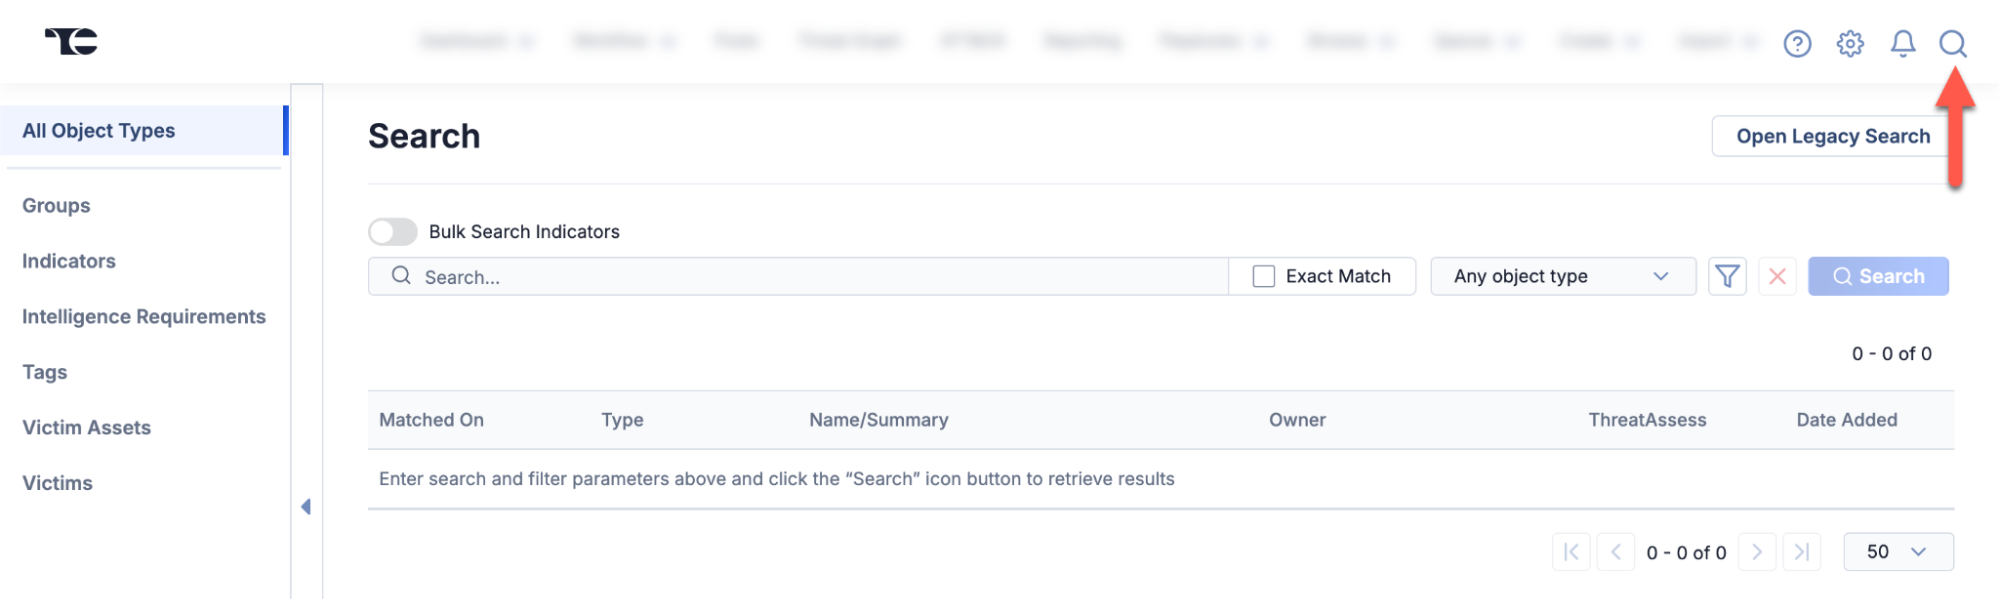
Access the Browse and Search features from the top navigation bar in ThreatConnect
When you open the Search screen, the All Object Types option is selected by default. Use this option when you want to search your entire dataset for objects that match a search query. To filter your dataset by object type and view all objects of the selected type (that is, to view your dataset similarly to its display on the Browse screen), select an object type in the sidebar. The Search screen will then display a table with objects of the selected type in all of your ThreatConnect owners.
After selecting an object type in the sidebar, you can use the options in the Filters menu or leverage ThreatConnect Query Language (TQL)—either via the Advanced Search feature or the TQL Generator—to further refine the dataset to a usable and relevant subset based on details like name/summary, owner, and object subtype (for Indicators and Groups). The updated Search screen also supports filtering data by relevant metadata such as Tags, Security Labels, and Attributes, making it easier than ever to find a set of Groups that share a common Attribute or a set of Indicators that have the same Tag applied to them.
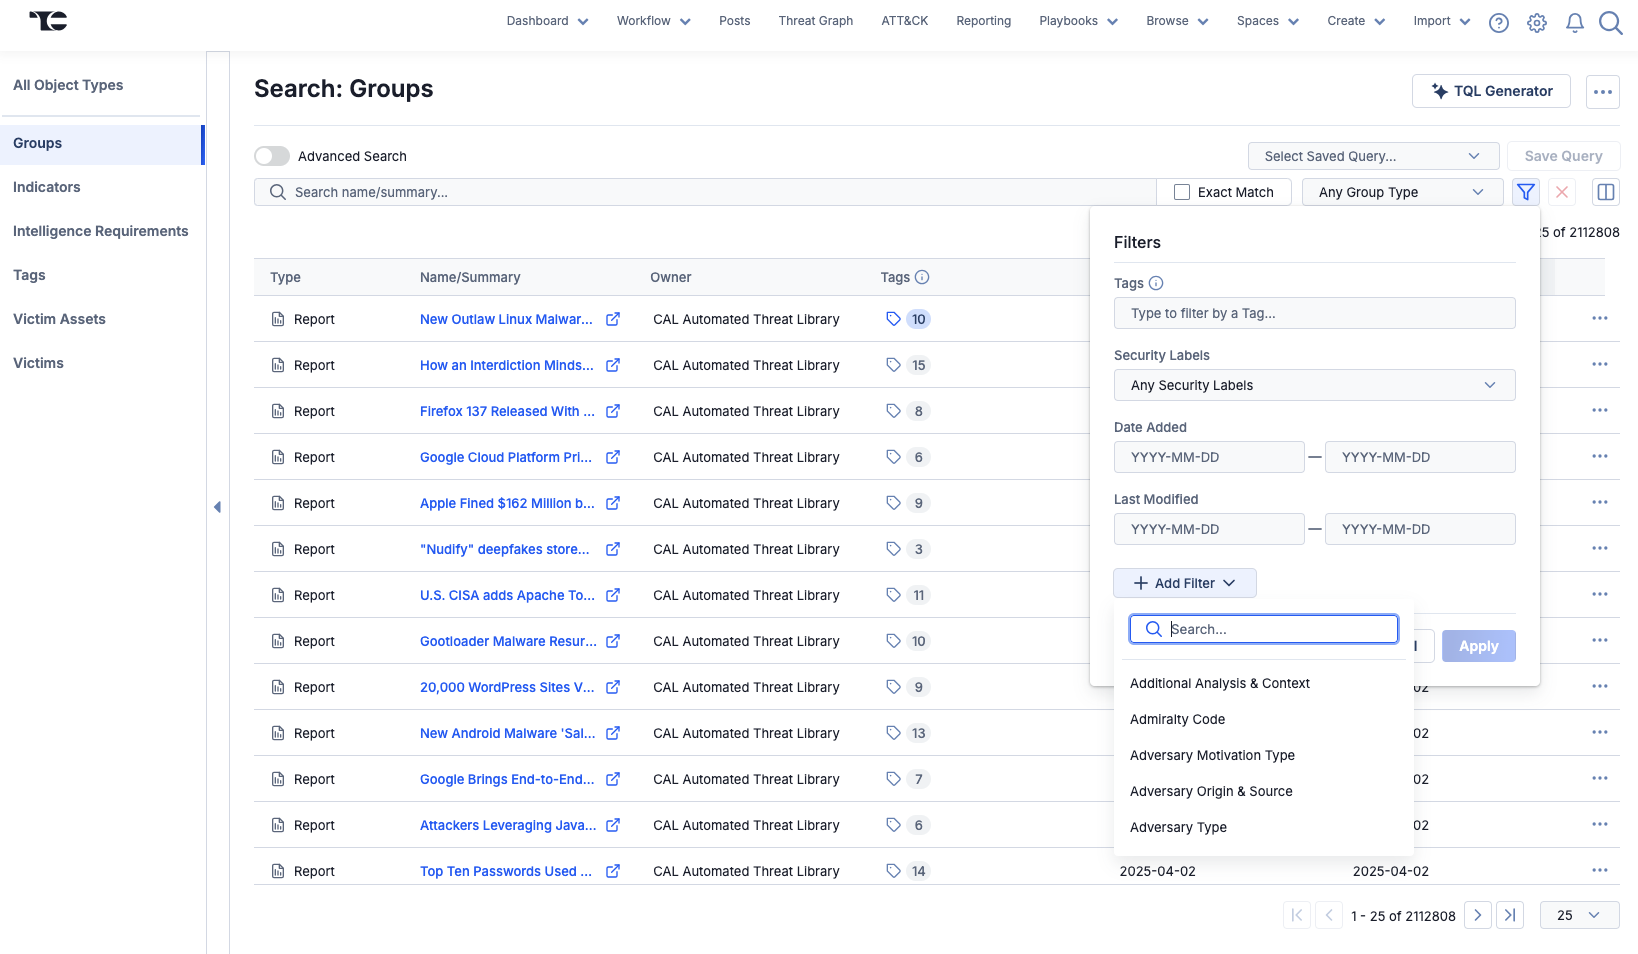
Filter your data in a variety of ways on the updated Search screen
While ThreatConnect 7.9 introduces this new way to browse and filter your data, it does not yet mark the end of the legacy Browse screen. Although we plan to sunset the legacy Browse screen in the future, you can still access it in ThreatConnect 7.9 via the Browse option on the top navigation bar. As you begin using the updated Search screen in your analysis and investigation workflows, we encourage you to share feedback about your experience with it via ProductBoard or your Customer Success Manager.
Indicator Status Updates
In ThreatConnect 7.9, we add the ability to enable two kinds of Indicator Status lock at the owner level. This new feature, which a System Administrator enables for their ThreatConnect instance, provides more control over Indicator Status changes and can ensure that Indicators in individual owners do not have their statuses changed by automation via CAL™ or synchronization.
In addition to the new status lock settings, this update includes more detailed activity log entries when an Indicator’s status changes. The Indicator activity log (that is, the Activity tab on an Indicator’s Details screen) will now include the method used to change the status and, when possible, the username for the account that made the change.
Enable Status Locks on a ThreatConnect Instance
System Administrators can enable owner-level Indicator Status locks on their ThreatConnect instance by selecting the ownerIndicatorStatusLocksEnabled checkbox in System Settings > Settings > Feature Flags.
Owner-Level Status Lock Options
The ability to configure Indicator Status lock at the owner level is provided by two new options in Account Settings for Organizations (Account Settings > Organizations > edit an Organization > Organization Information > Permissions) and for Communities and Sources (Account Settings > Communities/Sources > edit a Community or Source > Community/Source Information). One option enables or disables CAL Status Lock for Indicators in an owner, and the other enables or disables synchronization status lock for Indicators in the owner. When enabling a status lock, there is a dropdown to specify the Indicator types the status lock will apply to, allowing for even more granular control over an owner’s data. When CAL Status Lock is enabled for the owner, CAL will not change the status for any Indicator of the specified Indicator types in that owner. Similarly, when the synchronization status lock is enabled for an owner, synchronization will not change the status for any Indicator of the specified Indicator types in that owner.
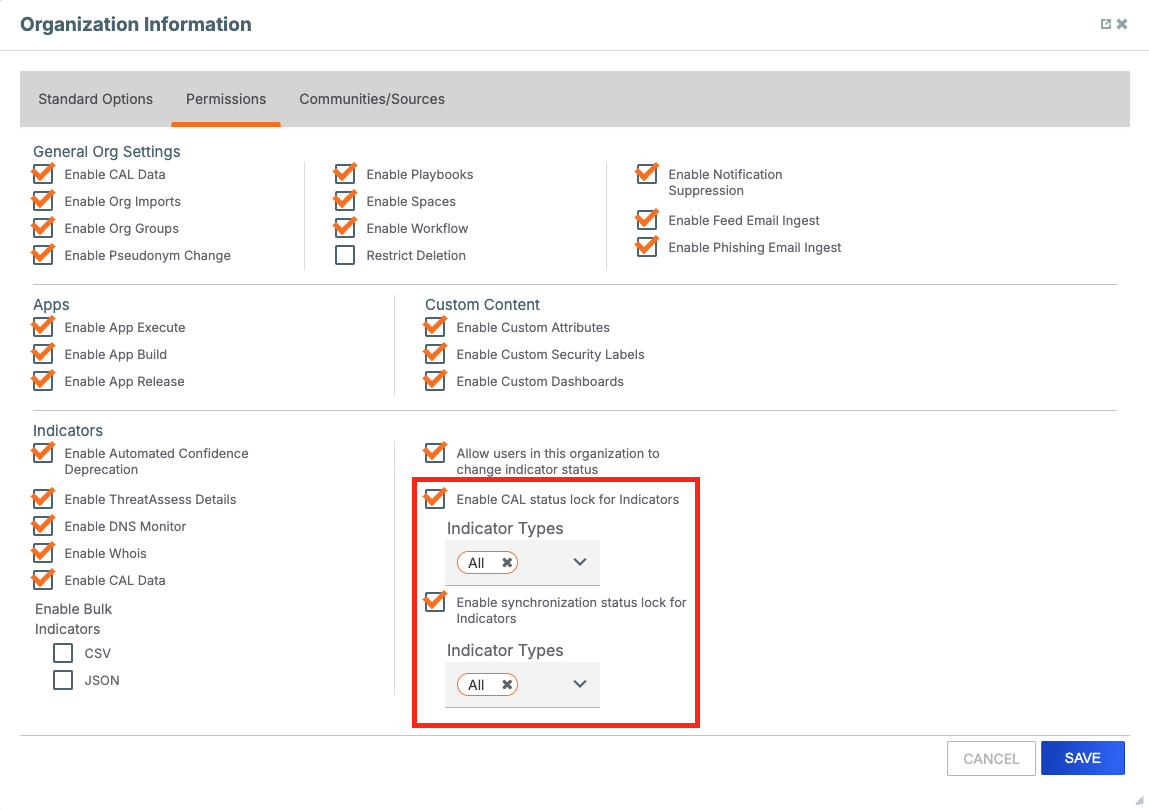
Enable status locks for selected Indicator types in an Organization
Activity Log Details
You will now see more detailed entries in Indicator activity logs (that is, the Activity tab on an Indicator’s Details screen) when an Indicator’s status changes. Table 1 displays example activity log messages for the new details added in this update.
| Activity | Example Activity Log Message |
|---|---|
| Indicator Status is set by CAL | Indicator bad.com status changed to active by CAL |
| Indicator Status is changed manually by a user | Indicator bad.com status changed to inactive manually by Alice Li |
| Indicator Status is changed via synchronization after a user manually changes the status of a copy of the Indicator in a different owner on the ThreatConnect instance | Indicator bad.com status synchronized to inactive due to manual change in another owner |
| Indicator Status is changed during import by a user in the ThreatConnect UI* | Indicator bad.com status changed to active during import by Alice Li |
| Indicator Status is changed via synchronization after a user changes the status of a copy of the Indicator in a different owner during import in the ThreatConnect UI | Indicator bad.com status synchronized to active due to import in another owner |
| Indicator Status is changed using the ThreatConnect v2 API | Indicator bad.com status changed to inactive via v2 API |
| Indicator Status is changed via synchronization after the status of a copy of the Indicator in a different owner is changed using the ThreatConnect v2 API | Indicator bad.com status synchronized to inactive due to v2 API change in another owner |
| Indicator Status is changed using the ThreatConnect v3 API | Indicator bad.com status changed to active via v3 API |
| Indicator Status is changed via synchronization after the status of a copy of the Indicator in a different owner is changed using the ThreatConnect v3 API | Indicator bad.com status synchronized to active due to v3 API change in another owner |
| Indicator Status is changed to inactive via confidence deprecation | Indicator bad.com status changed to inactive due to deprecation |
| Indicator Status is changed via synchronization to inactive after confidence deprecation of a copy of the Indicator in a different owner | Indicator bad.com status synchronized to inactive due to deprecation |
| Indicator Status is changed using the ThreatConnect v2 batch API | Indicator bad.com status changed to active due to v2 batch import |
| Indicator Status is changed via synchronization after the status of a copy of the Indicator in a different owner is changed using the ThreatConnect v2 batch API | Indicator bad.com status synchronized to active due to v2 batch import in another owner |
* Example: Utilizing one of the ThreatConnect UI tools (e.g., structured Indicator import, unstructured Indicator import, Doc Analysis import, adding associated Indicators, etc.), a user imports an Indicator into an owner in which the Indicator already exists. As part of the import configuration, the user changes the Indicator’s status in that owner.
Improvements
Threat Intelligence
- The new Details screen is now available for Signature Group objects.
- The My Intel Sources selector now persists your selections across ThreatConnect sessions.
Dashboards
- A View Details option has been added to the ⋯ menu (formerly the ACTIONS menu) on dashboard cards. This option allows you to view information about the card’s configuration and owner selections without editing the card.
- Added (Date Added) and Modified (Last Modified) columns are now available for datatables in dashboard Query cards querying for Intelligence Requirement Results.
Search
- You can now open a new browser tab containing the Search screen by using any of the following methods while hovering over the Search icon on the top navigation bar:
- Command + click
- Control + click > Open Link in New Tab
- Right-click > Open Link in New Tab
Workflow
- The header for Workflow Cases was redesigned to provide a clearer and more consistent user experience.
API & Under the Hood
- A modern systemd service script that allows you to set environment variables available to ThreatConnect and Apps running in ThreatConnect was added to Linux® deployments.
- A diagnostic utility has been added for On Premises instances running Linux-based ThreatConnect deployments. Among other things, this utility can help you determine whether file permissions are set properly, ensure that the threatconnect user can write to the /tmp directory, and test the OpenSearch® connectivity.
- A configuration change for OpenSearch has been introduced for operating system deployments of ThreatConnect 7.9. Under this new configuration, the maximum number of clauses in a query is increased, allowing ThreatConnect to leverage OpenSearch functionality more efficiently and enhance the platform’s search capabilities. Ultimately, this enhancement will provide a better user experience when interacting with Intelligence Requirements and the Enhanced Search feature.
Bug Fixes
Threat Intelligence
- Performance issues on Tag lookups were resolved.
- An issue causing Organization-level Attributes to override System-level Attributes with the same name was fixed.
Playbooks
- An issue causing Playbooks with a Case Trigger to execute twice for Cases with a Resolution value of New has been fixed.
App Builder
- Details have been added to error messages in the App Builder.
Workflow
- An issue causing duplicate pasting of content in Workflow Case Notes has been fixed.
API & Under the Hood
- The following fields are now included in the response for an OPTIONS request to the
/v3/security/exclusionListsendpoint in the v3 API:name,active, andmanaged. - When importing Indicators via the V2 Batch API, the “last modified” date for Indicators that already exist in the target owner was being overwritten with the “last modified” date of the imported Indicator. This issue has been fixed.
Dependencies & Library Changes
- The ThreatConnect Environment Server now supports Red Hat® Enterprise Linux® (RHEL) 9.
Maintenance Releases Changelog
2025-11-13 7.9.2-M1113R [Latest]
Bug Fixes
- The following issues for dashboard cards for custom user metrics with keyed data series were resolved:
- Card configuration is missing options for selecting series data.
- Card displays data from only a subset of the owners selected in the card’s configuration.
2025-05-29 7.9.2
Improvements
- The following changes were implemented to help you track ThreatAssess updates for Indicators:
- A new system setting, taUpdateIndicatorLastModified, was added. This setting allows System Administrators to determine how updated ThreatAssess calculations affect an Indicator’s “last modified” date:
- Disabled: Select this value to prevent updates to ThreatAssess calculations from updating an Indicator’s “last modified” date. This selection preserves the pre-7.9.2 relationship between ThreatAssess and an Indicator’s “last modified” date.
- Quiet (default): Select this value to have updates to ThreatAssess calculations cause an Indicator’s “last modified” date to be updated quietly (i.e., without notifications).
- Full: Select this value to have updates to ThreatAssess calculations cause an Indicator’s “last modified” date to be updated and to add an entry for the update to the Indicator’s activity log.
- A new TQL parameter for Indicators, threatAssessLastUpdated, was added. This parameter stores the date and time at which an Indicator’s ThreatAssess score was most recently updated (or, for newly scored Indicators, the date and time at which the Indicator’s ThreatAssess score was first calculated).
- A new system setting, taUpdateIndicatorLastModified, was added. This setting allows System Administrators to determine how updated ThreatAssess calculations affect an Indicator’s “last modified” date:
- Starting with version 7.9.2, when your ThreatConnect instance is upgraded, TC Exchange™ will turn on the Deprecated status for all newly deprecated Apps:
- Deprecated Apps that have previously been installed on your ThreatConnect instance will have “• [Deprecated]” added to the beginning of their name for quick and easy identification. They will also be sorted at the end of the App table on the TC Exchange Settings screen by default.
- Deprecated Apps that have not been previously installed on your ThreatConnect instance will not be listed on the TC Exchange Settings screen and will not be available for installation and use.
- Deprecated Apps that have previously been installed on your ThreatConnect instance will be available only for currently configured use. For example, a deprecated Playbook App that was added to a Playbook prior to the App’s deprecation can still be used in that Playbook, but cannot be added to a Playbook.
- If you uninstall a deprecated App, you cannot reinstall it.
- You can “un-deprecate” an installed deprecated App by turning the Deprecated toggle off in the Options ⋮ menu for the App on the TC Exchange Settings screen. Un-deprecated Apps will be available for use, although their functionality may be limited, because ThreatConnect does not support deprecated Apps.
- Note that un-deprecating an App will not remove the “• [Deprecated]” prefix at the beginning of the App’s name.
- Subsequent ThreatConnect version upgrades will not re-deprecate an App that you have un-deprecated.
- The following Apps have been deprecated in ThreatConnect version 7.9.2:
- Playbook Apps
- Bitsquatting
- Cybereason
- FireEye Detection On Demand
- Hybrid Analysis
- Kenna.VM
- Lastline Defender
- LogRhythm SIEM
- MalwareBazaar
- McAfee ATD
- Micro Focus ArcSight ESM – CEFNoteThe Micro Focus ArcSight ESM – API Playbook App is not deprecated.
- Microsoft Exchange Web Services (EWS)
- Palo Alto Wildfire
- ReversingLabs
- Sumo Logic
- Symantec Endpoint Protection
- Update ThreatConnect Confidence Rating
- Update ThreatConnect DNS
- Update ThreatConnect WhoiS
- Zoom
- Job Apps
- ArcSight IntegrationNoteThe ArcSight Integration Job App is also known as Micro Focus ArcSight Integration Package.
- Dragos WorldView
- Flashpoint Risk Intelligence Observables
- Micro Focus ArcSight ESM – APINoteThe Micro Focus ArcSight ESM – CEF Job App is not deprecated.
- R-CISC IntelNoteThe R-CISC Intel Job App is also known as RH-ISAC Feed App or RH-ISAC Integration.
- Technical Blogs and Reports
- ThreatConnect Auto Enrich
- ArcSight Integration
- Custom Trigger Service Apps
- BlackBerry Optics
- BlackBerry Protect
- Playbook Apps
- You can now use Markdown when creating or editing an Intelligence Requirement's Description.
- Performance improvements were made on the Enrichment tab of an Indicator's Details screen.
Bug Fixes
- The Artifact Associations, Case Associations, and Potential Associations cards were not being displayed on the Associations tab of the Details screen for Indicators and Groups in Communities and Sources on instances that had cross-owner associations enabled. This issue has been corrected.
- An issue causing notifications for Intelligence Requirements (IRs) to be displayed under the Group Type filter rather than the Intel Requirement Type filter in the Notifications Center was fixed. Note that only new IR notifications will be displayed when filtering for the Intel Requirement Type. IR notifications created before upgrade to version 7.9.2 will still be displayed under the Group Type filter only.
- An issue preventing Super Users from running Playbooks under their user accounts to create and edit Artifacts in Workflow Cases belonging to owners other than the Super User’s home Organization was resolved.
- An issue causing an error to occur when attempting to edit a Custom Trigger Service App has been resolved.
- The import rule for Host Indicators (System Settings > Indicators > Import Rules) was updated to add a question mark (?) at the end of the rule's regex string. This update solves a problem that was preventing all but the last Host in a string of multiple Indicator types from being identified during the import.
- An issue causing incorrect content to be downloaded from Artifact files in a Workflow Task when downloading from the Phases and Tasks section of a Case was fixed.
- When viewing the Details drawer for an Indicator that does not currently exist in one of your owners via the Learn more about it link on the legacy Search drawer, Added and Last Modified dates were being displayed for the Indicator. These dates have been removed, as they should not be present for Indicators that are not in a ThreatConnect owner.
- An issue preventing the use of Source-level Attributes has been fixed.
- An issue causing latency when making GET requests for Indicators with IP geolocation data to the v3 API was resolved.
- Performance improvements were made in the Playbook Designer.
2025-04-30 7.9.1
Improvements
- You can now use the ThreatConnect v3 API to enrich Address and Host Indicators with data from Farsight Security®.
- The Reliability Rating for OSINT feeds has been removed from ThreatConnect.
- When creating or importing a Playbook, Super Users are now prompted to select a "Run As" user in the Organization that will own the Playbook.
Bug Fixes
- The Render as Tip checkbox has been removed from the Response Body configuration for Playbook UserAction Triggers. All response bodies will now be rendered as a tooltip. This update fixes an issue that was preventing response bodies not configured to render as a tooltip from being displayed in the Playbooks card on the new Details screen.
- An issue causing creation of duplicate Groups when recopying a Group to an existing Group that has been deleted was fixed. In addition, when recopying to an existing Group on the Sharing tab of the legacy Details screen, a tooltip will now notify you if the existing Group has been deleted and direct you to select a different existing Group or copy to a new Group instead.
- An issue causing timeouts to occur when copying Groups with large numbers of associated Indicators on the Copy tab of the Details screen was fixed.
- An issue causing incomplete and outdated execution detail logging for Playbook Components has been resolved.
- An issue causing an error to occur when deleting certain DataStores was fixed.
- An issue causing feeds that were redeployed to a new Source to be assigned to their previous Source was fixed.
2025-04-14 7.9.0-M0414R
Bug Fixes
- An issue preventing the Observations and False Positives range selectors in the Filters menu for Indicators on the Search screen from being immediately available when the respective feature's checkbox is selected was fixed.
- An issue causing latency when searching for data on the Indicators and Groups filters on the Search screen was fixed.
ThreatConnect® is a registered trademark, and CAL™ and TC Exchange™ are trademarks, of ThreatConnect, Inc.
OpenSearch® is a registered trademark of Amazon Web Services.
Farsight Security® is a registered trademark of DomainTools LLC.
Linux® is a registered trademark of Linux Torvalds.
Red Hat® Enterprise Linux® is a registered trademark of Red Hat, Inc.