Overview
The Threat Graph feature in ThreatConnect® provides a graph-based interface that you can use to discover, visualize, and contextualize associations and relationships between Indicators, Groups, Cases, and Tags. The View Details option in Threat Graph lets you view details for a node corresponding to an Indicator, Group, Tag, or Case that exists in ThreatConnect. You can also view details about Indicators, Groups, Tags, and Cases in the graph via the Graph Objects drawer.
Before You Start
User Roles
- To view details about Indicators, Groups, and Tags in an Organization in Threat Graph, your user account can have any Organization role.
- To view details about Indicators, Groups, and Tags in a Community or Source in Threat Graph, your user account can have any Community role except Banned for that Community or Source.
- To view details about Cases in an Organization in Threat Graph, your user account can have any Organization role except App Developer.
Prerequisites
- To view details about Cases in Threat Graph, turn on Workflow for your Organization on the Account Settings screen (must be an Accounts Administrator, Operations Administrator, or System Administrator to perform this action).
Viewing the Details Drawer For a Node
Follow these steps to open the Details drawer for an Indicator, Group, Tag, or Case in Threat Graph:
- Open Threat Graph.
- Select a node on the graph that corresponds to an Indicator, Group, Tag, or Case that exists in ThreatConnect.
- Select View Details in the node’s menu to open the Details drawer for the corresponding Indicator, Group, Tag, or Case. If the selected object exists in multiple owners, you will be prompted select the owner in which to view the object’s Details drawer in the View Details submenu.
If you are viewing the Details drawer for an object that exists in multiple owners, the drawer’s header will include a dropdown that you can use to switch between the object’s Details drawer in each of its owners.
Viewing Details in the Graph Objects Drawer
Follow these steps to open the Graph Objects drawer and view details for an Indicator, Group, Tag, or Case in Threat Graph:
- Open Threat Graph.
- Click View Table in the Threat Graph header to open the Graph Objects drawer (Figure 1). The Graph Objects drawer displays all objects on the graph in a paginated table.NoteTo control which table columns are included in the table on the Graph Objects drawer, click Select columns
 to the right of the search bar.
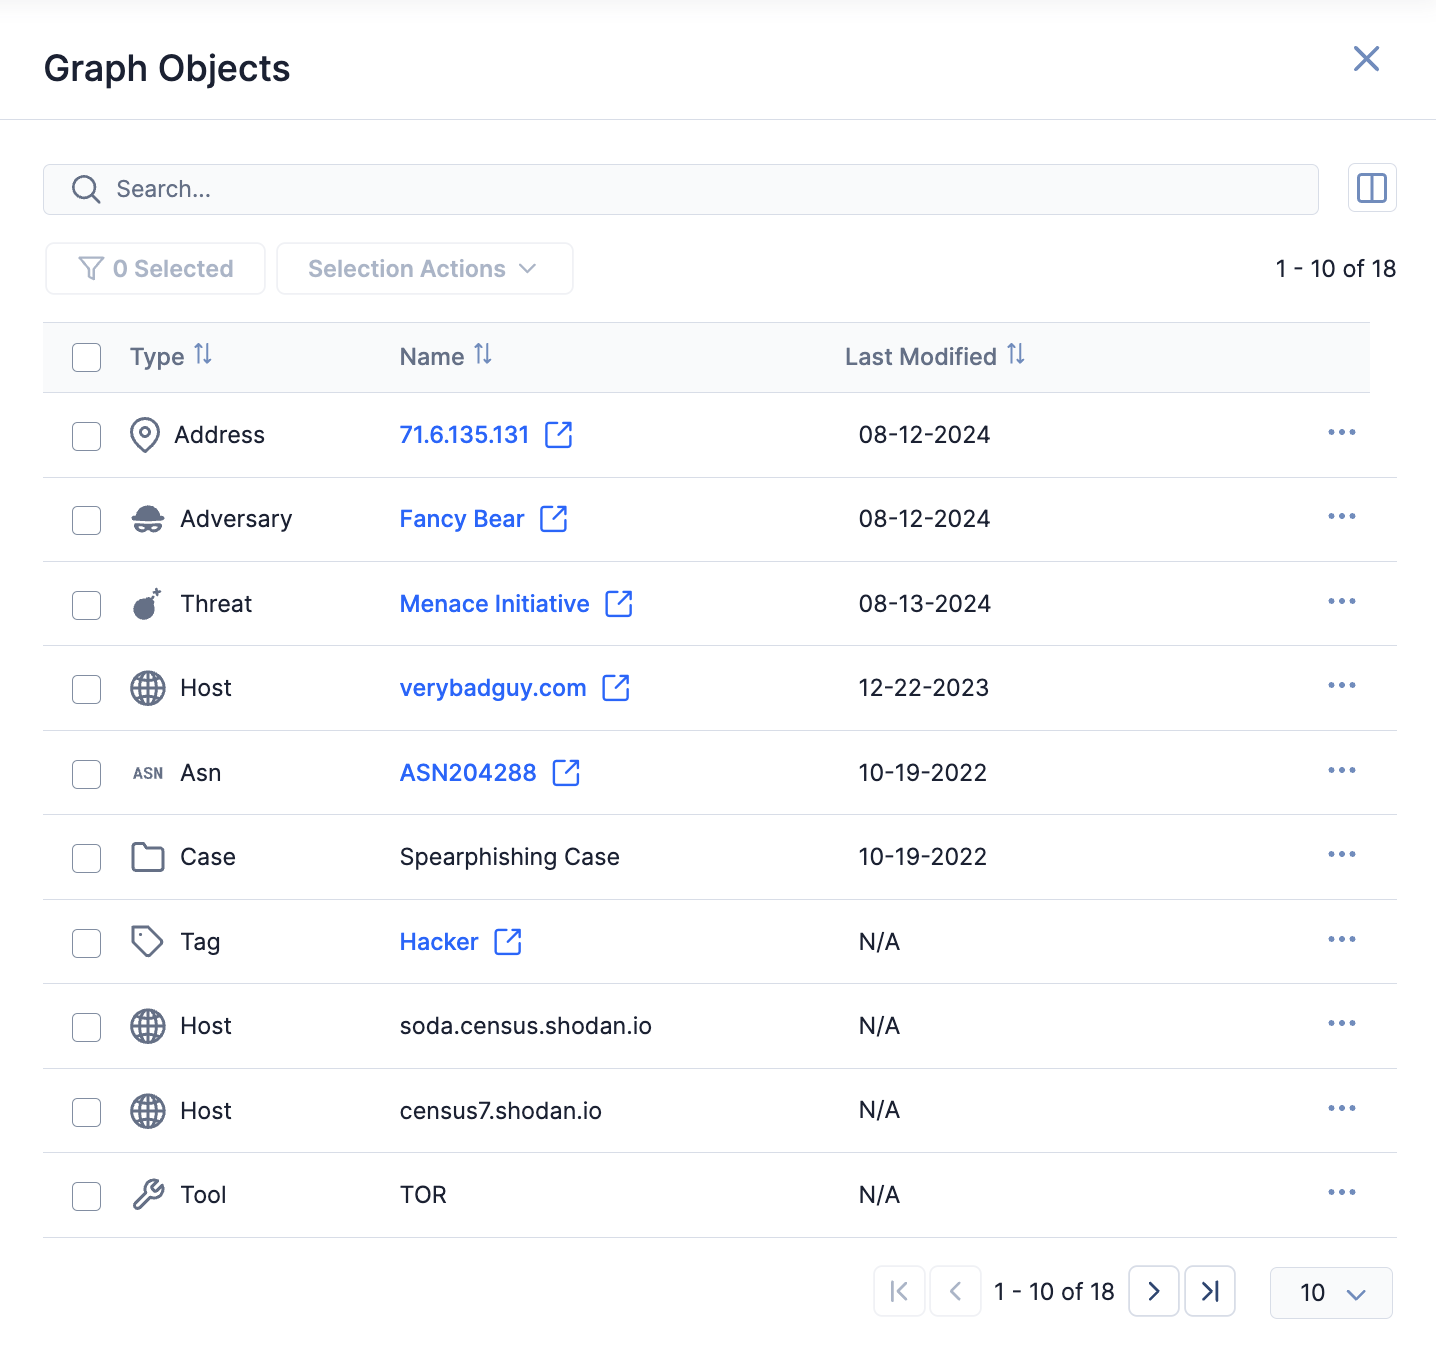
- (Optional) To open the Details drawer for an Indicator, Group, Tag, or Case that exists in ThreatConnect, click on the object’s row.NoteThe Details drawer is not available for objects that do not exist in ThreatConnect.
- (Optional) To open the Details screen for an Indicator, Group, or Tag that exists in ThreatConnect, click on the object’s name in the Name column.NoteYou cannot open a Case’s Details screen from the Graph Objects drawer. Instead, you must open the Case’s Details drawer and then click View case in new tab
 in the drawer’s header to open the Case’s Details screen.
ThreatConnect® is a registered trademark, and CAL™ is a trademark, of ThreatConnect, Inc.
MITRE ATT&CK® and ATT&CK® are registered trademarks of The MITRE Corporation.
20117-06 v.08.A