Overview
ThreatAssess and CAL™ provide metrics that give users context and insights about their Indicators. Located on an Indicator's Details drawer and Details screen, they serve different, but complementary, functions. ThreatAssess provides a single score for an Indicator that is derived from data for the Indicator across all sources in a local ThreatConnect® instance. CAL provides anonymized, crowdsourced intelligence derived from global data for the Indicator across all participating ThreatConnect instances. ThreatAssess and CAL data can be examined together to analyze how the understanding of an Indicator on a local instance compares with the collective understanding.
Before You Start
| Minimum Role(s) | Organization role of Read Only User |
|---|---|
| Prerequisites |
|
ThreatAssess
ThreatAssess gives a basic risk assessment of an Indicator through a single, actionable score. The score represents the overall potential impact that an Indicator might have on a security organization.
Viewing ThreatAssess Data for an Indicator
There are three areas in ThreatConnect where you can view ThreatAssess data for an Indicator: the Details drawer, the new Details screen, and the legacy Details screen.
Details Drawer
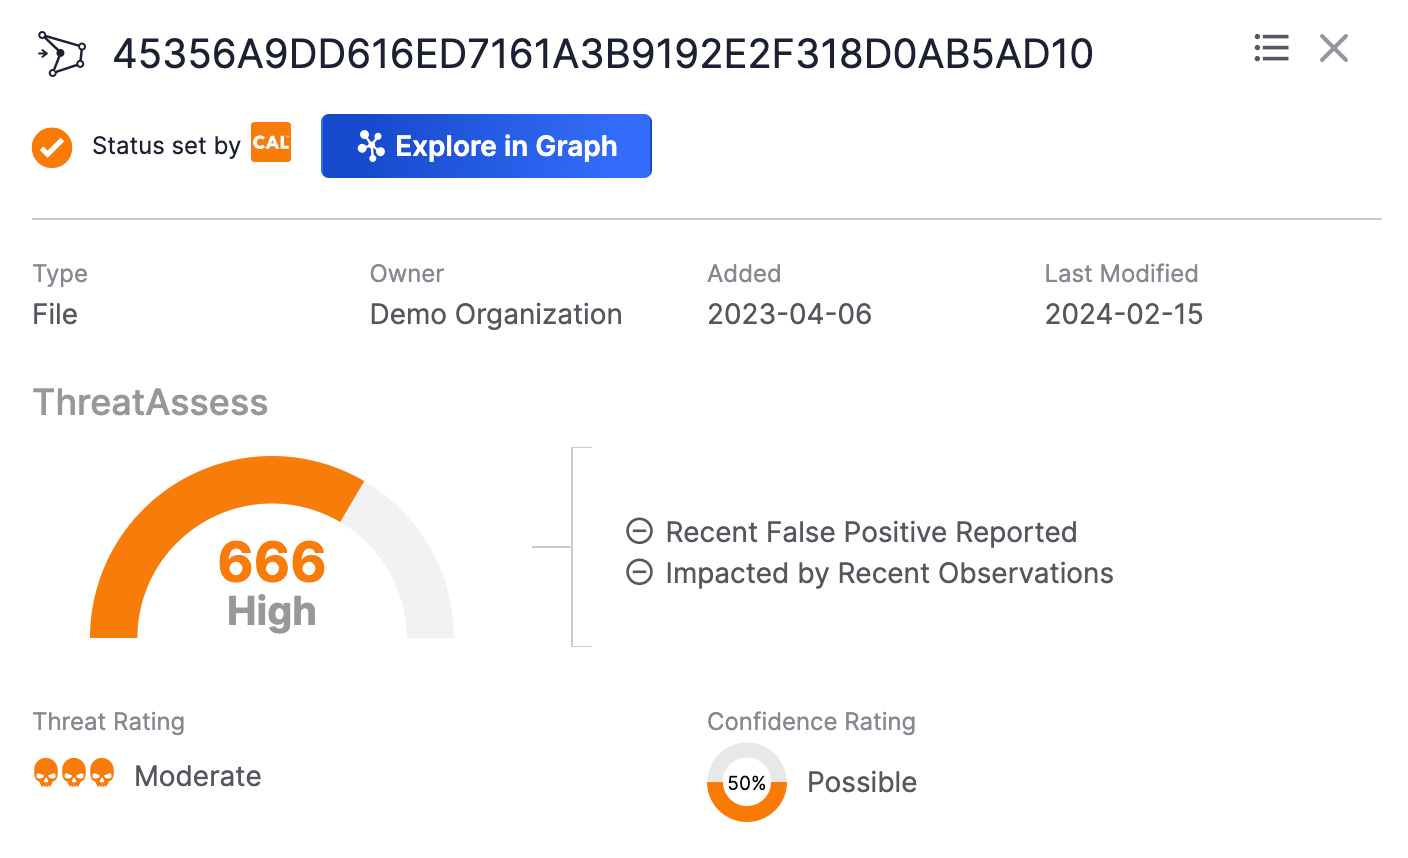
On an Indicator’s Details drawer , a summary of the Indicator’s ThreatAssess score will be displayed above the Threat Rating and Confidence Rating sections (Figure 1).
New Details Screen
On the Overview tab of an Indicator’s new Details screen, the Indicator’s ThreatAssess score and related data are displayed in the ThreatAssess & CAL section on the Details card (Figure 2).
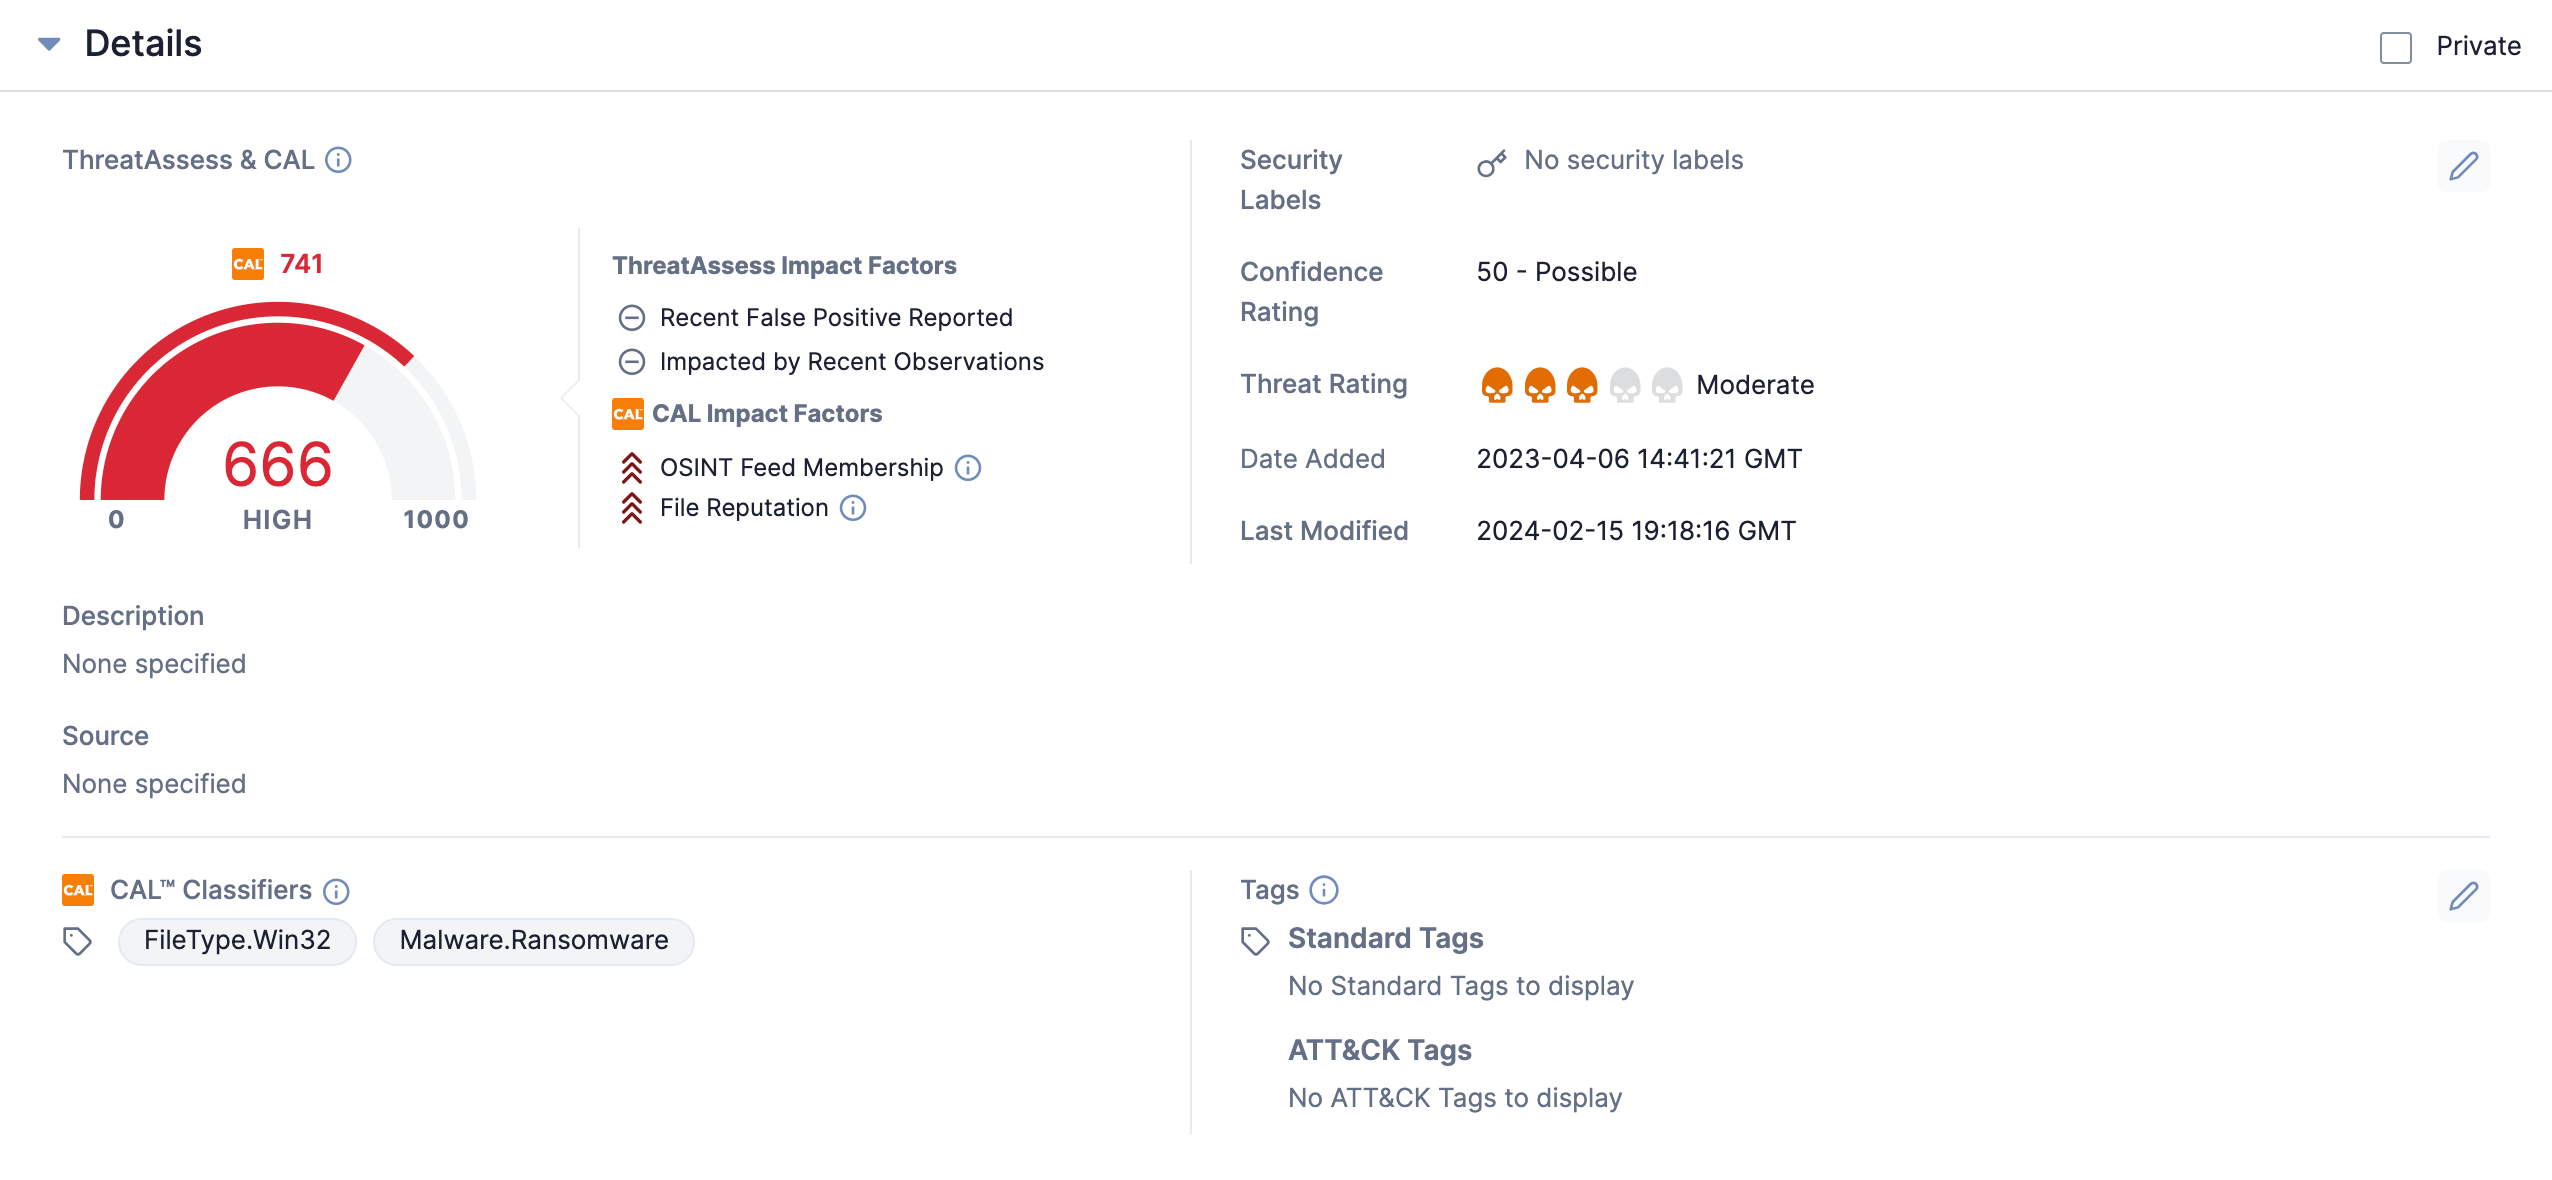
- ThreatAssess Score: The ThreatAssess score (666 in Figure 2) is out of a maximum value of 1000. Indicators with higher ThreatAssess scores represent an overall higher risk to your security organization. An Indicator’s ThreatAssess score is calculated based on the following metrics:
- Recent False Positive Reported
- Impacted by Recent Observation
- Threat Rating (based on the weighted-average Threat Rating of the Indicator across multiple owners in your instance of ThreatConnect)
- Confidence Rating (based on the weighted-average Confidence Rating of the Indicator across multiple owners in ThreatConnect).
- ThreatAssess Assessment: The ThreatAssess Assessment (High in Figure 2) represents a summary of how threatening a given Indicator is to your security organization. There are four possible Assessments: Low, Medium, High, and Critical. Contact your System Administrator for the definitions and thresholds of the Assessments used in your instance of ThreatConnect. System Administrators may customize the definitions and thresholds of the Assessments for their ThreatConnect instance, as described in the “ThreatAssess” section of ThreatConnect Account Administration Guide.
- ThreatAssess Impact Factors: This section displays the factors that contributed to an Indicator’s ThreatAssess score. To view a definition for an impact factor, hover your cursor over its name. Available ThreatAssess impact factors include the following:
- Recent False Positive Reported: Indicators that were reported as false positives represent a lower risk to your security organization and will have a lower ThreatAssess score. Based on whether the Indicator was recently reported as a false positive, one of the following icons will be displayed:
- Checkmark
 : The Indicator was recently reported as a false positive, where the amount of time that qualifies as “recently” is defined by your System Administrator. The default time period is 7 days.
 - Circle with a horizontal line
 : The Indicator was not recently reported as a false positive.
- Checkmark
- Impacted by Recent Observation: Indicators that were observed in an actual network potentially represent a greater risk to your security organization. A high number of recent observations may raise or lower the ThreatAssess score, depending on the nature of the Indicator. Based on whether the Indicator was impacted by a recent observation, one of the following icons will be displayed:
- Checkmark: The Indicator was impacted by a recent observation, where the amount of time that qualifies as “recent” is defined by your System Administrator. The default time period is 7 days.
- Circle with a horizontal line: The Indicator was not impacted by a recent observation.
- Checkmark
- Recent False Positive Reported: Indicators that were reported as false positives represent a lower risk to your security organization and will have a lower ThreatAssess score. Based on whether the Indicator was recently reported as a false positive, one of the following icons will be displayed:
Legacy Details Screen
On the Overview tab of an Indicator’s legacy Details screen, ThreatAssess score and related data are displayed in the ThreatAssess section of the Indicator Analytics card (Figure 3).
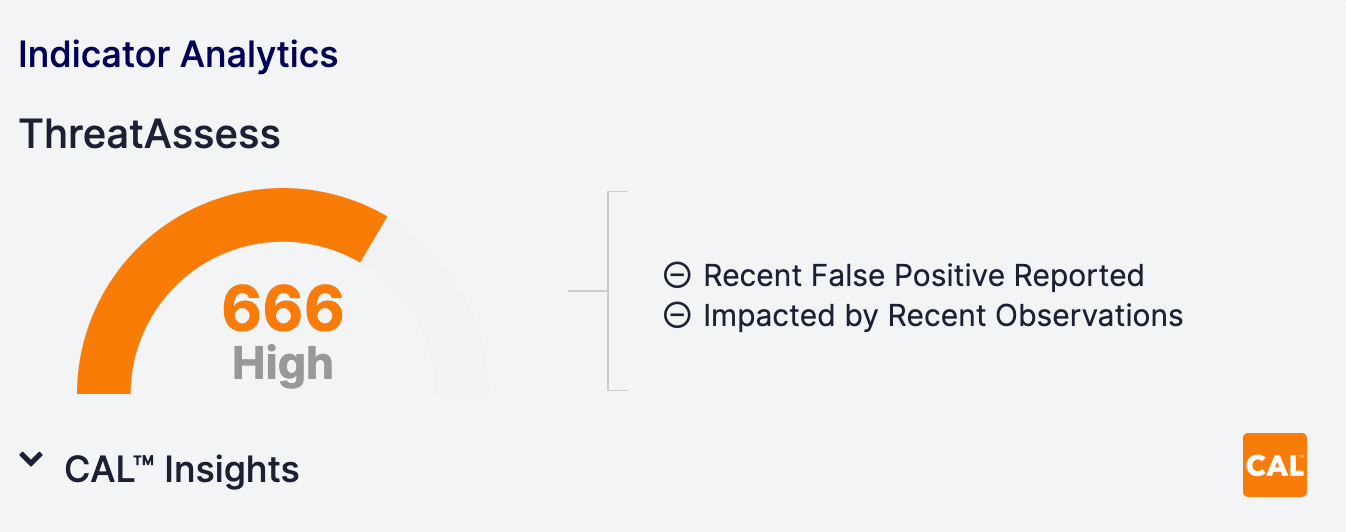
See the “New Details Screen” section for descriptions of each element in this section, as they are identical to the elements in the ThreatAssess section of the Details card on the new Details screen.
CAL
CAL aggregates anonymized data about an Indicator from all participating instances of ThreatConnect and other sources, giving you context about how the information you have on an Indicator compares with the information that the wider ThreatConnect community has on the Indicator.
Viewing CAL Data for an Indicator
There are three areas in ThreatConnect where you can view CAL data for an Indicator: the Details drawer, the new Details screen, and the legacy Details screen. In addition to viewing CAL data in these areas, you can use Threat Graph to discover, visualize, and explore relationships between Indicators within a CAL dataset.
Details Drawer
On an Indicator’s Details drawer, CAL data are displayed at the bottom of the drawer. Scroll down to view them, if necessary (Figure 4).
New Details Screen
CAL data are displayed throughout several cards on the Overview tab of an Indicator’s new Details screen, allowing you to view global data from CAL in a more logical way, alongside local data from your ThreatConnect instance. This layout provides a clearer, more holistic view of the threat posed by a given Indicator and allows you to easily identify whether the information displayed is from CAL or your local instance.
- The CAL Impact Factors and CAL™ Classifiers sections of the Details card, as well as the Indicator’s CAL score
- The CAL™ Feeds section of the Owners & Feeds card
- The CAL™ File Hash Information section of the File Hash Details card
- The CAL™ Provider Information section of the Geolocation card
- The Global CAL™ section of the Observations, False Positives, & Impressions card
Details Card
The Details card (Figure 2) displays the following CAL data in the ThreatAssess & CAL section:
- CAL Score: An Indicator’s CAL reputation score (666 in Figure 2) is out of a maximum value of 1000. This score is based on several factors, including aggregated and anonymized false positive and observation data from all instances participating in CAL, an Indicator’s presence in malicious and benign data sources to which CAL has access and ingests, relationships to other known good and bad Indicators in CAL, and more.
- CAL Impact Factors: This section displays the key factors, if any, that impacted an Indicator’s CAL score and corresponding icons that indicate how much each factor impacted the Indicator’s CAL score and whether it increased or decreased the score. For example, the
 icon displayed to the left of the OSINT Feed Membership and File Reputation factors in Figure 2 indicates that each factor significantly impacted the Indicator’s CAL score and caused it to increase. However, if a factor moderately impacted the Indicator’s CAL score and caused it to decrease, then the
 icon would be displayed to the left of that factor. To view a definition for an impact factor, hover your cursor over its name.
In addition, the Details card displays CAL Classifiers applied to the Indicator in the CAL™ Classifiers section. See the “CAL Classifiers” section for more information.
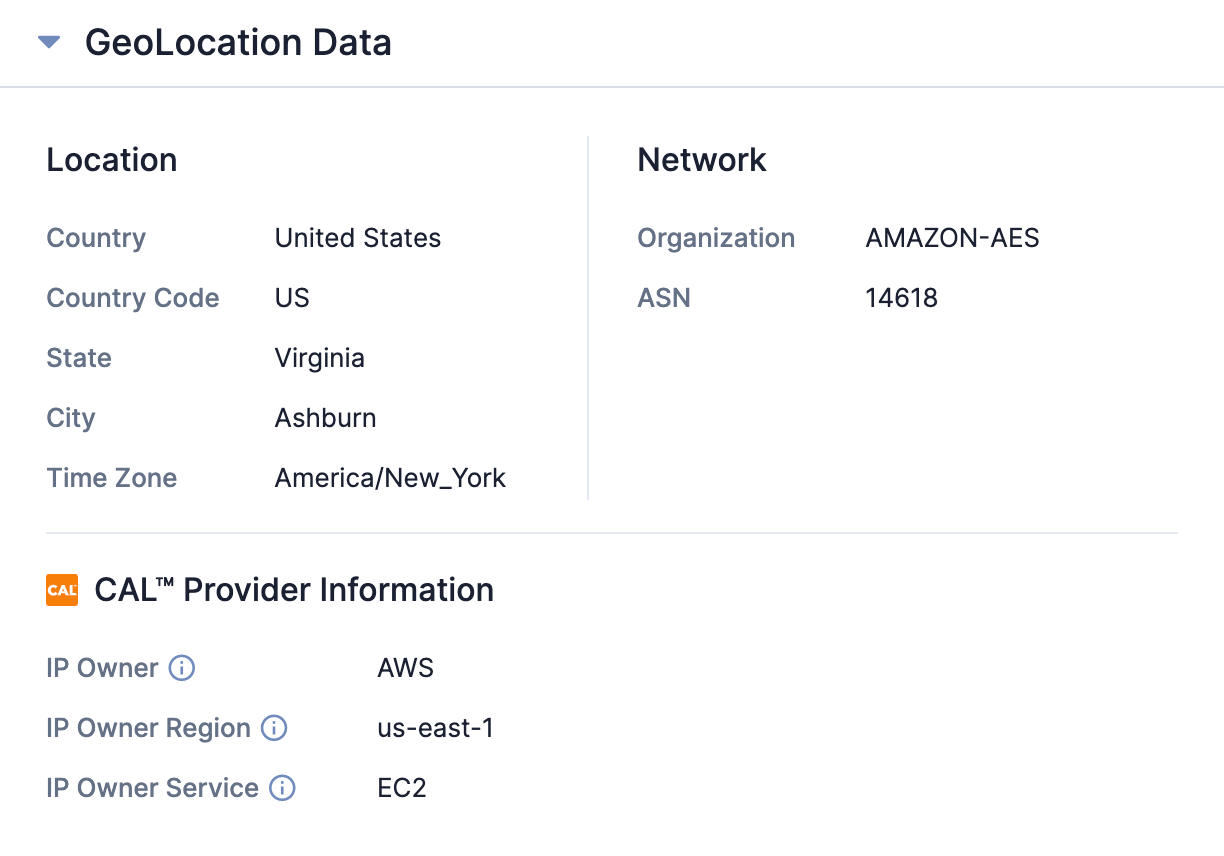
GeoLocation Data Card
The CAL™ Provider section of the GeoLocation Data card (Figure 5), which is available for Address Indicators only, displays the following information if CAL has knowledge of the Address’ service provider:
- IP Owner: The name of the service provider that claims to own the Address.
- IP Owner Region: The geographical region assigned to the Address, according to its owner.
- IP Owner Service: The service for which the Address is used, according to its owner.
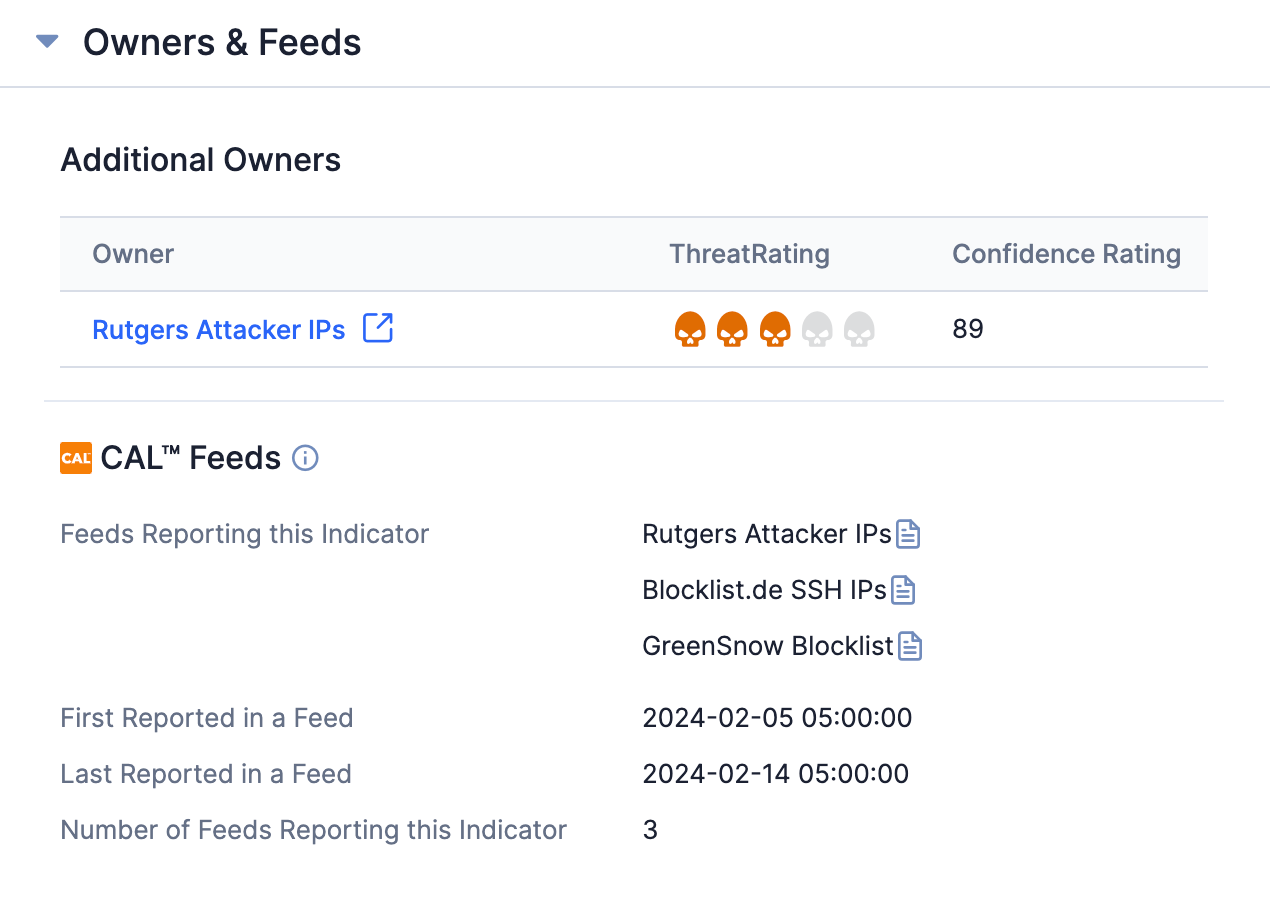
Owners & Feeds Card
The CAL™ Feeds section of the Owners & Feeds card (Figure 6) displays any feeds reporting the Indicator, the date and time when the Indicator was first reported and last reported in a feed, and the number of feeds reporting the Indicator. See the “Feed Report Cards in CAL” section for instructions on how to view a feed’s report card.
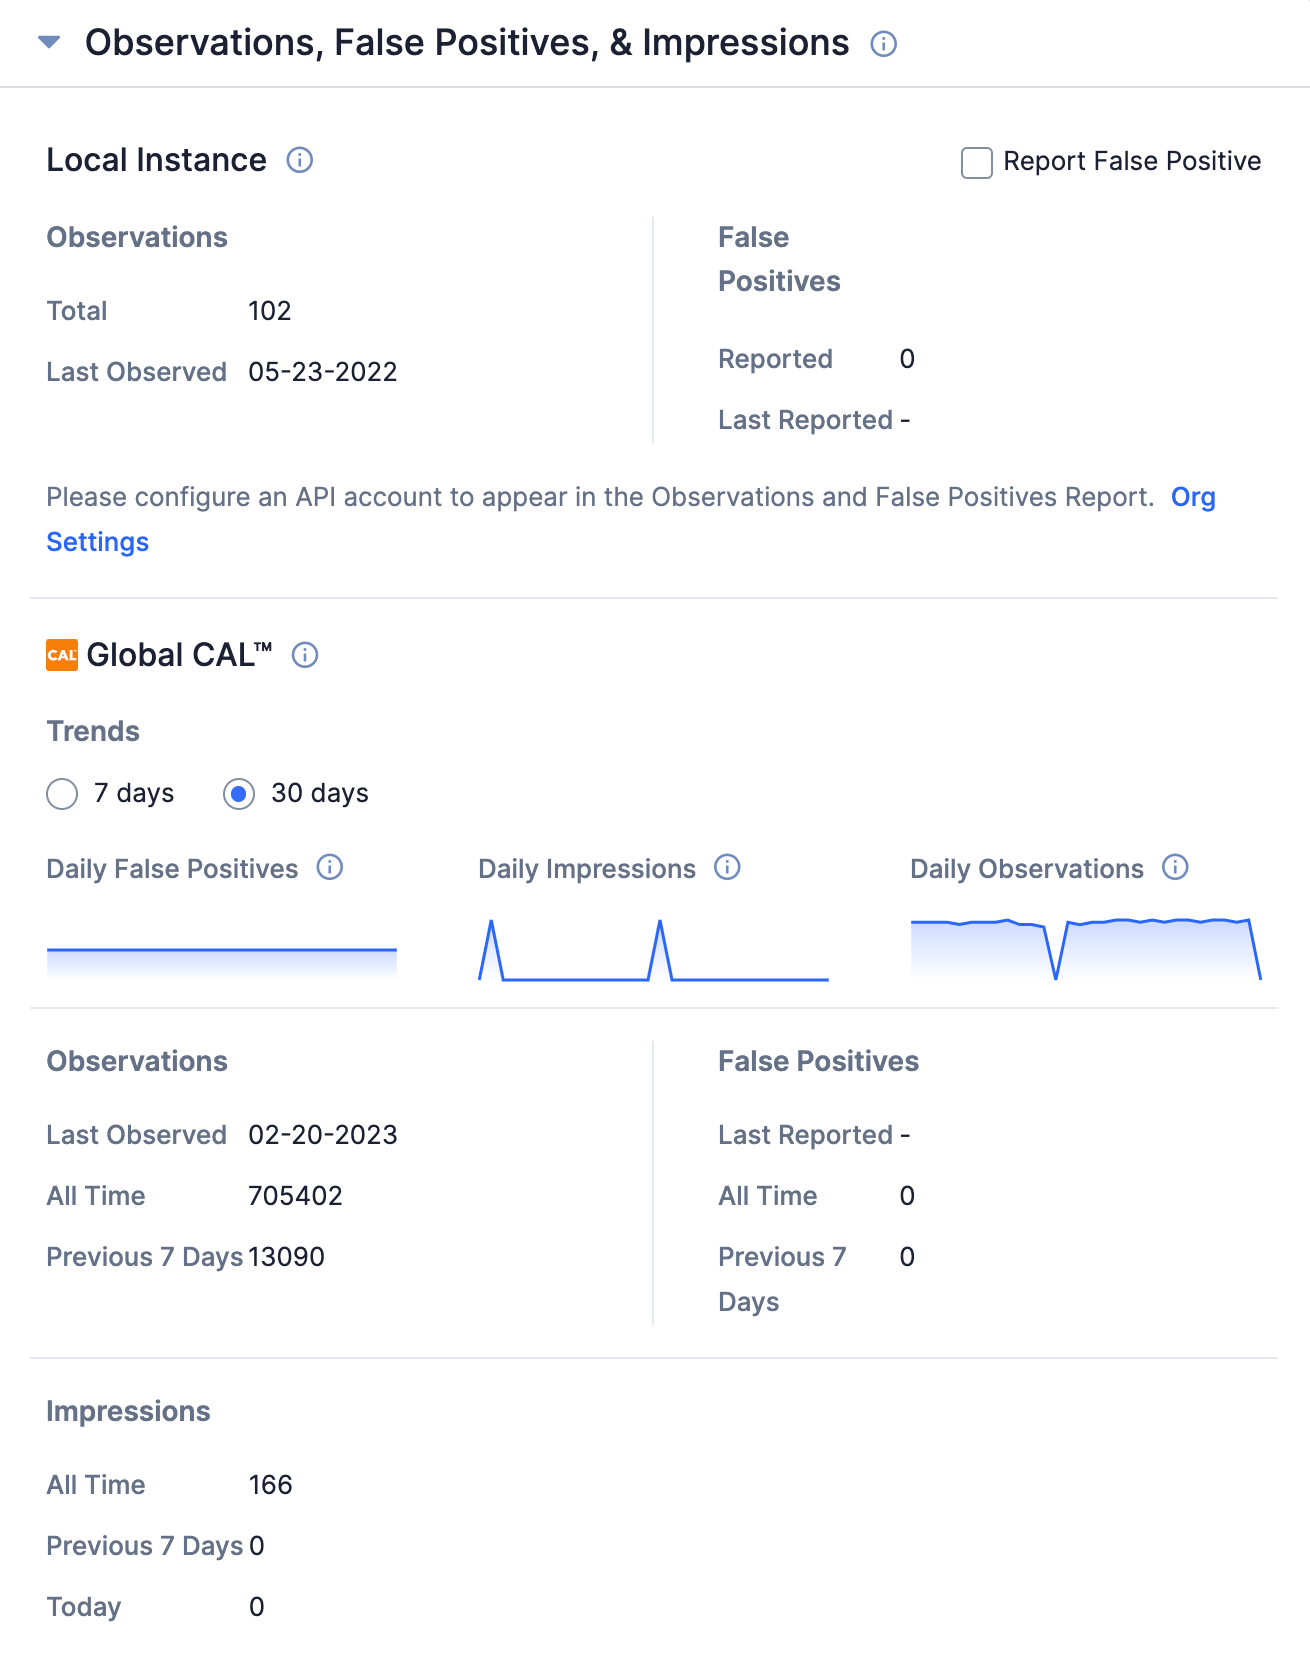
Observations, False Positives, & Impressions Card
The Global CAL™ section of the Observations, False Positives, & Impressions card (Figure 7) displays data for observations, false positives, and impressions derived from CAL. These data are displayed in the following subsections:
- Trends: This subsection displays the Daily False Positives, Daily Impressions, and Daily Observations charts, which can be configured to display data for the last 7 or 30 days. To view a description for a chart, hover over its title.
- Observations: This subsection displays the date when the Indicator was last observed, the total number of times it was observed, and the number of times it was observed in the last 7 days.
- False Positives: This subsection displays the date when the Indicator was last reported as a false positive, the total number of times it was reported as a false positive, and the number of times it was reported as a false positive in the last 7 days.
- Impressions: This subsection displays the total number of impressions (i.e., the number of times an Indicator was viewed, searched for, or looked up via a Playbook), the number of impressions for the last 7 days, and the number of impressions for the current day.
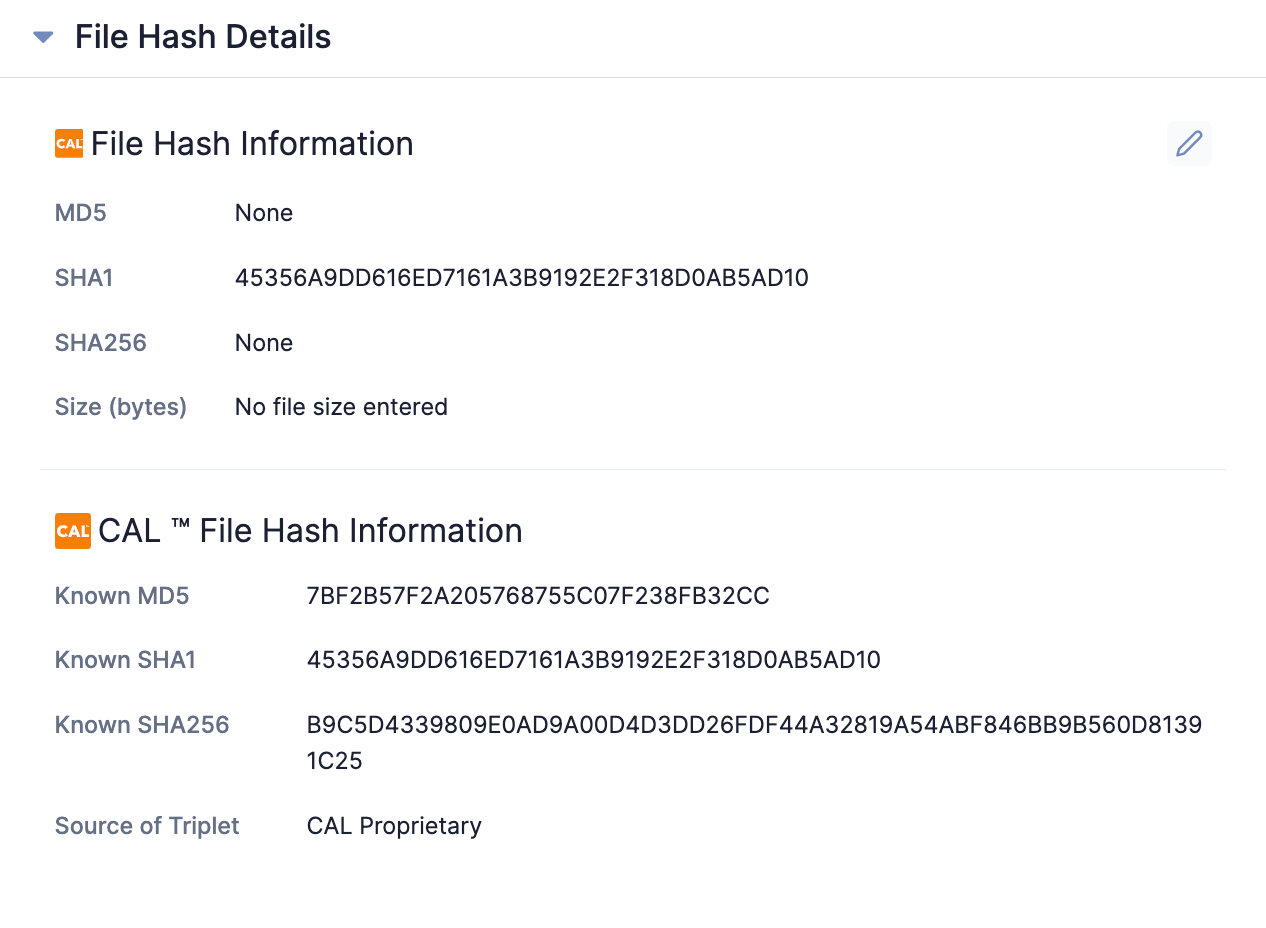
File Hash Details Card
The CAL™ File Hash Information section of the File Hash Details card (Figure 8), which is available for File Indicators only, displays file hash information derived from CAL to help identify where file hashes have been seen listed together. Specifically, this section displays the following information:
- Hash Validation: The status of the file hash validation performed by CAL. Available statuses include the following:
- Complete: The Indicator’s MD5, SHA1, and SHA256 file hashes correctly belong together and form a complete triplet, according to CAL.
- Incomplete: At least one of the Indicator’s file hashes is missing, resulting in an incomplete triplet.
- Invalid: At least one of the Indicator’s file hash values differs from the value that exists in CAL for the same file hash type, resulting in an invalid triplet.
- Known MD5, Known SHA1, and Known SHA256: The MD5, SHA1, and SHA256 file hashes derived from CAL based on its analysis of one of the Indicator’s file hashes. If the Indicator contains multiple file hashes, CAL will analyze the most precise file hash (SHA256, then SHA1, then MD5).
- Source of Triplet: The source from which the known MD5, SHA1, and SHA256 file hashes were retrieved.
Legacy Details Screen
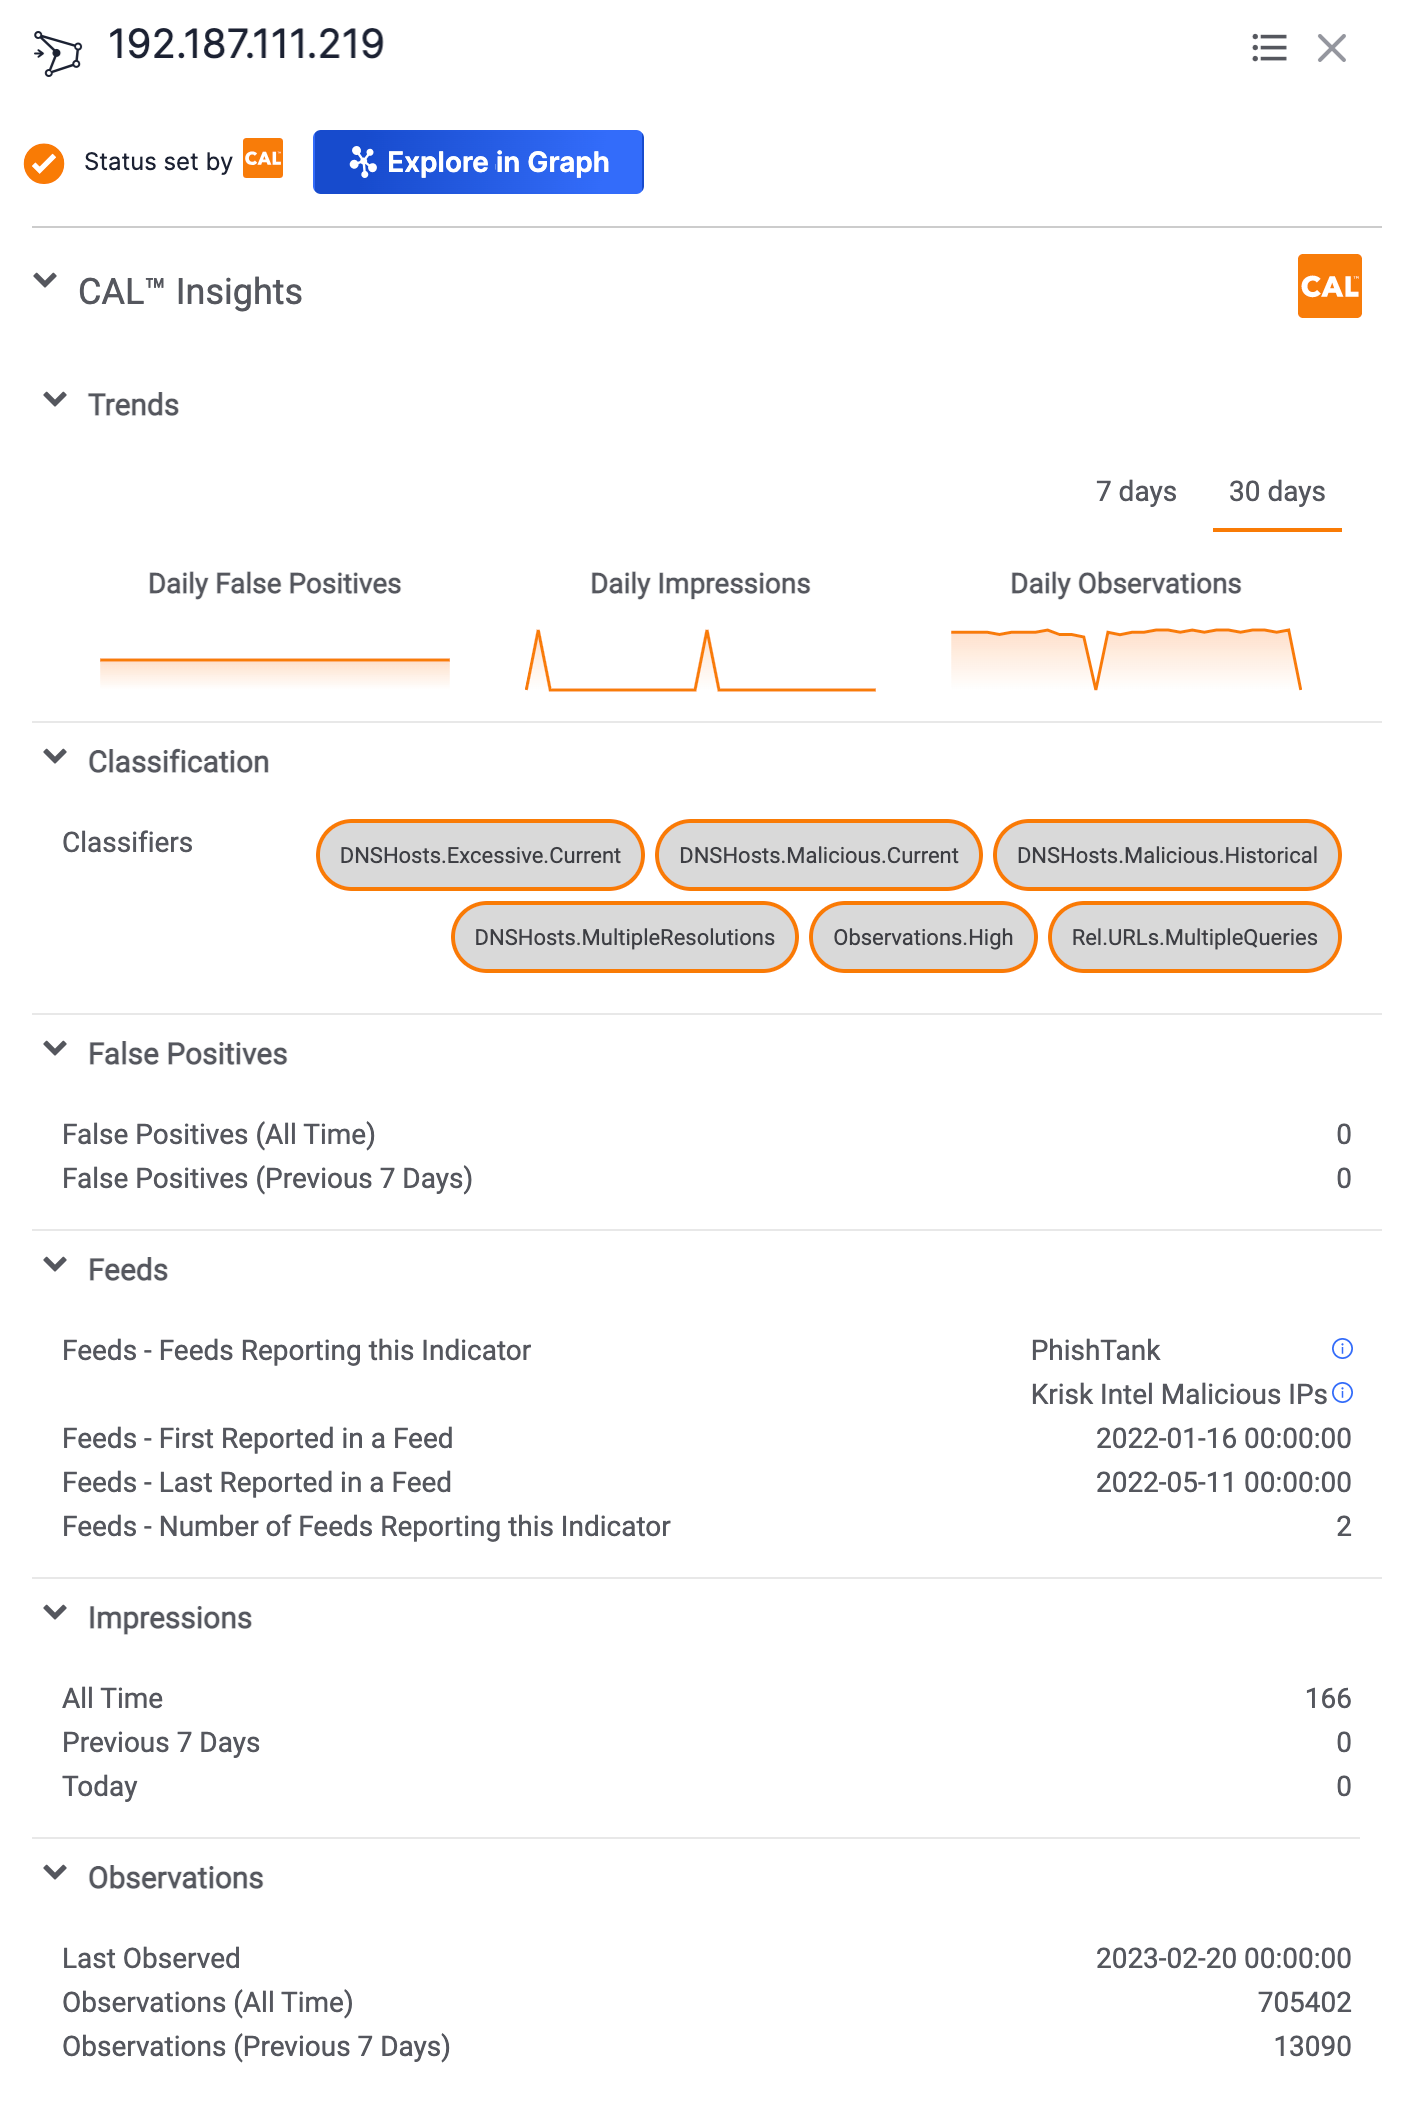
On the Overview tab of an Indicator’s legacy Details screen, CAL data are displayed on the Indicator Analytics card. Figure 9 shows the Indicator Analytics card expanded to display all CAL data for the Indicator, under the CAL™ Insights heading. Sections under the CAL™ Insights heading can be expanded and collapsed by clicking on the section heading.
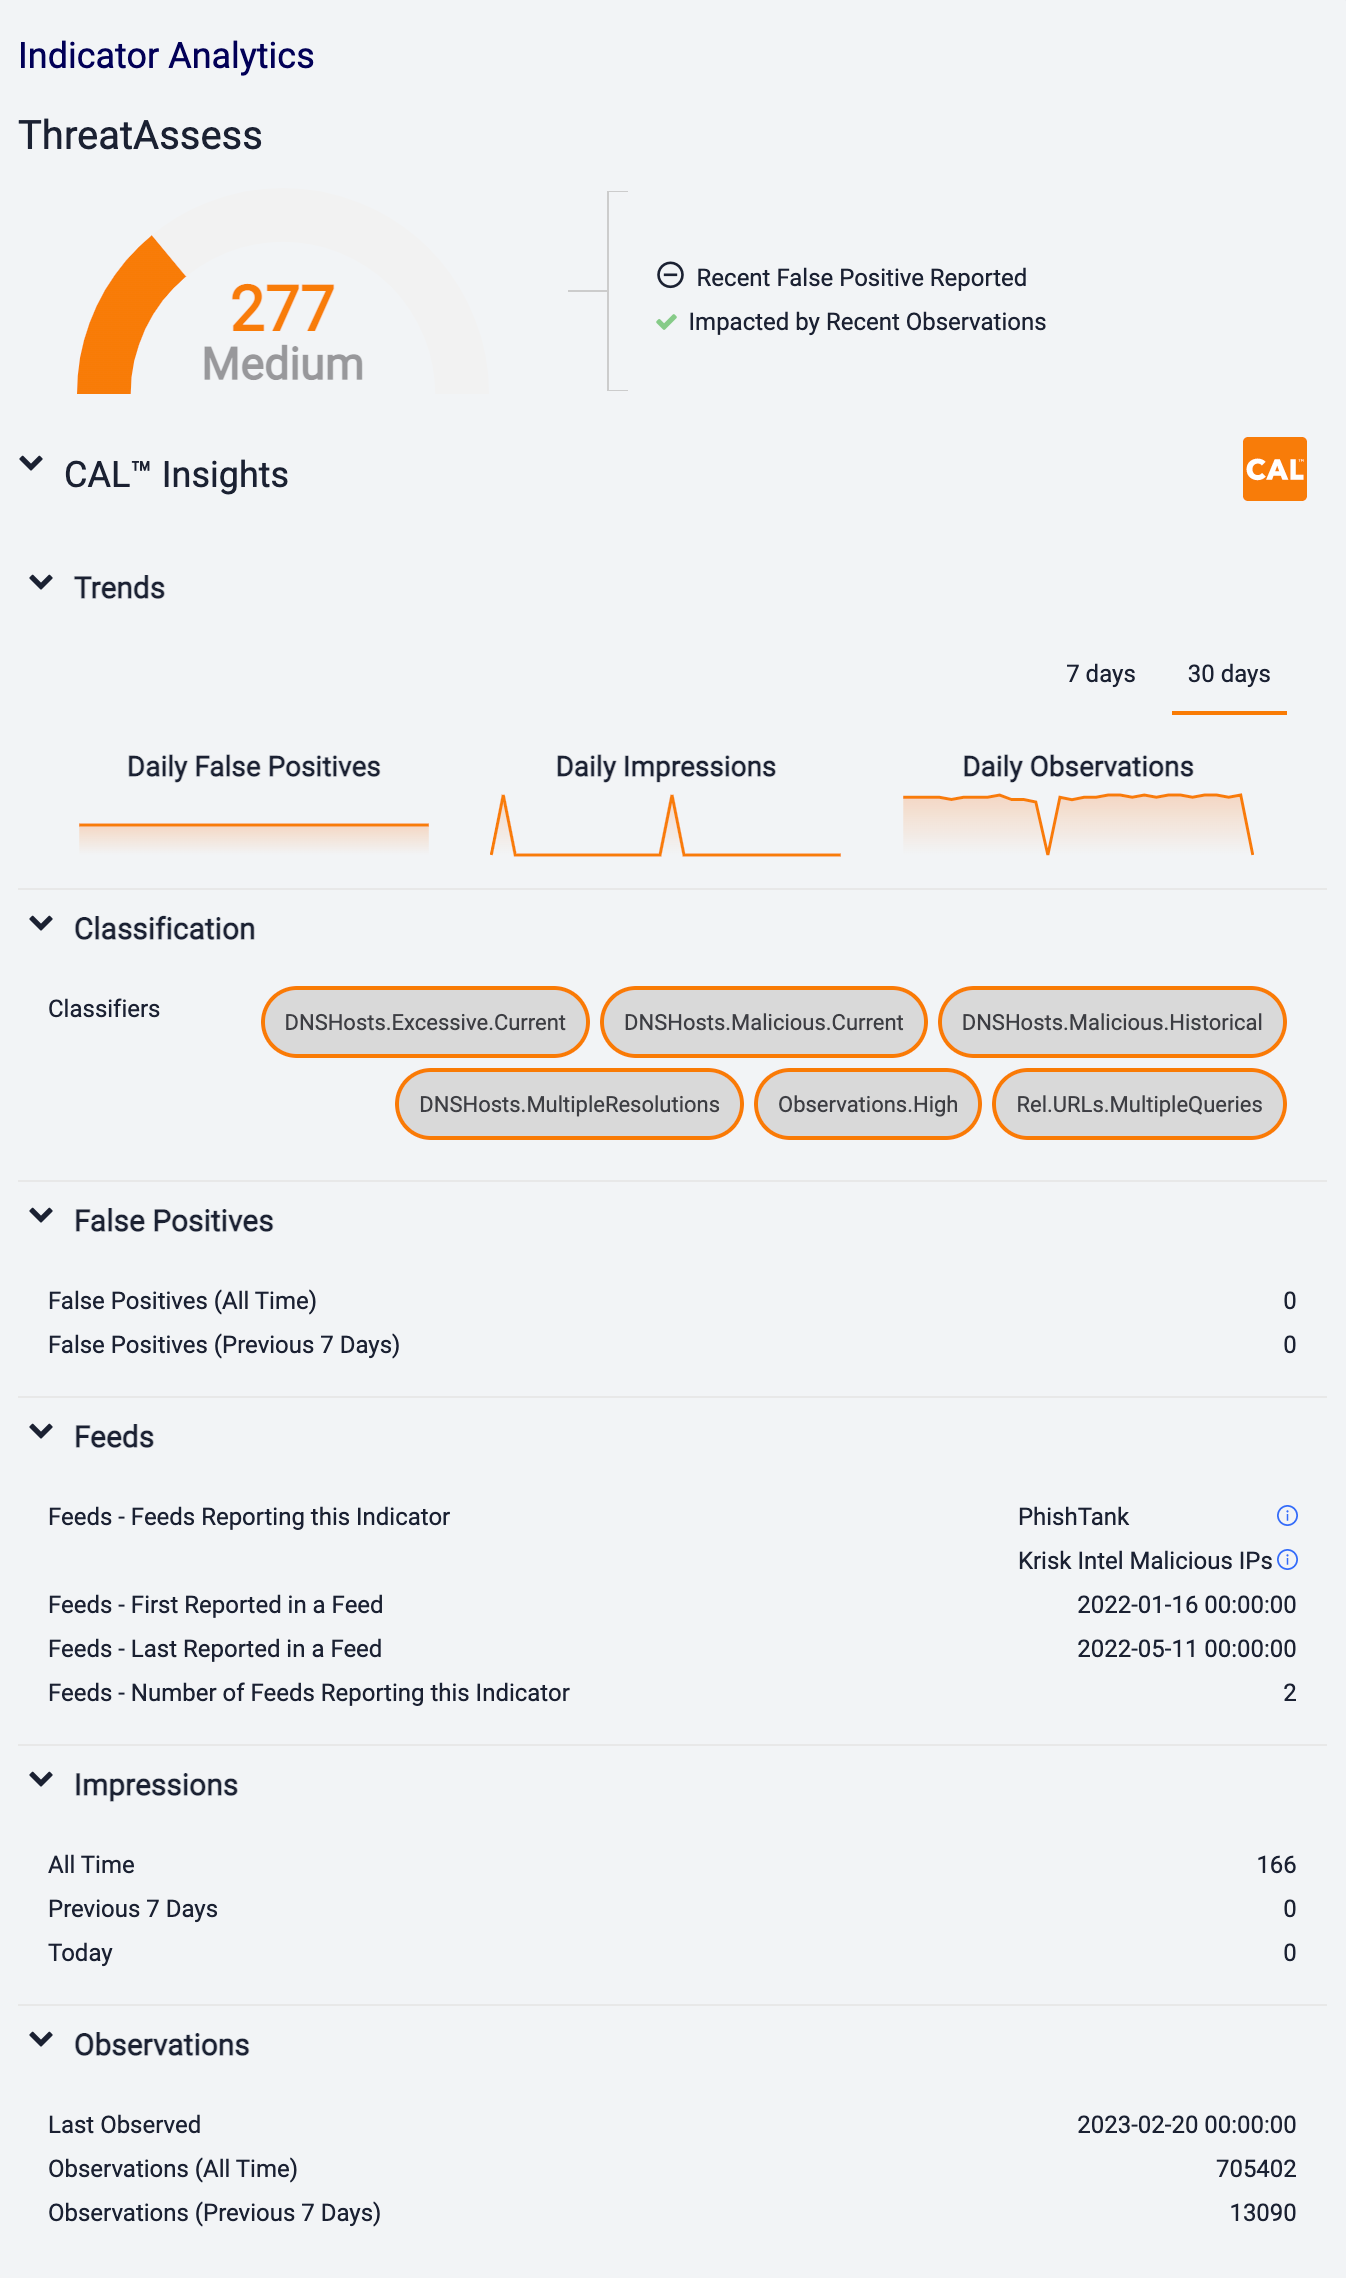
Hovering the cursor over the three chart titles (Daily False Positives, Daily Impressions, and Daily Observations) in the Trends section displays a definition of the metric being represented by the chart. By default, the three charts display data for the past 30 days. To display data for the past 7 days, click 7 days at the top right of the three charts.
CAL Classifiers
CAL Classifiers are pre-defined categorizations derived from CAL’s classification analytics. CAL Classifiers applied to an Indicator will be displayed in the CAL™ Classifiers section of the Details card on the new Details screen (Figure 2) and the Classifiers section on the Details drawer (Figure 4) and legacy Details screen (Figure 9).
Examples of CAL Classifiers include, but are not limited to, TorExitNode, Trending.Observations, HostedInfrastructure.AWS, and TLD.Risky. See CAL Classifiers Glossary for more information, including a table that lists and defines all currently available Classifiers.
CAL Fields
Table 1 lists examples of CAL fields displayed in each subsection of the CAL Insights™ section on the Details drawer and legacy Details screen and sample data for each field. Only fields for which data exist will show up in the CAL results for a given Indicator.
| CAL Field | Sample Data |
|---|---|
| False Positives: False Positives (All Time) | 11 |
| False Positives: False Positives (Last Reported) | 12/19/2018 10:57:04 |
| False Positives: False Positives (Previous 7 Days) | 3 |
| False: False Positives (Today) | 1 |
| Feeds: Feeds Reporting this Indicator | tor_exit_node |
| Feeds: First Reported in a Feed | 12/19/2018 10:57:04 |
| Feeds: Last Reported in a Feed | 12/19/2018 10:57:04 |
| Feeds: Number of Feeds Reporting this Indicator | 2 |
| Feeds: Known Good - Feeds Reporting this Indicator as Benign | google_safebrowsing |
| Feeds: Known Good - Reported in a Known Good Source | TRUE |
| Impressions: Impressions (All Time) | 22 |
| Impressions: Impressions (Previous 7 Days) | 5 |
| Impressions: Impressions (Today) | 2 |
| Observations: Observations (All Time) | 42 |
| Observations: Observations (Last Observed) | 12/19/2018 10:57:04 |
| Observations: Observations (Previous 7 Days) | 21 |
| Observations: Observations (Today) | 3 |
Feed Report Cards in CAL
Feeds reporting an Indicator will be displayed in the CAL Feeds section of the Owners & Feeds card on the new Details screen (Figure 7) and the Feeds section on the Details drawer (Figure 4) and legacy Details screen (Figure 9).
Some feeds will display a (new Details screen) or
 icon (Details drawer and legacy Details screen) to the right of its name. For these feeds, hovering over the feed’s name will display a window with a mini report card for the feed (Figure 10).
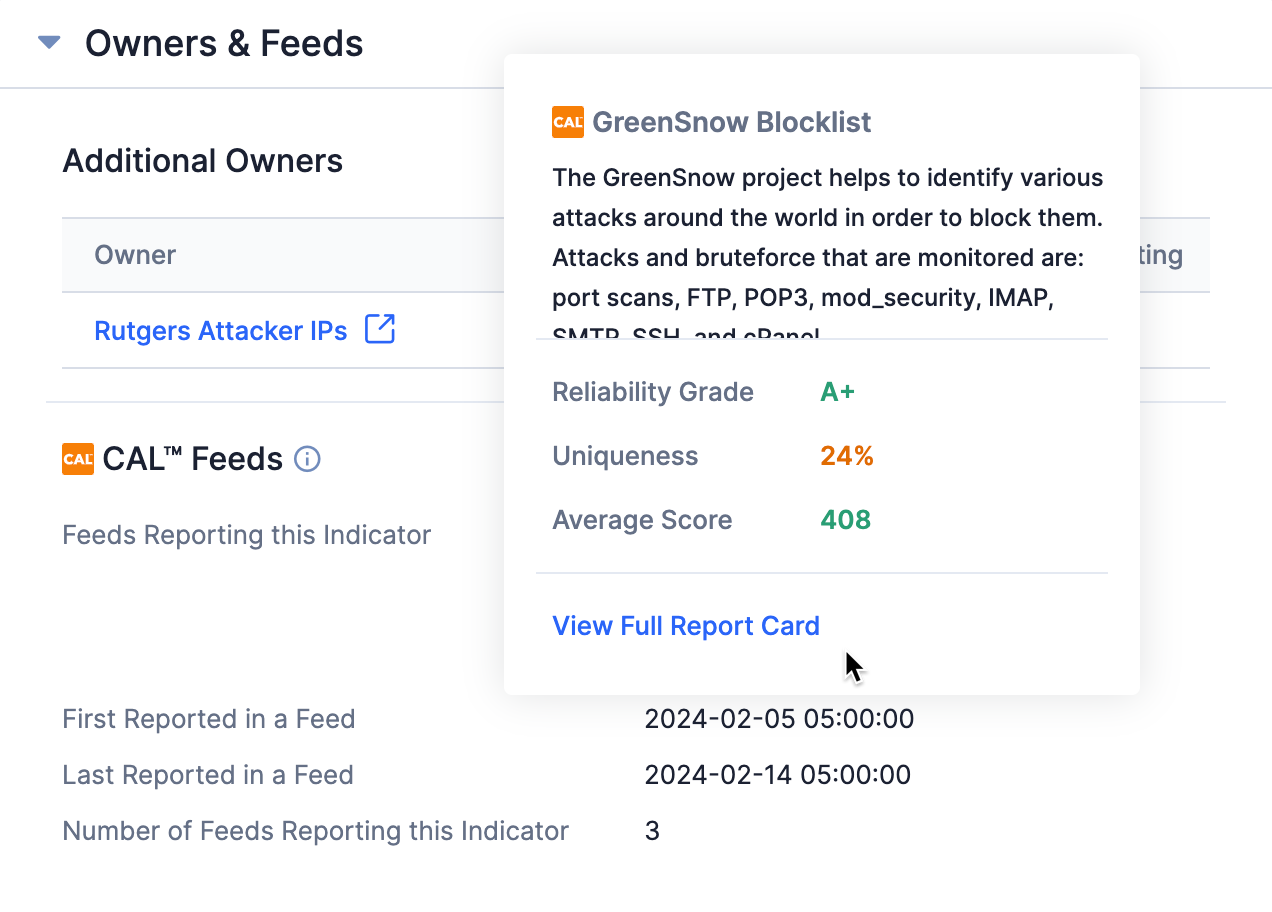
The mini report card provides the name and a description of the feed and the following information and metrics about the data provided by the feed:
- Reliability Grade: This item provides a letter grade indicating how reliable the feed is, from F (worst) to A+ (best). It is derived from the number of false positives found in the feed, among other things, and is a measure of how likely a feed is to yield large numbers of negatively impactful false positives.
- Uniqueness: This item provides the percentage of Indicators in this feed that are unique (i.e., that are not found in other feeds on which CAL gathers data as well). For example, a score of 28% means that 28% of the Indicators in the feed are not found in other feeds (and, consequently, that 72% of the Indicators appear in other feeds).
- Average Score: This item is a weighted average of CAL’s reputation score (0–1000) for Indicators reported by this feed in the last 90 days.
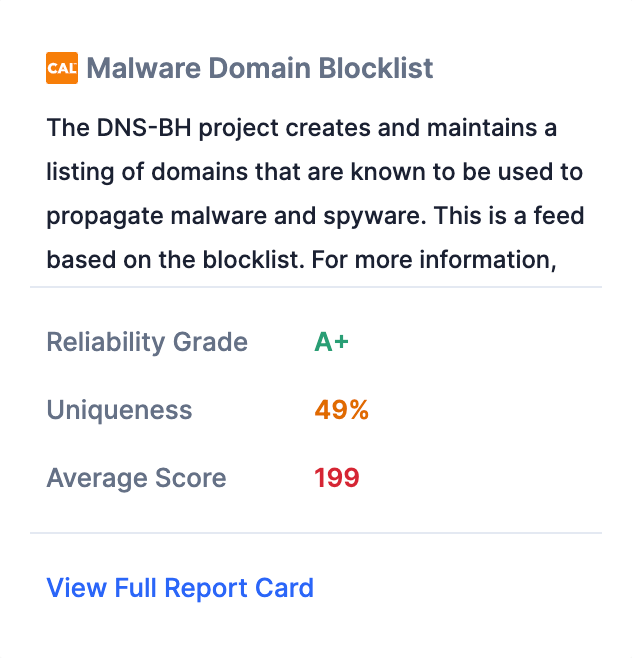
These measures provide an at-a-glance way to gauge the “health” of the feed. In addition, the colors in which the measures are displayed provide a quick indication of the feed’s health, where green signifies “good,” orange signifies “medium,” and red signifies “bad.” Figure 11 shows a mini report card for a feed with red and orange items.
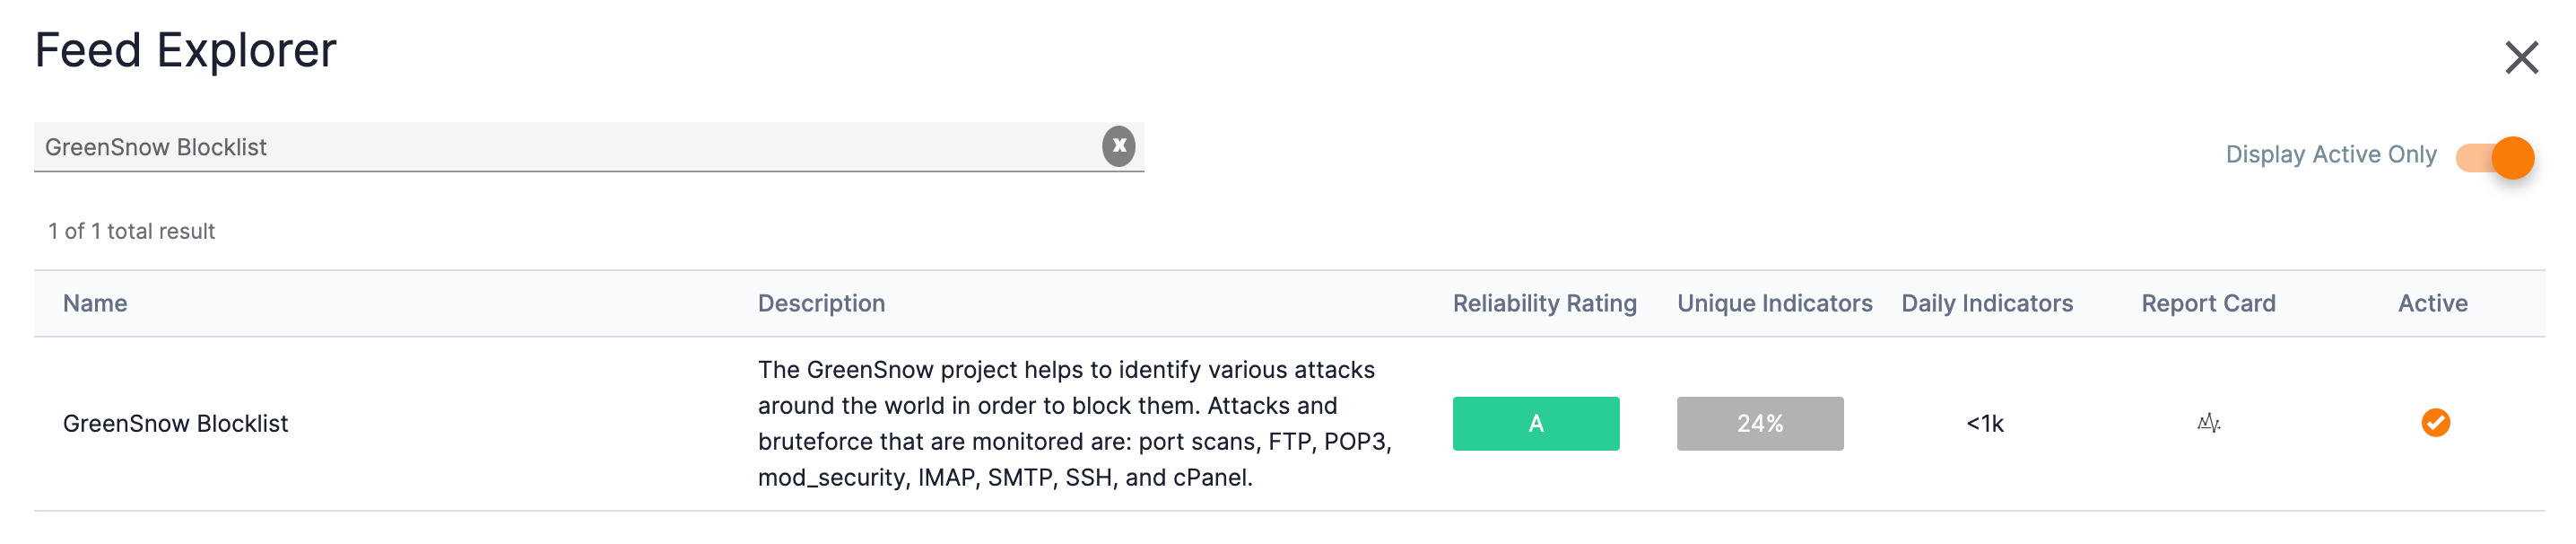
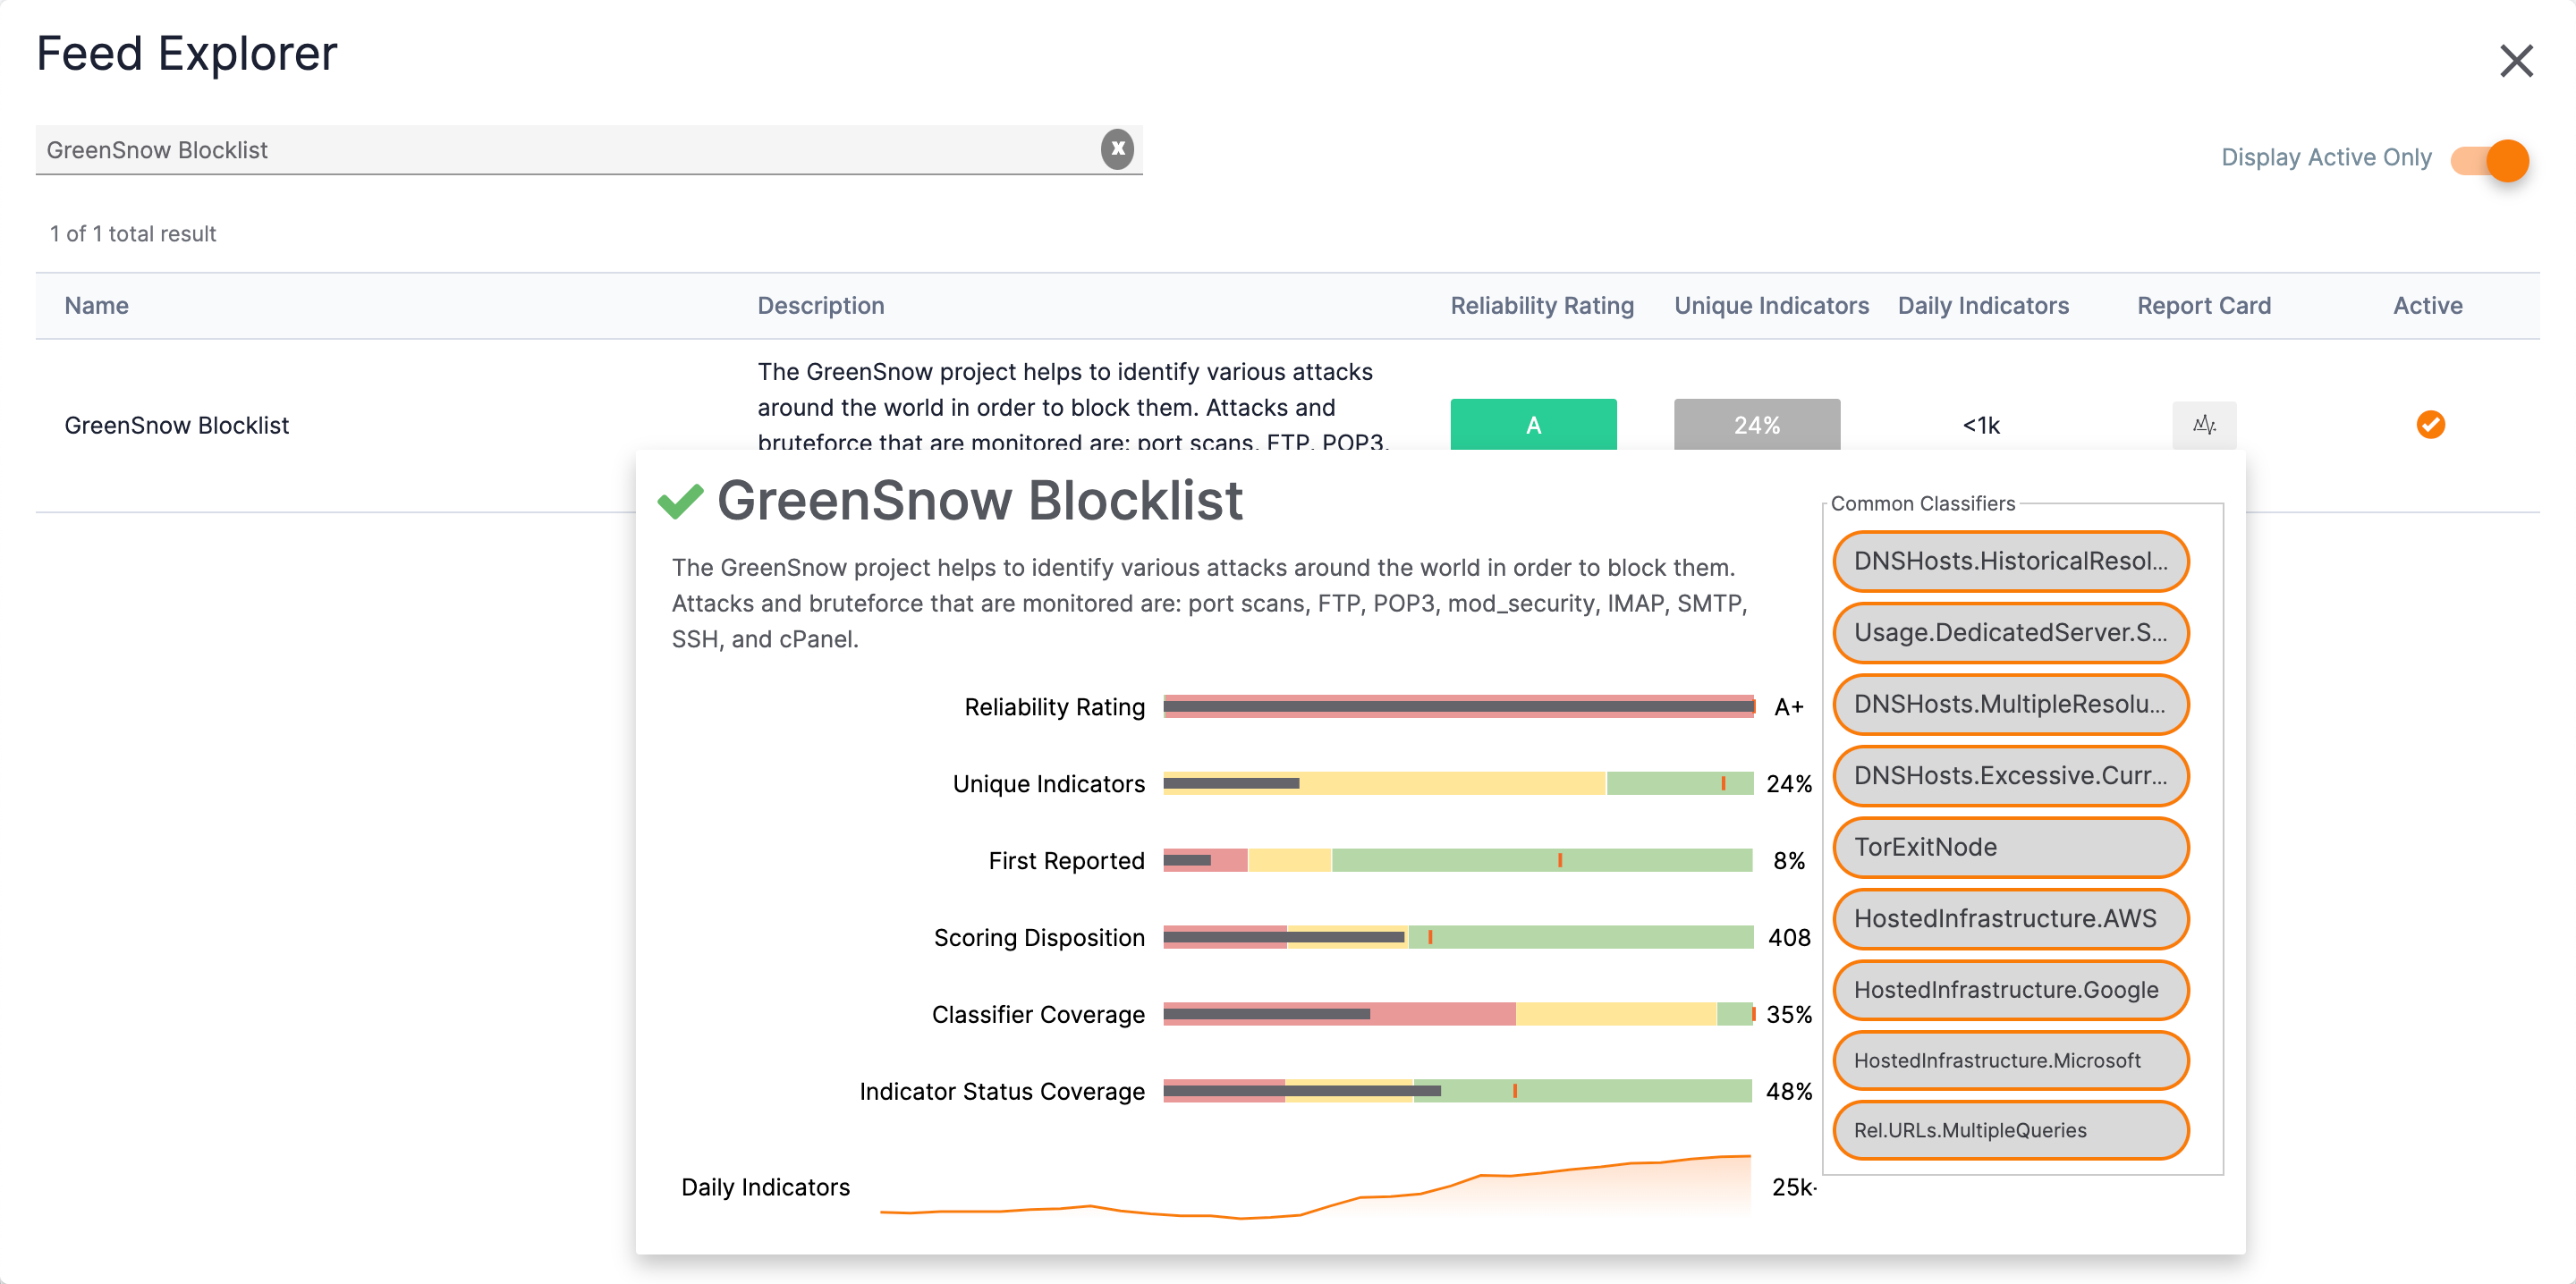
Clicking the View Full Report Card link at the bottom of a mini report card displays more details about the feed in the Feed Explorer screen (Figure 12).
Click the graph icon in the Report Card column to display a full report card for the feed (Figure 13).
ThreatConnect® is a registered trademark, and CAL™ is a trademark, of ThreatConnect, Inc.
20053-01 v.13.B