Overview
Pivoting is an analytic transition in which you move from one entity—Indicators and Groups in the ThreatConnect® Data Model, as well as Tags and Attributes—to an associated entity as defined by the Diamond Model. Through pivoting, you can explore relationships and find correlations between entities in a contiguous manner.
Before You Start
User Roles
- To pivot from Indicators, Groups, Tags, and Attributes in an Organization, your user account can have any Organization role.
- To pivot from Indicators, Groups, Tags, and Attributes in a Community or Source, your user account can have any Community role except Banned.
Pivoting From Indicators and Groups
There are three areas in ThreatConnect where you can pivot from Indicators and Groups:
Details Drawer
Follow these steps to pivot from an Indicator or a Group on the Details drawer:
- Open the Details drawer for an Indicator or a Group.
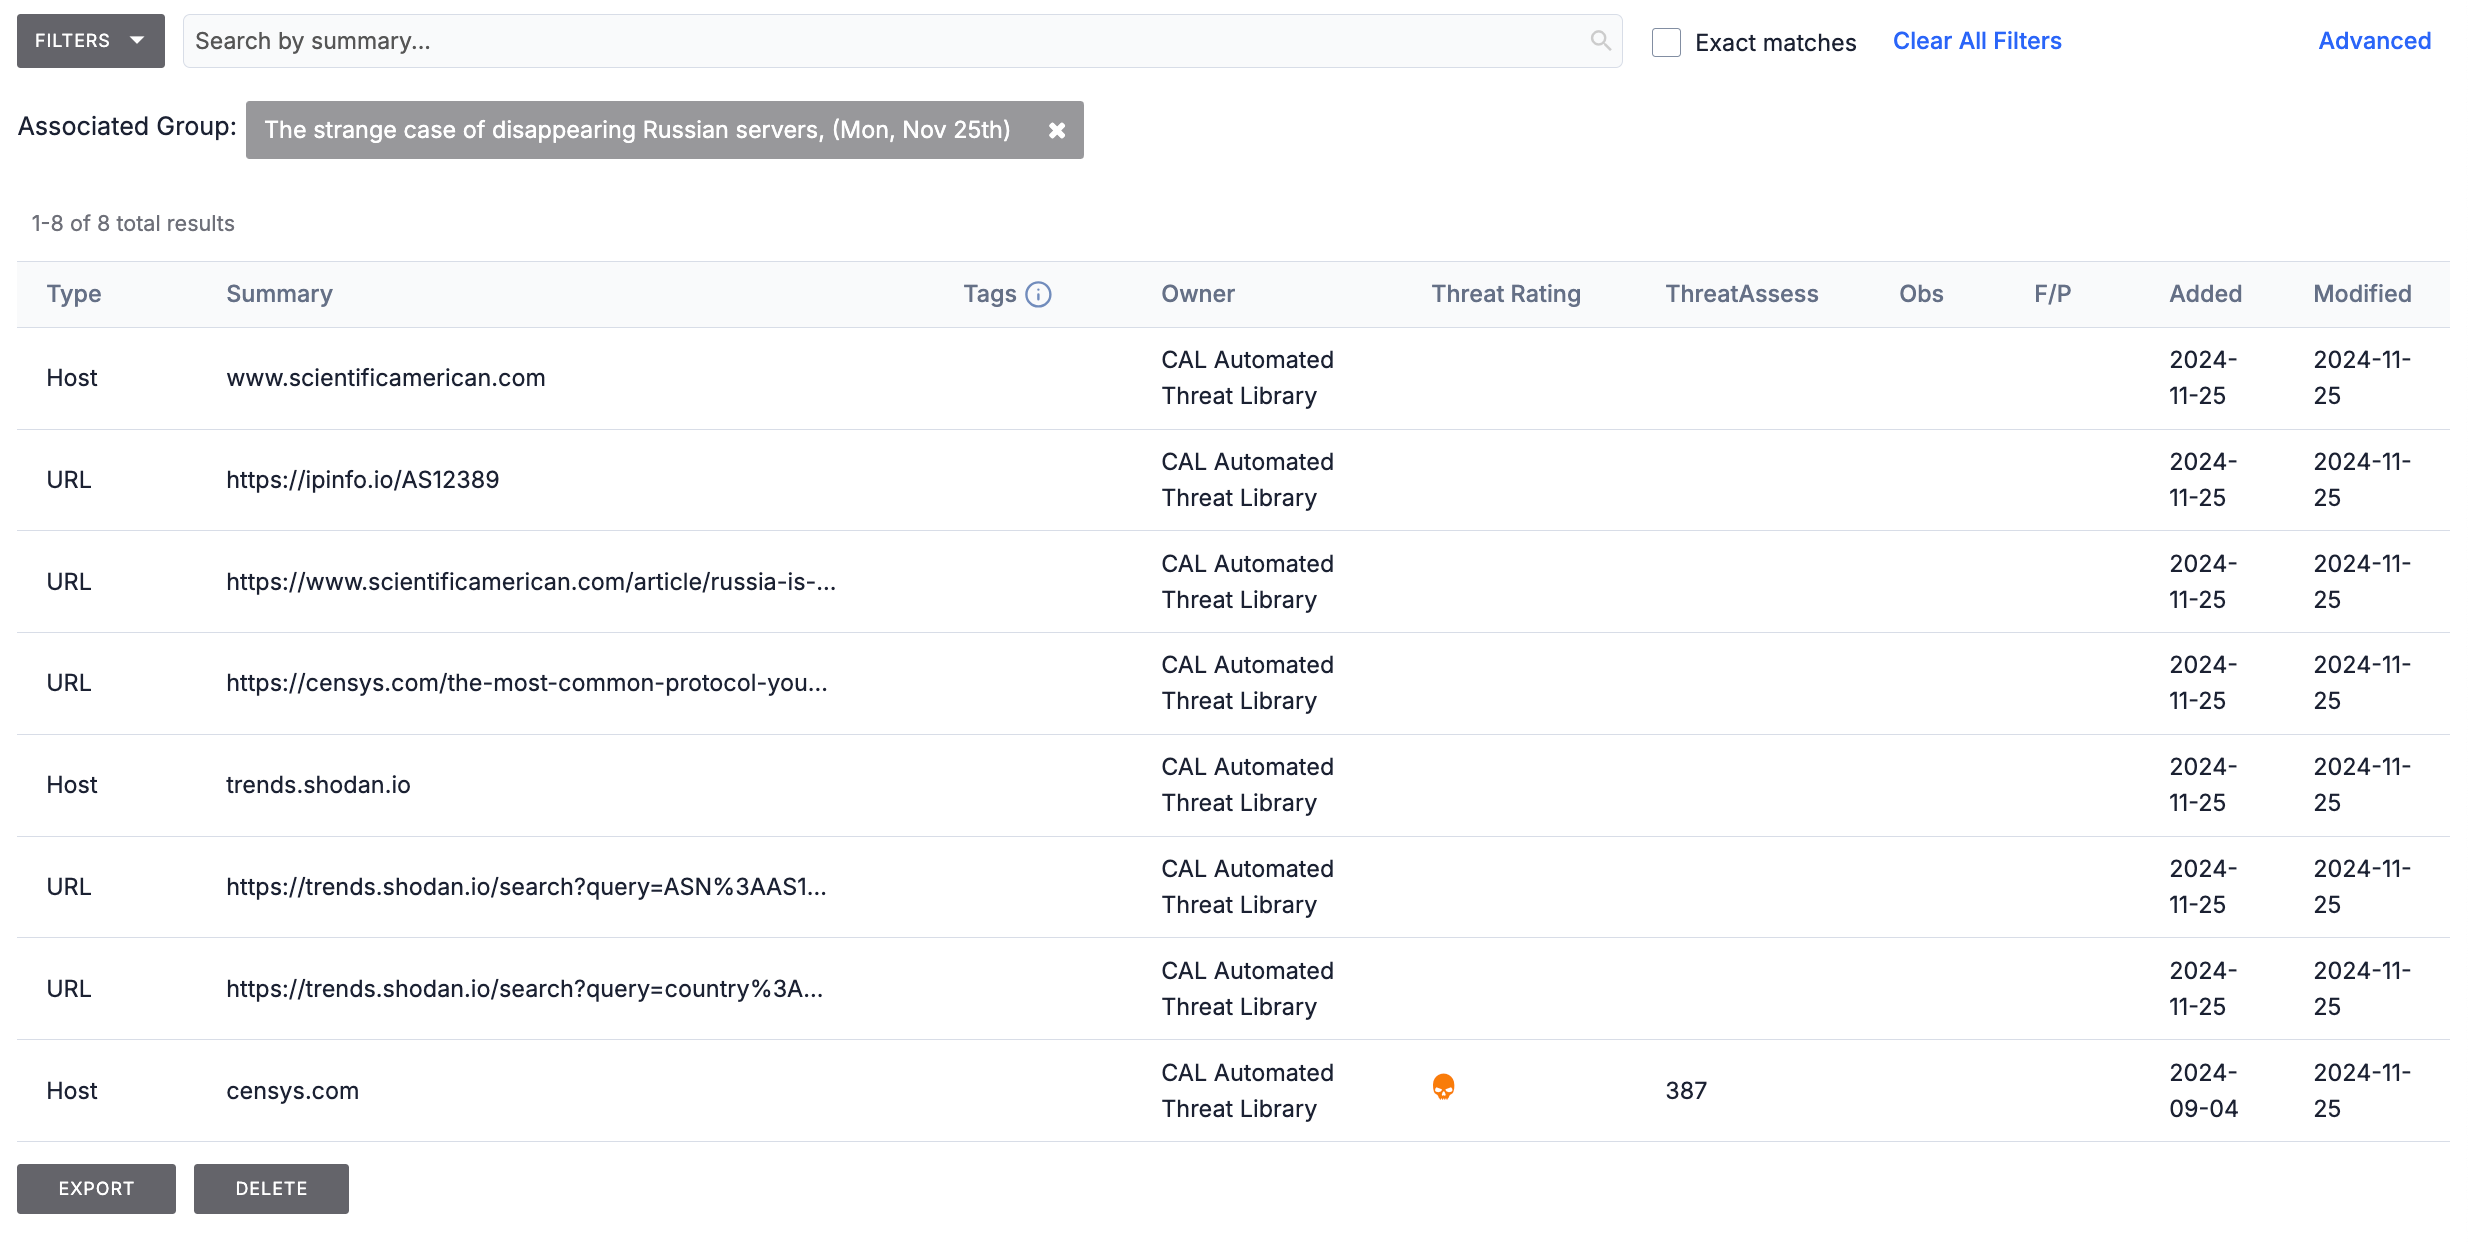
- Click the ⋯ menu in the Details drawer header and select Pivot. The Browse screen will open and display the following elements (Figure 1):NoteIf viewing the Details drawer for an Email, Signature, or Task Group, click the ⋮ menu in the Details drawer header and select Pivot to pivot from the Group.
- A results table with all Groups (if you selected Pivot on an Indicator’s Details drawer) or Indicators (if you selected Pivot on a Group’s Details drawer) associated to the object you pivoted from.
- A gray rectangle containing the summary of the object you pivoted from. This element will be displayed above the results table.
Details Screen
Follow these steps to pivot from an Indicator or a Group on the Details screen:
- Open the Details screen for an Indicator or a Group.
- Click the ⋯ menu in the Details screen header and select Pivot. The Browsescreen will open and display the following elements:
- A results table with all Groups (if you selected Pivot on an Indicator’s Details screen) or Indicators (if you selected Pivot on a Group’s Details screen) associated to the object you pivoted from.
- A gray rectangle containing the summary of the object you pivoted from. This element will be displayed above the results table.
Legacy Details Screen
Follow these steps to pivot from an Indicator or a Group on the legacy Details screen:
- Open the legacy Details screen for an Indicator or a Group.
- Click Pivot in the legacy Details screen header. The Browsescreen will open and display the following elements:
- A results table with all Groups (if you clicked the Pivot button on an Indicator’s legacy Details screen) or Indicators (if you clicked the Pivot button on a Group’s legacy Details screen) associated to the object you pivoted from.
- A gray rectangle containing the summary of the object you pivoted from. This element will be displayed above the results table.
Pivoting From Tags
Follow these steps to pivot from Tag:
- Open the Details drawer for a Tag.
- Click the ⋮ menu in the Details drawer header and select Pivot.
- After selecting Pivot, select whether to pivot on Indicators or Groups. The Browsescreen will open and display the following elements:
- A results table with all Indicators or Groups the Tag is applied to.
- A gray rectangle containing the name of the Tag you pivoted from. This element will be displayed above the results table.
Pivoting From Attributes
You can pivot from an Attribute on the Details screen and legacy Details screen for the Indicator, Group, or Victim the Attribute belongs to.
Details Screen
Follow these steps to pivot from an Attribute added to an Indicator or a Group on the Details screen:
- Open the Details screen for an Indicator or a Group.ImportantYou can pivot from Attributes added to Email, Signature, and Task Groups or Victims on the legacy Details screen only.
- Expand an Attribute on the Attributes card. If the maximum character length for the Attribute’s type is 500 or less, the Pivot button will be available for the Attribute (Figure 2).
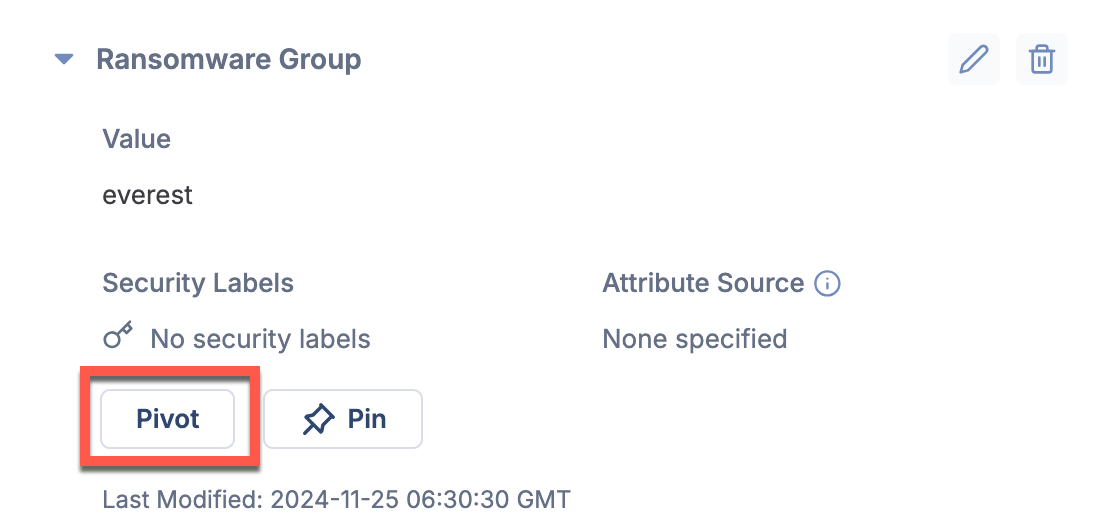
- Click Pivot button to pivot from the Attribute The Browse screen will open and display the following elements:
- A results table with all objects that have a matching Attribute (that is, an Attribute whose type and value match the type and value of the Attribute you pivoted from).
- A gray rectangle containing the type and value of the Attribute you pivoted from. This element will be displayed above the results table.
Legacy Details Screen
Follow these steps to pivot from an Attribute added to an Indicator, Group, or Victim on the legacy Details screen:
- Open the legacy Details screen for an Indicator, Group, or Victim.
- Locate an Attribute with the Pivot
 icon on the Attributes card (Figure 3). This icon will be available for an Attribute if the maximum character length for the Attribute’s type is 500 or less.
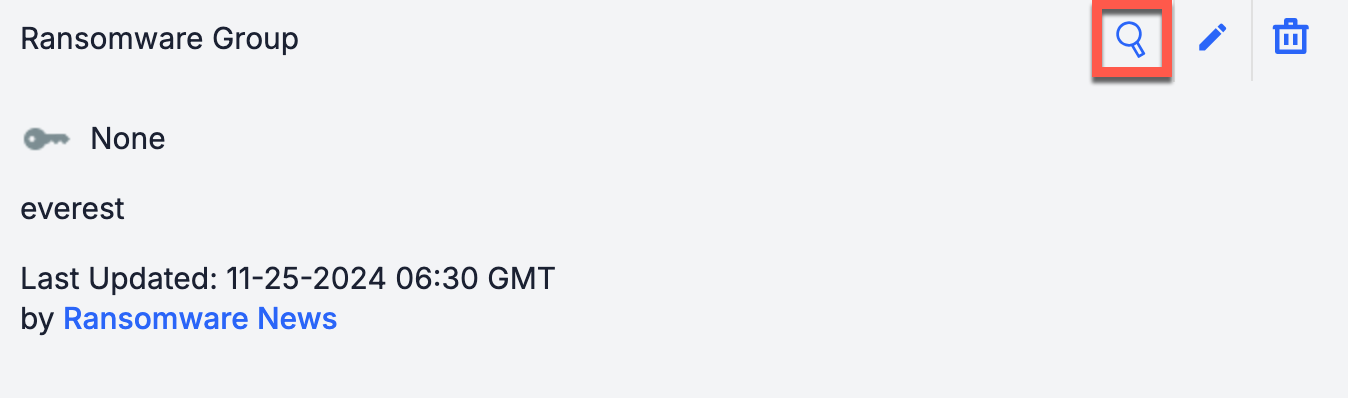
- Click Pivotto pivot from the Attribute. The Browse screen will open and display the following elements:
- A results table with all objects that have a matching Attribute (that is, an Attribute whose type and value match the type and value of the Attribute you pivoted from).
- A gray rectangle containing the type and value of the Attribute you pivoted from. This element will be displayed above the results table
ThreatConnect® is a registered trademark of ThreatConnect, Inc.
20034-01 v.09.E