Overview
You can track and monitor detection and response metrics for Service Level Agreements (SLAs) in Workflow Cases in ThreatConnect®. This feature allows Managed Security Service Providers (MSSPs) and individual organizations alike to track, manage, and improve their threat incident response times.
Each Case has a Detection Due and Response Due date/time field that you can monitor in near real-time when viewing an individual Case or a list of Cases in your Organization. These fields include counters showing the amount of time remaining before detection or response is due, the amount of time it took to detect or respond to the threat, or the amount of time detection or response is overdue by. Due dates are determined based on the severity level of the Case and are tracked down to the minute.
ThreatConnect dashboards provide two ways for you to monitor aggregated SLA detection and response metrics across your Organization:
- View the number of active, met, and overdue SLAs by severity level.
- Build custom query cards that track Mean Time to Detect (MTTD) and Mean Time to Respond (MTTR) for SLAs.
Use Cases
- Track internal incident-response team performance to optimize resource allocation and proactively detect and mitigate areas of concern.
- Define, manage, and prioritize complex and varying customer schedules for incident response in a multitenant environment.
- Monitor SLA metrics to ensure delivery on agreed-upon timelines for threat resolution with MSSP clients and enhance trust, accountability, and service delivery.
Before You Start
User Roles
- To configure the Time to Detect calculation for SLAs on your ThreatConnect instance, your user account must have a System role of Administrator.
- To enable and configure SLA detection and response due dates by severity level for Workflow Cases in your Organization, your user account must have an Organization role of Organization Administrator.
- To view SLA metrics for a Workflow Case, your user account can have any Organization role except App Developer.
- To view SLA metrics in dashboards, your user account can have any Organization role except App Developer.
SLA Metrics
Workflow Cases use four timestamps to track their progress:
- Case Open Time: The date and time that the Case was opened. This timestamp is automatically assigned when the Case is created, but can be changed by a user.
- Time of Occurrence: The date and time that the incident represented by the Case occurred. This timestamp is empty until set by a user.
- Time of Detection: The date and time that the incident represented by the Case was detected. This timestamp is empty until set by a user.
- Case Close Time: The date and time that the Case was closed. This timestamp is automatically assigned when the Case is closed (i.e., the Case’s Status is changed from Open to Closed), but can be changed by a user.
SLA evaluation is based on the following two metrics for security incidents represented as Workflow Cases:
- Time to Detect (TTD): The amount of time it took to detect an incident after it occurs (Time of Detection minus Time of Occurrence) or the amount of time it took to open a Workflow Case after an incident was detected (Case Open Time minus Time of Detection).NoteThe formula used to calculate TTD is determined by your System Administrator.
- Time to Respond (TTR): The amount of time it took to close a Workflow Case for an incident after it was opened (Case Close Time minus Case Open Time).
Configure SLA Metrics
To use SLA metrics for Workflow Cases, you must select a TTD calculation for your ThreatConnect instance. In addition, you must configure SLA detection and response due dates by Case severity level for Organizations using SLAs.
Configure TTD Calculation for SLAs
To accommodate different operational preferences, ThreatConnect provides two options for calculating TTD for SLAs. The timeToDetectionCalculation system setting determines the formula used to calculate TTD.
Follow these steps to define how TTD is calculated for SLAs on your ThreatConnect instance:
- From the Settings
 menu on the top navigation bar, select System Settings.
 - Select All or System from the sidebar.
- Select one of the following options for the timetoDetectionCalculation system setting:
- Time of Detection minus Time of Occurrence: (Default) Measures TTD by calculating the amount of time it took to detect an incident after it occurred.
- Case Open Time minus Time of Detection: Measures TTD by calculating the amount of time it took to open a Case for the incident after it was detected.
- Click SAVE to save the selected TTD calculation option.
Configure SLA Due Dates by Case Severity Level
Follow these steps to enable SLAs and configure SLA detection and response due dates by Case severity level for your Organization:
- From the Settingsmenu on the top navigation bar, select Organization Configuration.
- Select the SLA tab.
- Select your Organization in the dropdown in the Organization Config screen’s header.
- Configure the fields in the Service Level Agreement (SLA) Settings screen (Figure 1) as follows:
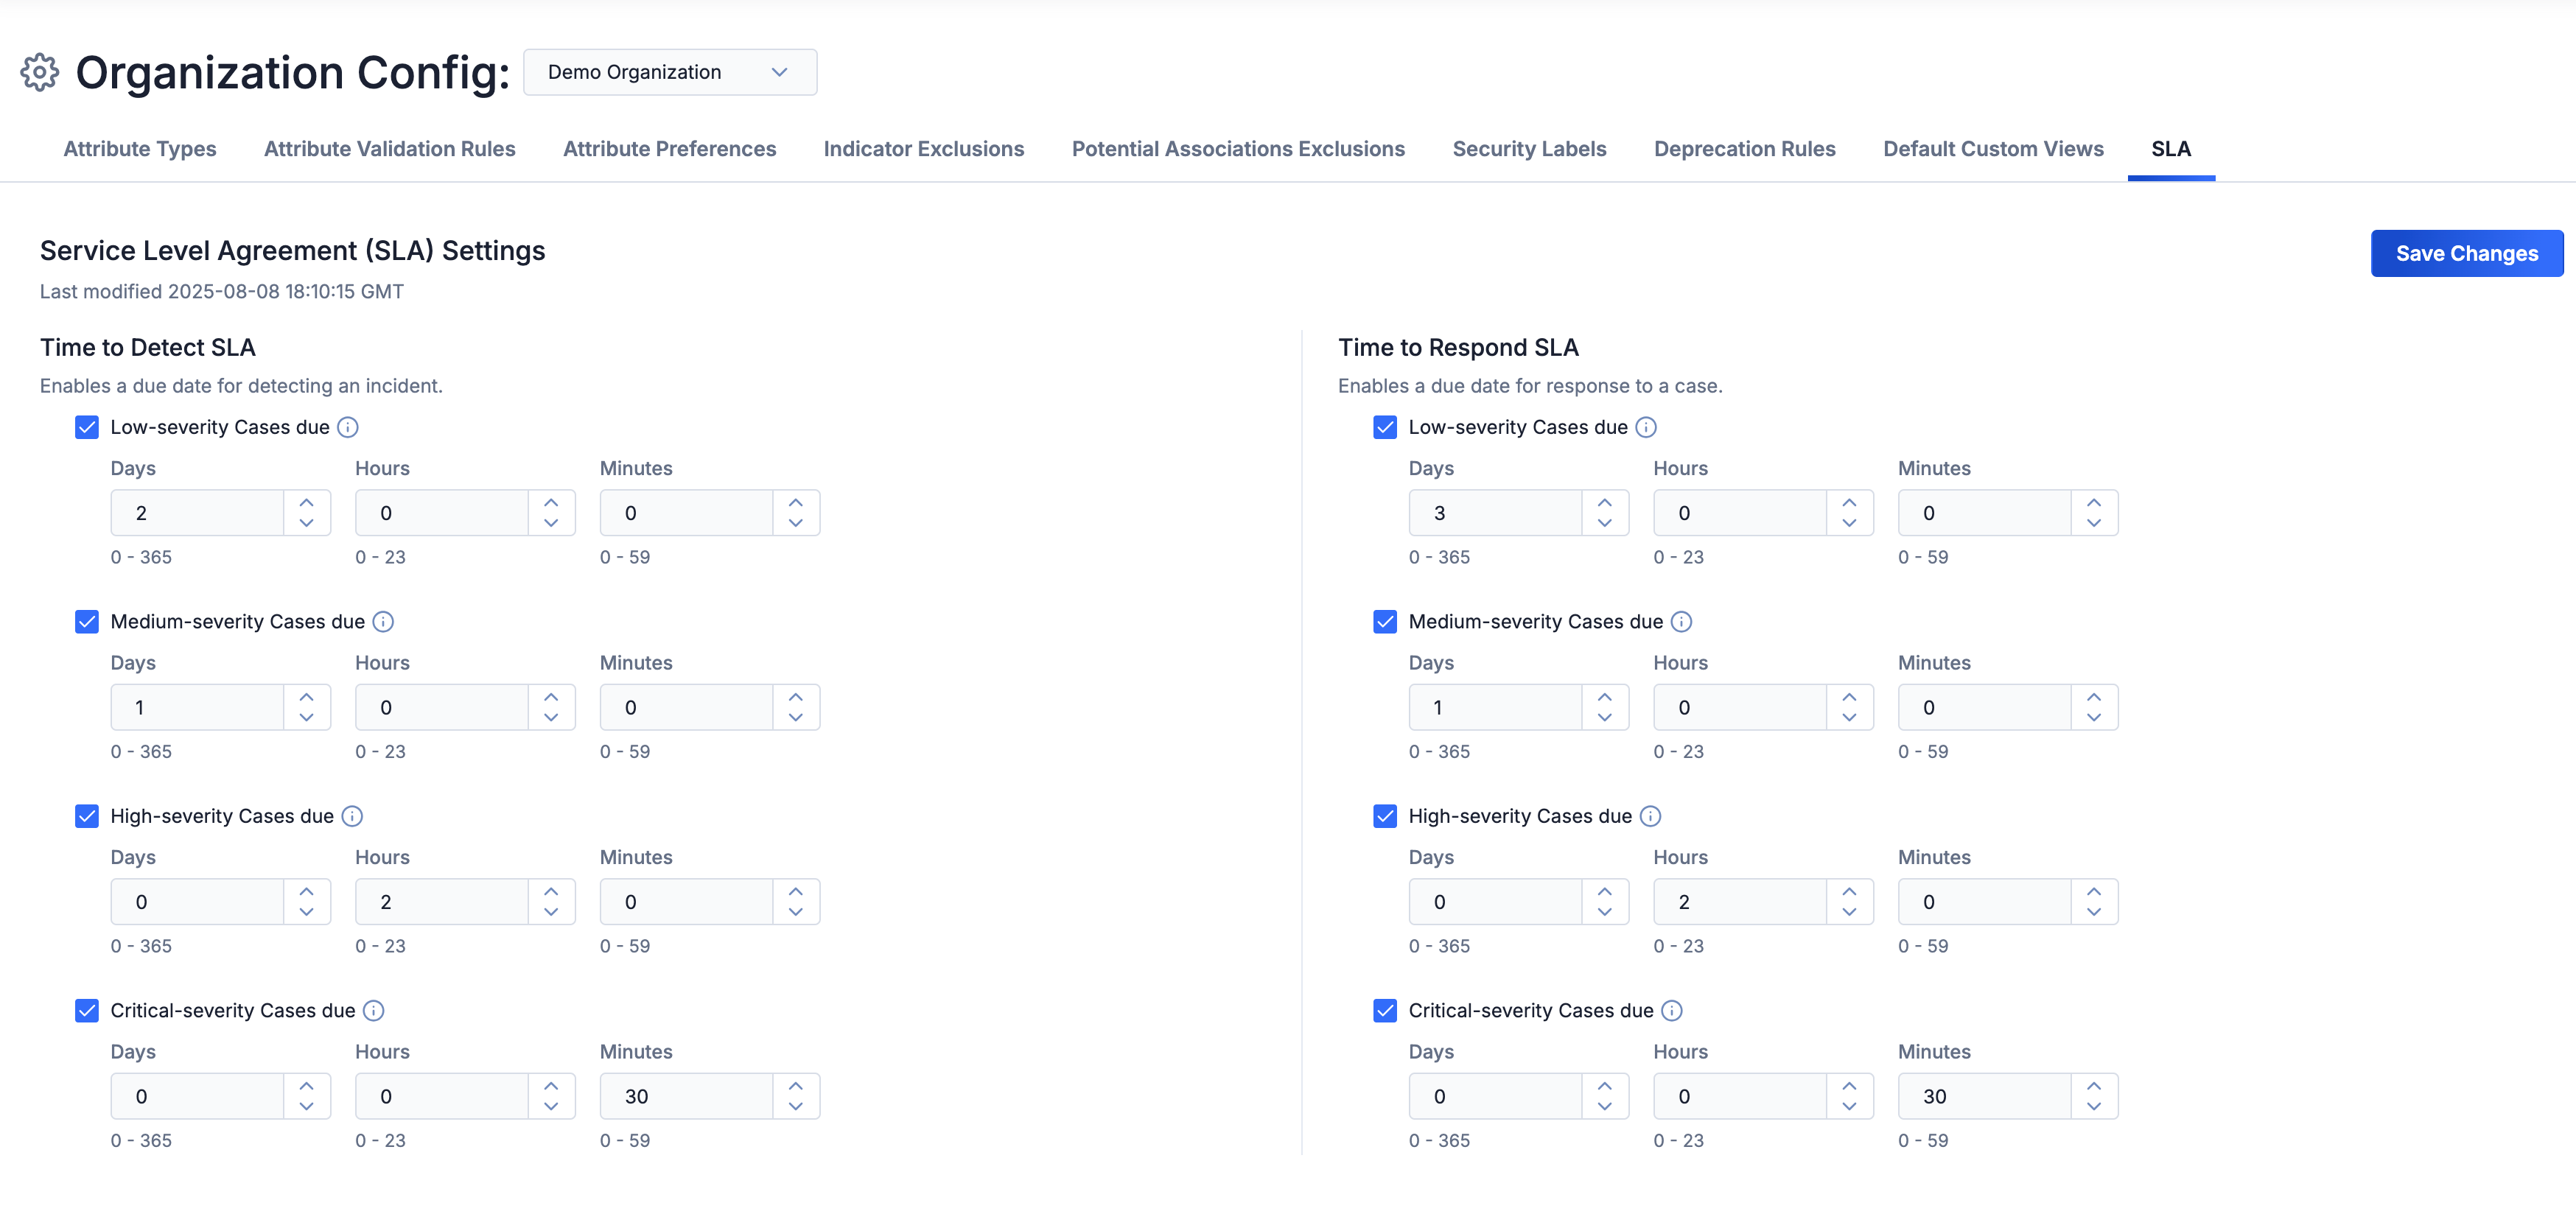
- Time to Detect SLA: Select the checkbox for each Case severity level for which you want to enable detection due dates. Then set the detection due date for that severity level.ExampleIn Figure 1, low-severity Cases have a 2-day window that can elapse between the time the incident occurs and the time the incident is detected or the time the incident is detected and the time the Case is opened (depending on the configured TTD calculation), after which they are overdue.
- Time to Respond SLA: Select the checkbox for each Case severity level for which you want to enable response due dates. Then set the response due date for that severity level.ExampleIn Figure 1, low-severity Cases have a 3-day window that can elapse between the time the Case is opened and the time the Case is closed, after which they are overdue.
- Click Save Changes to save the SLA configuration.
View SLA Metrics
SLA metrics can be viewed in the following areas of ThreatConnect:
Case Details Card
The Case Details card for a Workflow Case provides the Case’s Detection Due and Response Due dates and near-real-time counters relating to these dates. You can use these insights to quickly determine whether the Case is on track, approaching a deadline, or overdue.
Detection Due
The Detection Due date is the date/time by which the incident represented by the Case must be detected according to its SLA and the TTD calculation configured for your ThreatConnect instance:
- TTD = Time of Detection minus Time of Occurrence: The Detection Due date is calculated by starting at the Case’s Time of Occurrence and allowing the number of days, hours, and minutes configured for the Time to Detect SLA for the Case’s severity level until the Case’s Time of Detection.ExampleIf medium-severity Cases have a Time to Detect SLA of 2 days, 2 hours, and 2 minutes, then a medium-severity Case that occurred at 2025-06-01 07:00:00 would need to be detected by 2025-06-03 09:02:00 to meet its SLA schedule for detection.
- TTD = Case Open Time minus Time of Detection: The Detection Due date is calculated by starting at the Case’s Time of Detection and allowing the number of days, hours, and minutes configured for the Time to Detect SLA for the Case’s severity level until the Case Open Time.ExampleIf medium-severity Cases have a Time to Detect SLA of 2 days, 2 hours, and 2 minutes, then a medium-severity Case that was detected at 2025-06-01 07:00:00 would need to be opened by 2025-06-03 09:02:00 to meet its SLA schedule for detection.NoteDetection Due is displayed on the Case Details card only for Cases that have a Time to Detect SLA configured for their severity level.
In addition to the due date for detection, the Detection Due field provides one of the following counters:
- Due in: The amount of time left before the Detection Due date. This counter is shown if the Time to Detect SLA is not met and the Detection Due date has not passed.
- Detected in: The amount of time it took to detect the incident represented by the Case (i.e., the TTD). This counter is shown if the Time to Detect SLA is met before the Detection Due date.
- Overdue by: If the Case is not detected according to your ThreatConnect instance’s TTD definition, then Overdue by shows the amount of time that has passed since the Detection Due date. If the Case is detected according to your ThreatConnect instance’s TTD definition, but the detection occurred after the Detection Due date, then Overdue by shows the amount of time elapsed between the Detection Due date and the date/time the Case was detected (Time of Detection or Case Open Time, depending on your instance’s TTD definition).
Response Due
The Response Due date is the date/time by which the incident represented by the Case must be responded to according to its SLA. The Response Due date is calculated by starting at the Case Open Time and allowing the number of days, hours, and minutes configured for the Time to Respond SLA for the Case’s severity level until the Case Close Time.
In addition to the due date for response, the Response Due field provides one of the following counters:
- Due in: The amount of time left before the Response Due date. This counter is shown if the Time to Respond SLA is not met and the Response Due date did not pass.
- Responded in: The amount of time it took to respond to the incident represented by the Case (i.e., the TTR). This counter is shown if the Time to Respond SLA is met before the Response Due date.
- Overdue by: If the Case is not closed, then Overdue by shows the amount of time that has passed since the Response Due date. If the Case is closed, but the Case Close Time was after the Response Due date, then Overdue by shows the amount of time elapsed between the Response Due date and the Case Close Time.
The Cases Screen
You can view the Detection Due and Response Due dates and counters on the Cases screen in list and grid view. If you do not see them in list view, use the column selector to add them (Figure 2).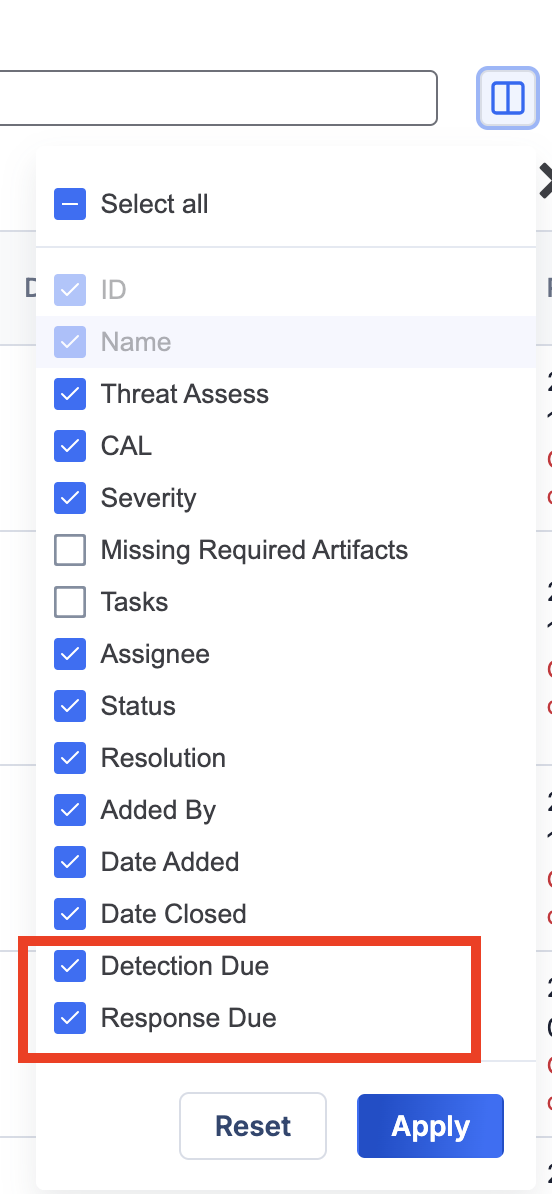
Track SLAs Statistics
You can configure SLA queries in dashboards and reporting to track and monitor performance in the following ways:
- Track TTD and TTR adherence by Case severity level in Metrics cards.
- Track SLA statistics such as Mean Time to Detect (MTTD) and Mean Time to Respond (MTTR) in Query cards and reporting query charts.
SLA Metrics Cards
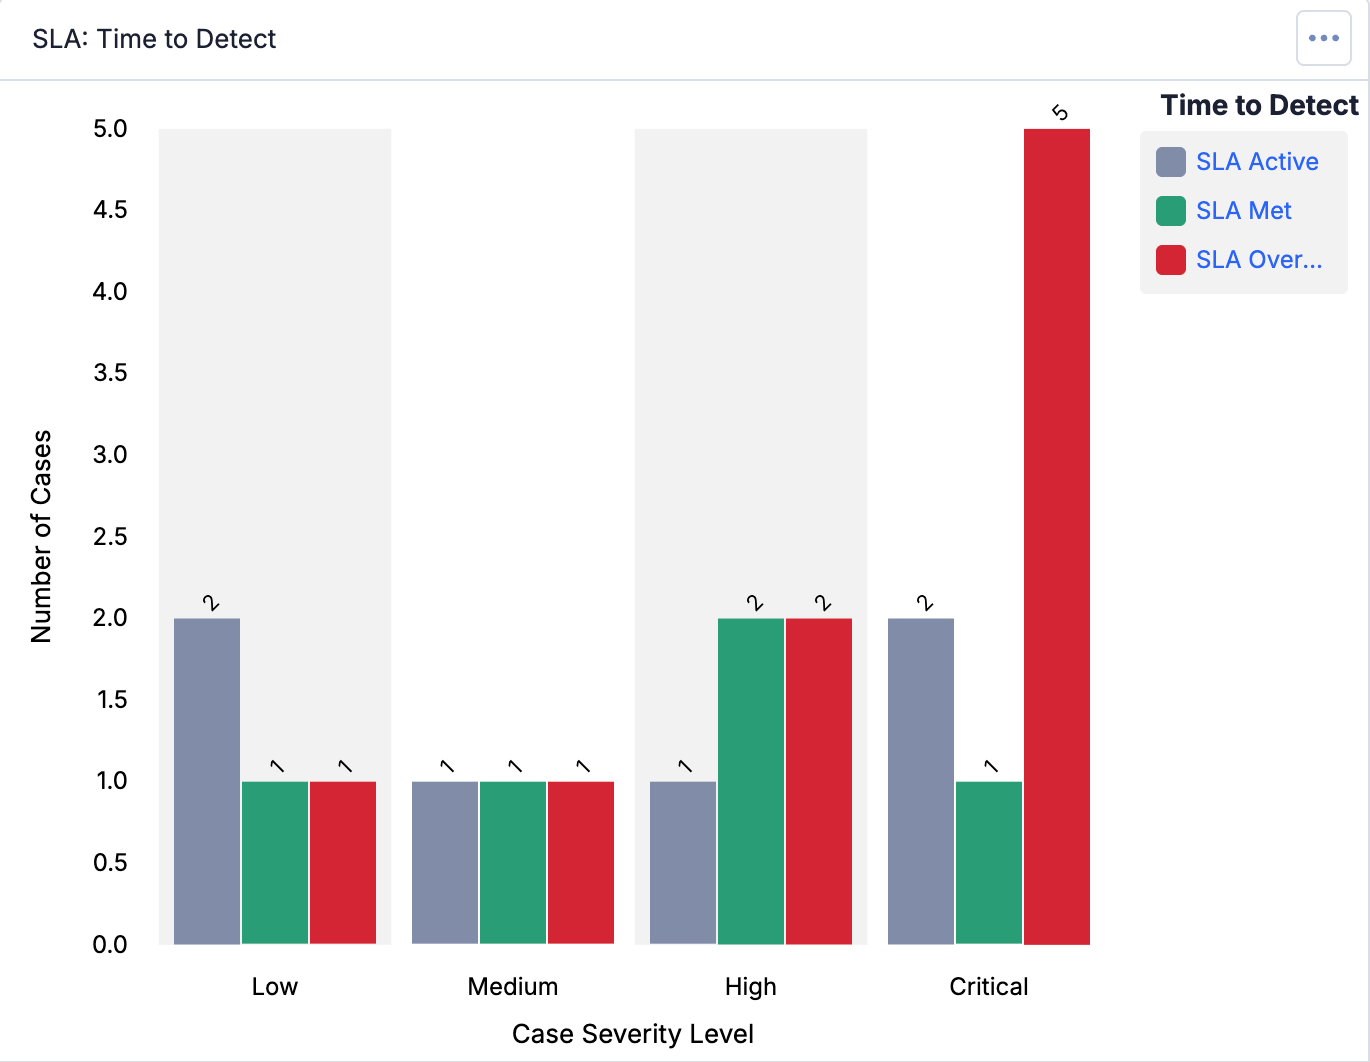
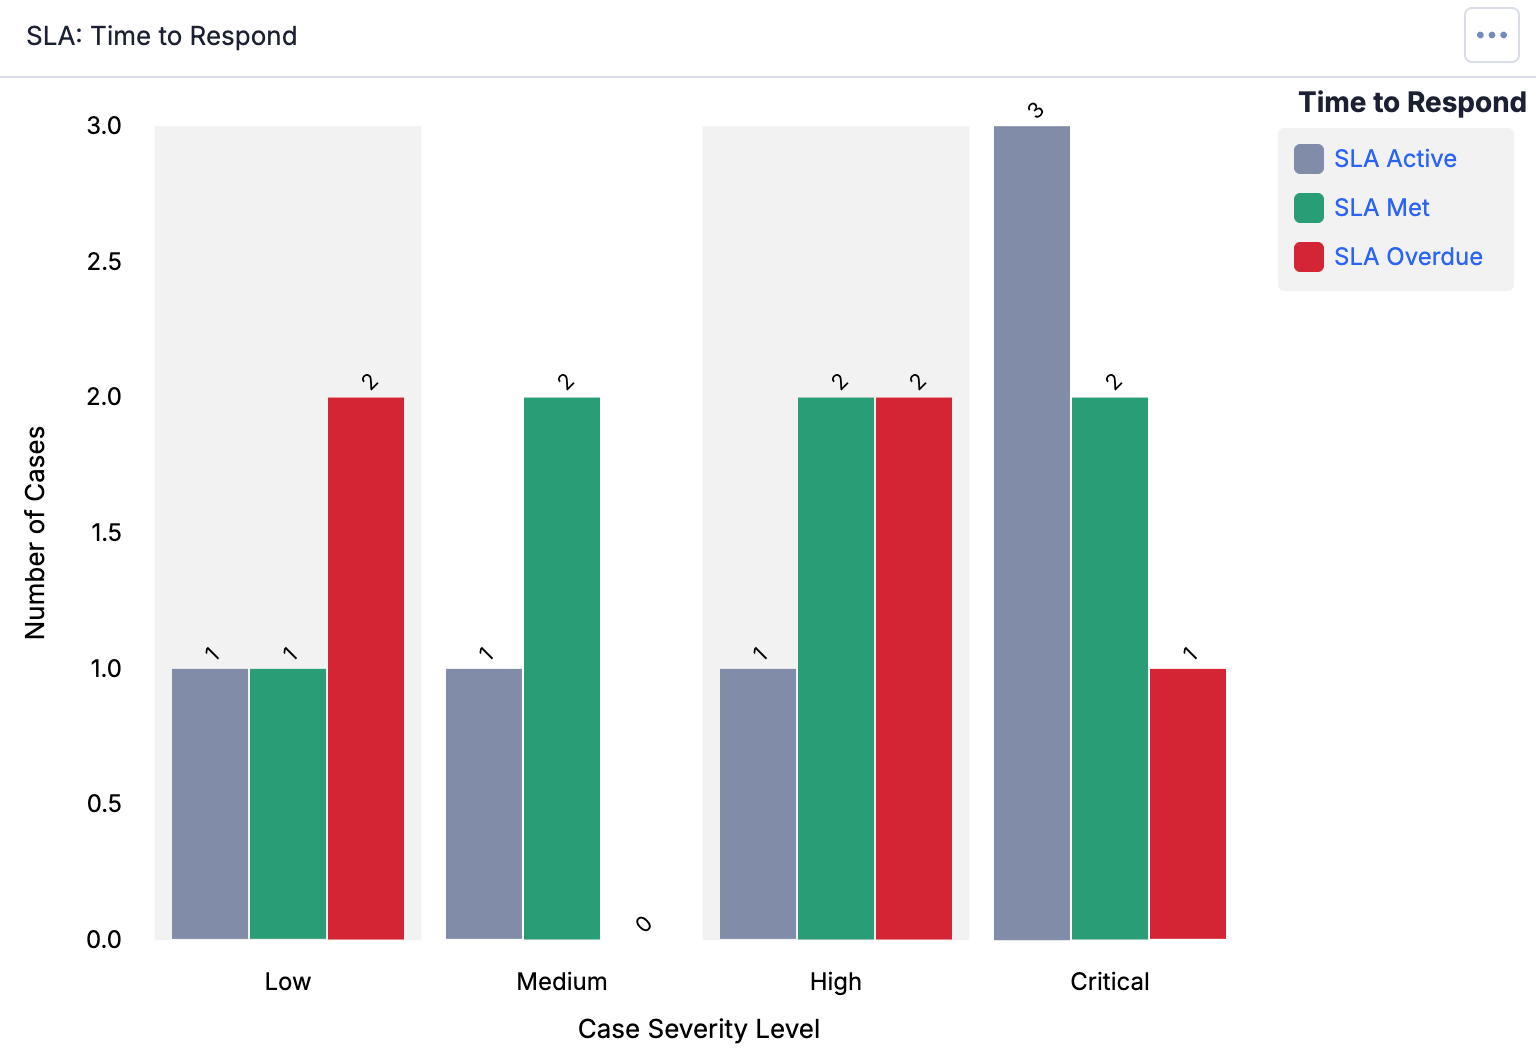
The SLA: Time to Detect (Figure 3) and SLA: Time to Respond (Figure 4) Metrics cards show the number of Workflow Cases of each severity level that are active, met, or overdue for detection or response, respectively, over the date range selected in the card’s configuration. You can find the SLA: Time to Detect and SLA: Time to Respond cards under the Cases heading when adding a Metrics card to a dashboard.
Query SLA Statistics
You can configure Query cards and and reporting query charts to track Mean Time to Detect (MTTD) and Mean Time to Response (MTTR) for your SLAs across severity levels, as well as statistics such as the shortest and longest detection and response times in each severity level. This information helps you understand how fast incidents are detected, identify areas where response times are lagging, and evaluate the best and worst outcomes for your SLAs in each severity level.
When creating a new query card or chart, use the following selections to display SLA statistics:
- Query By: Select Cases.
- Group By or Categorize By: Select Severity.
- Aggregate: The option you select determines the type of data that is displayed on the card:NoteThe COUNT option displays only a Case Count for each severity level. It does not apply to SLA statistics.
- AVG: Display the MTTD or MTTR for each severity level, depending on the selected Target.
- MIN: Display the lowest detection or response time for each severity level, depending on the selected Target.
- MAX: Display the highest detection or response time for each severity level, depending on the selected Target.
- SUM: Display the total detection or response time for all Cases in each severity level, depending on the selected Target.
- Target: Select Time to Detect or Time to Respond.
- Units: Select the unit of time for the data.
ThreatConnect® is a registered trademark of ThreatConnect, Inc.
20175-01 v.01.C