Overview
Users on Cloud and Dedicated Cloud instances of ThreatConnect® can access one or more of the following built-in dashboards from the Dashboard menu:
- My Dashboard (available on Cloud and Dedicated Cloud instances)
- OSINT Overview (available on Cloud instances only)
- Operations Dashboard (available on Cloud instances only)
- Source Analysis (available on Cloud instances only)
These pre-configured dashboards let you quickly visualize and analyze key data points in your ThreatConnect instance.
Before You Start
User Roles
- To access built-in dashboards on a Cloud or Dedicated Cloud instance of ThreatConnect, your user account on either instance type can have any Organization role.
Choosing and Configuring a Dashboard
Opening a Built-in Dashboard
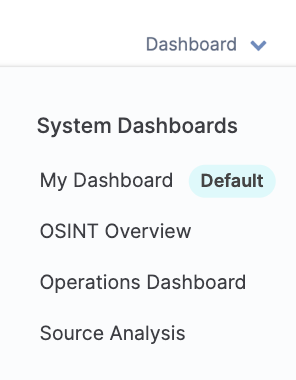
To open a built-in dashboard on a Cloud or Dedicated Cloud instance of ThreatConnect, hover over Dashboard on the top navigation bar and select a built-in dashboard under System Dashboards (Figure 1).
While a built-in dashboard is open, you can view the dashboard’s name in the dashboard header. You can also access the My Intel Sources selector and ⋮ menu for dashboard administration from the dashboard header.
Available Built-in Dashboards
Cloud instances have access to four built-in dashboards: My Dashboard, OSINT Overview, Operations Dashboard, and Source Analysis. Dedicated Cloud instances have access to only My Dashboard.
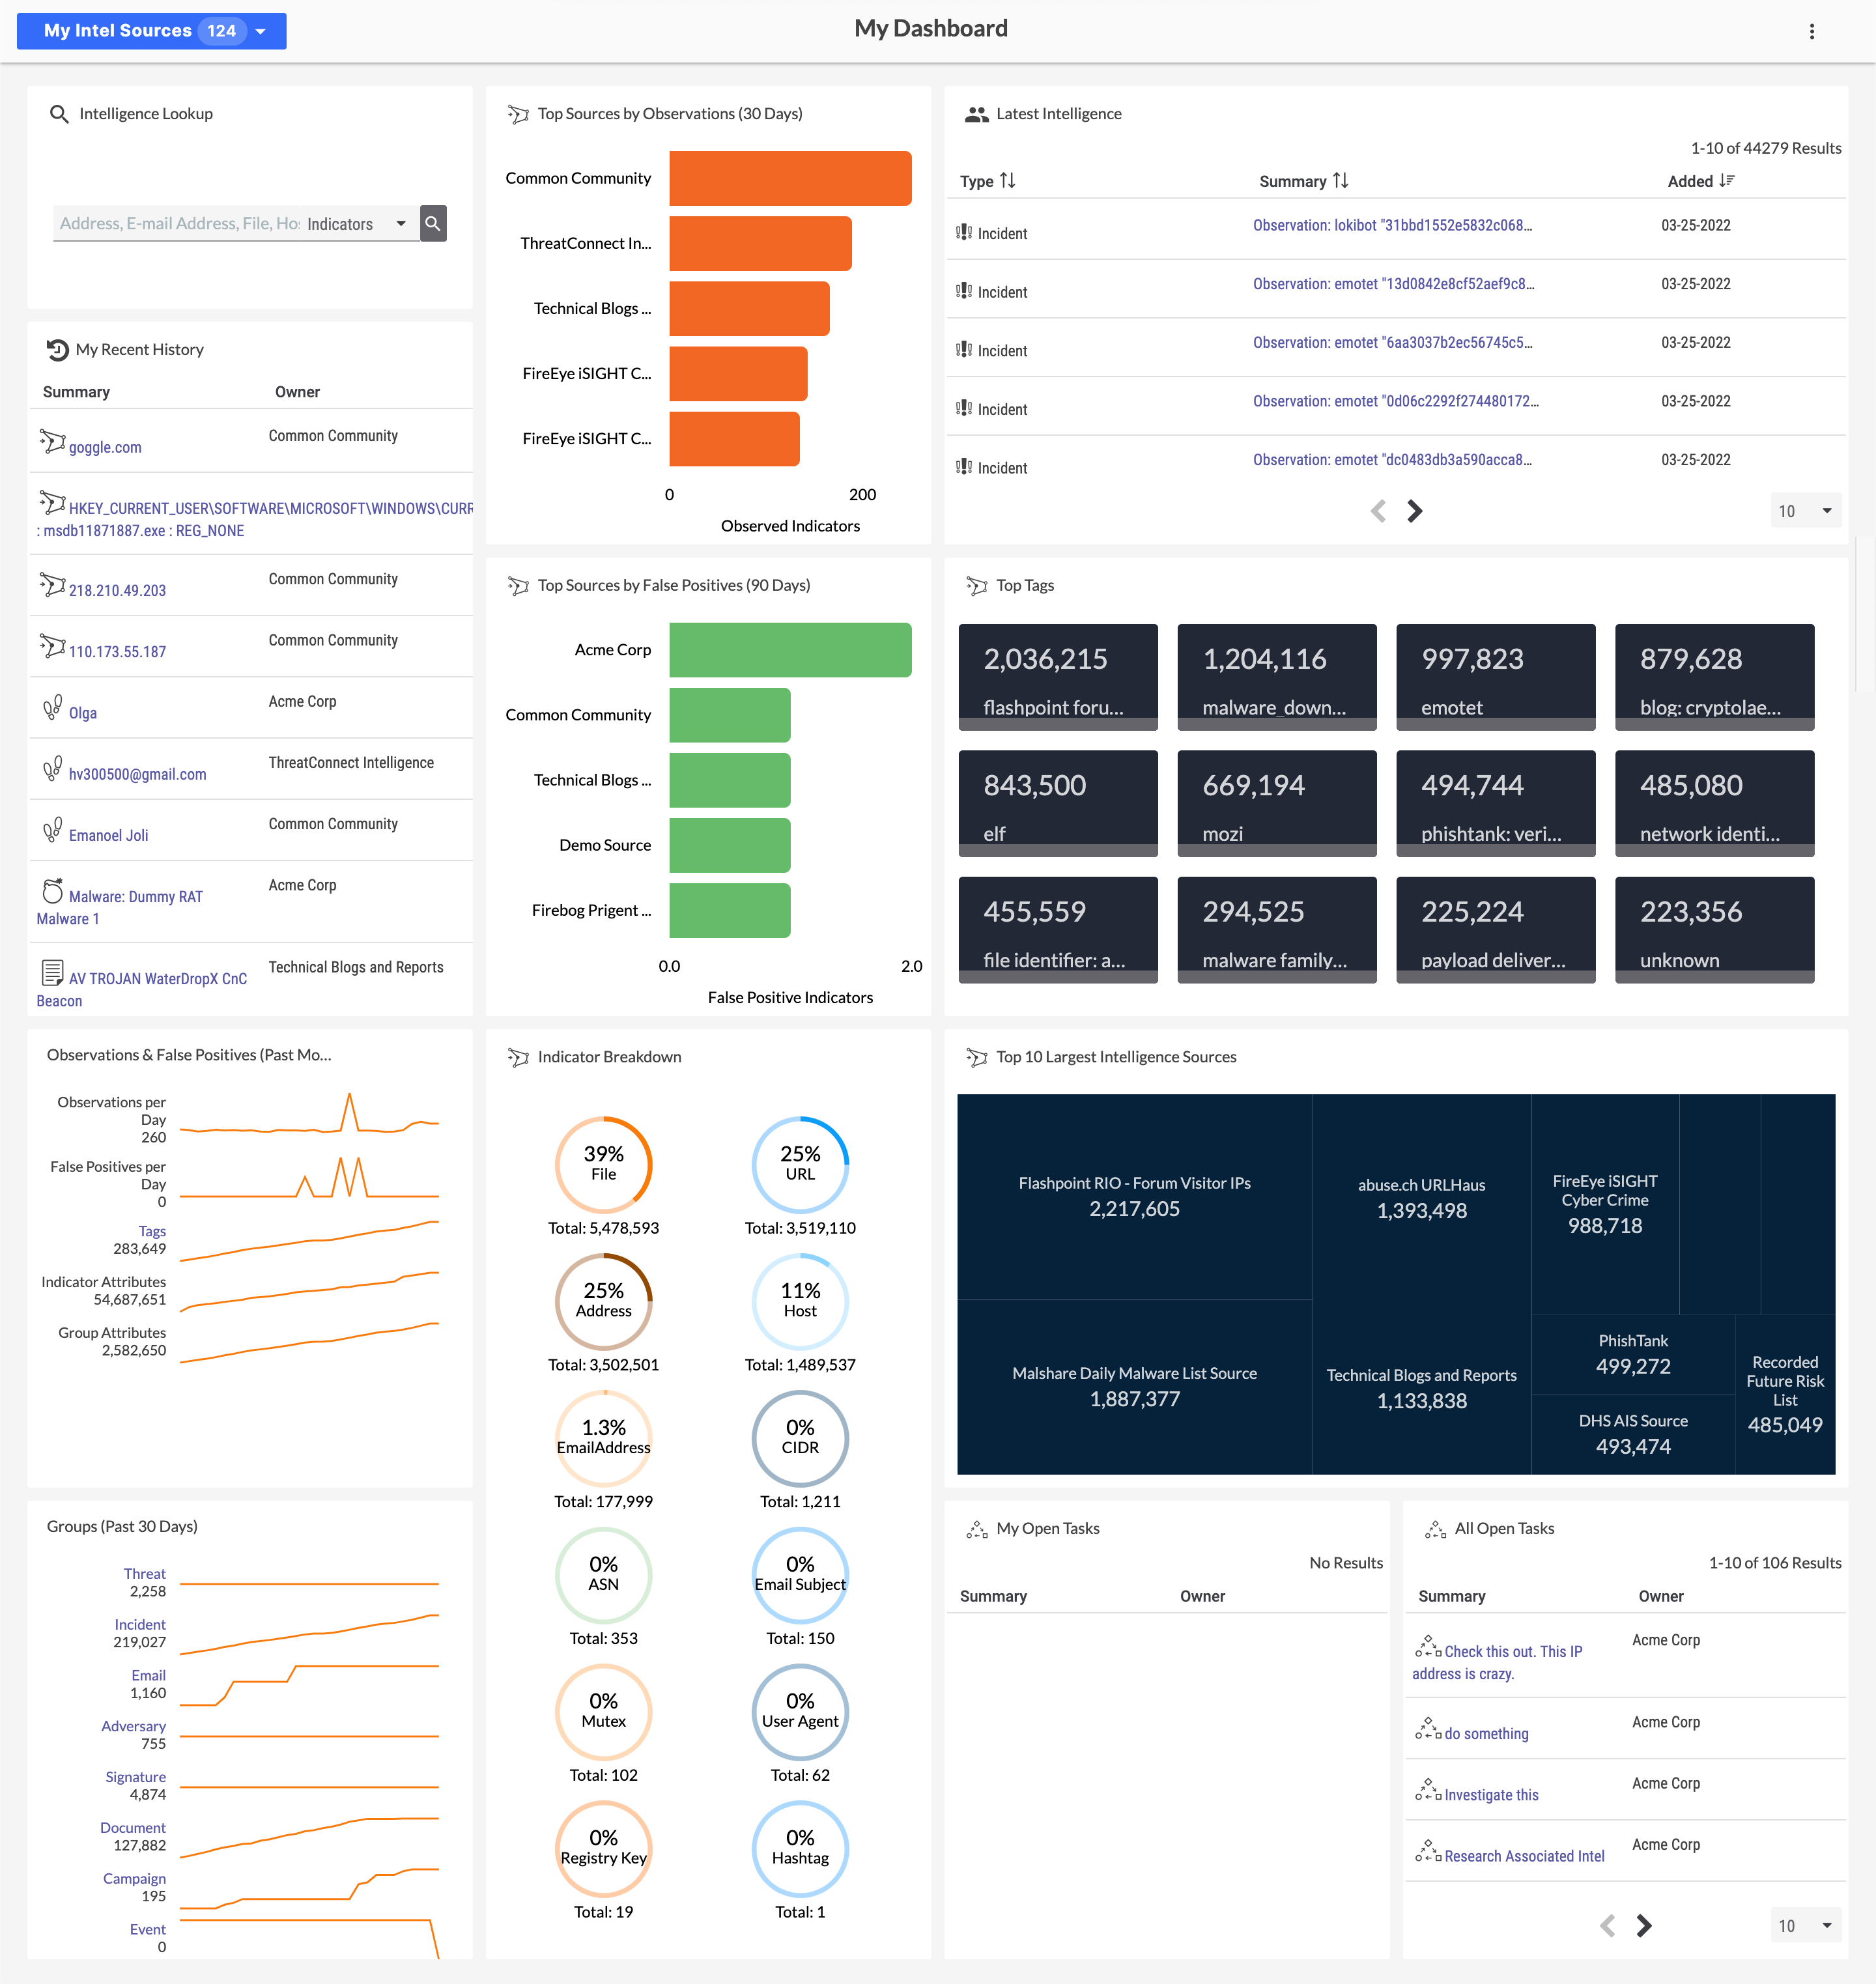
My Dashboard
My Dashboard (Figure 2) provides a general overview of your data in ThreatConnect, including recently viewed items, top Sources by observation and false positives, Indicator breakdown, latest intelligence, and top Tags.
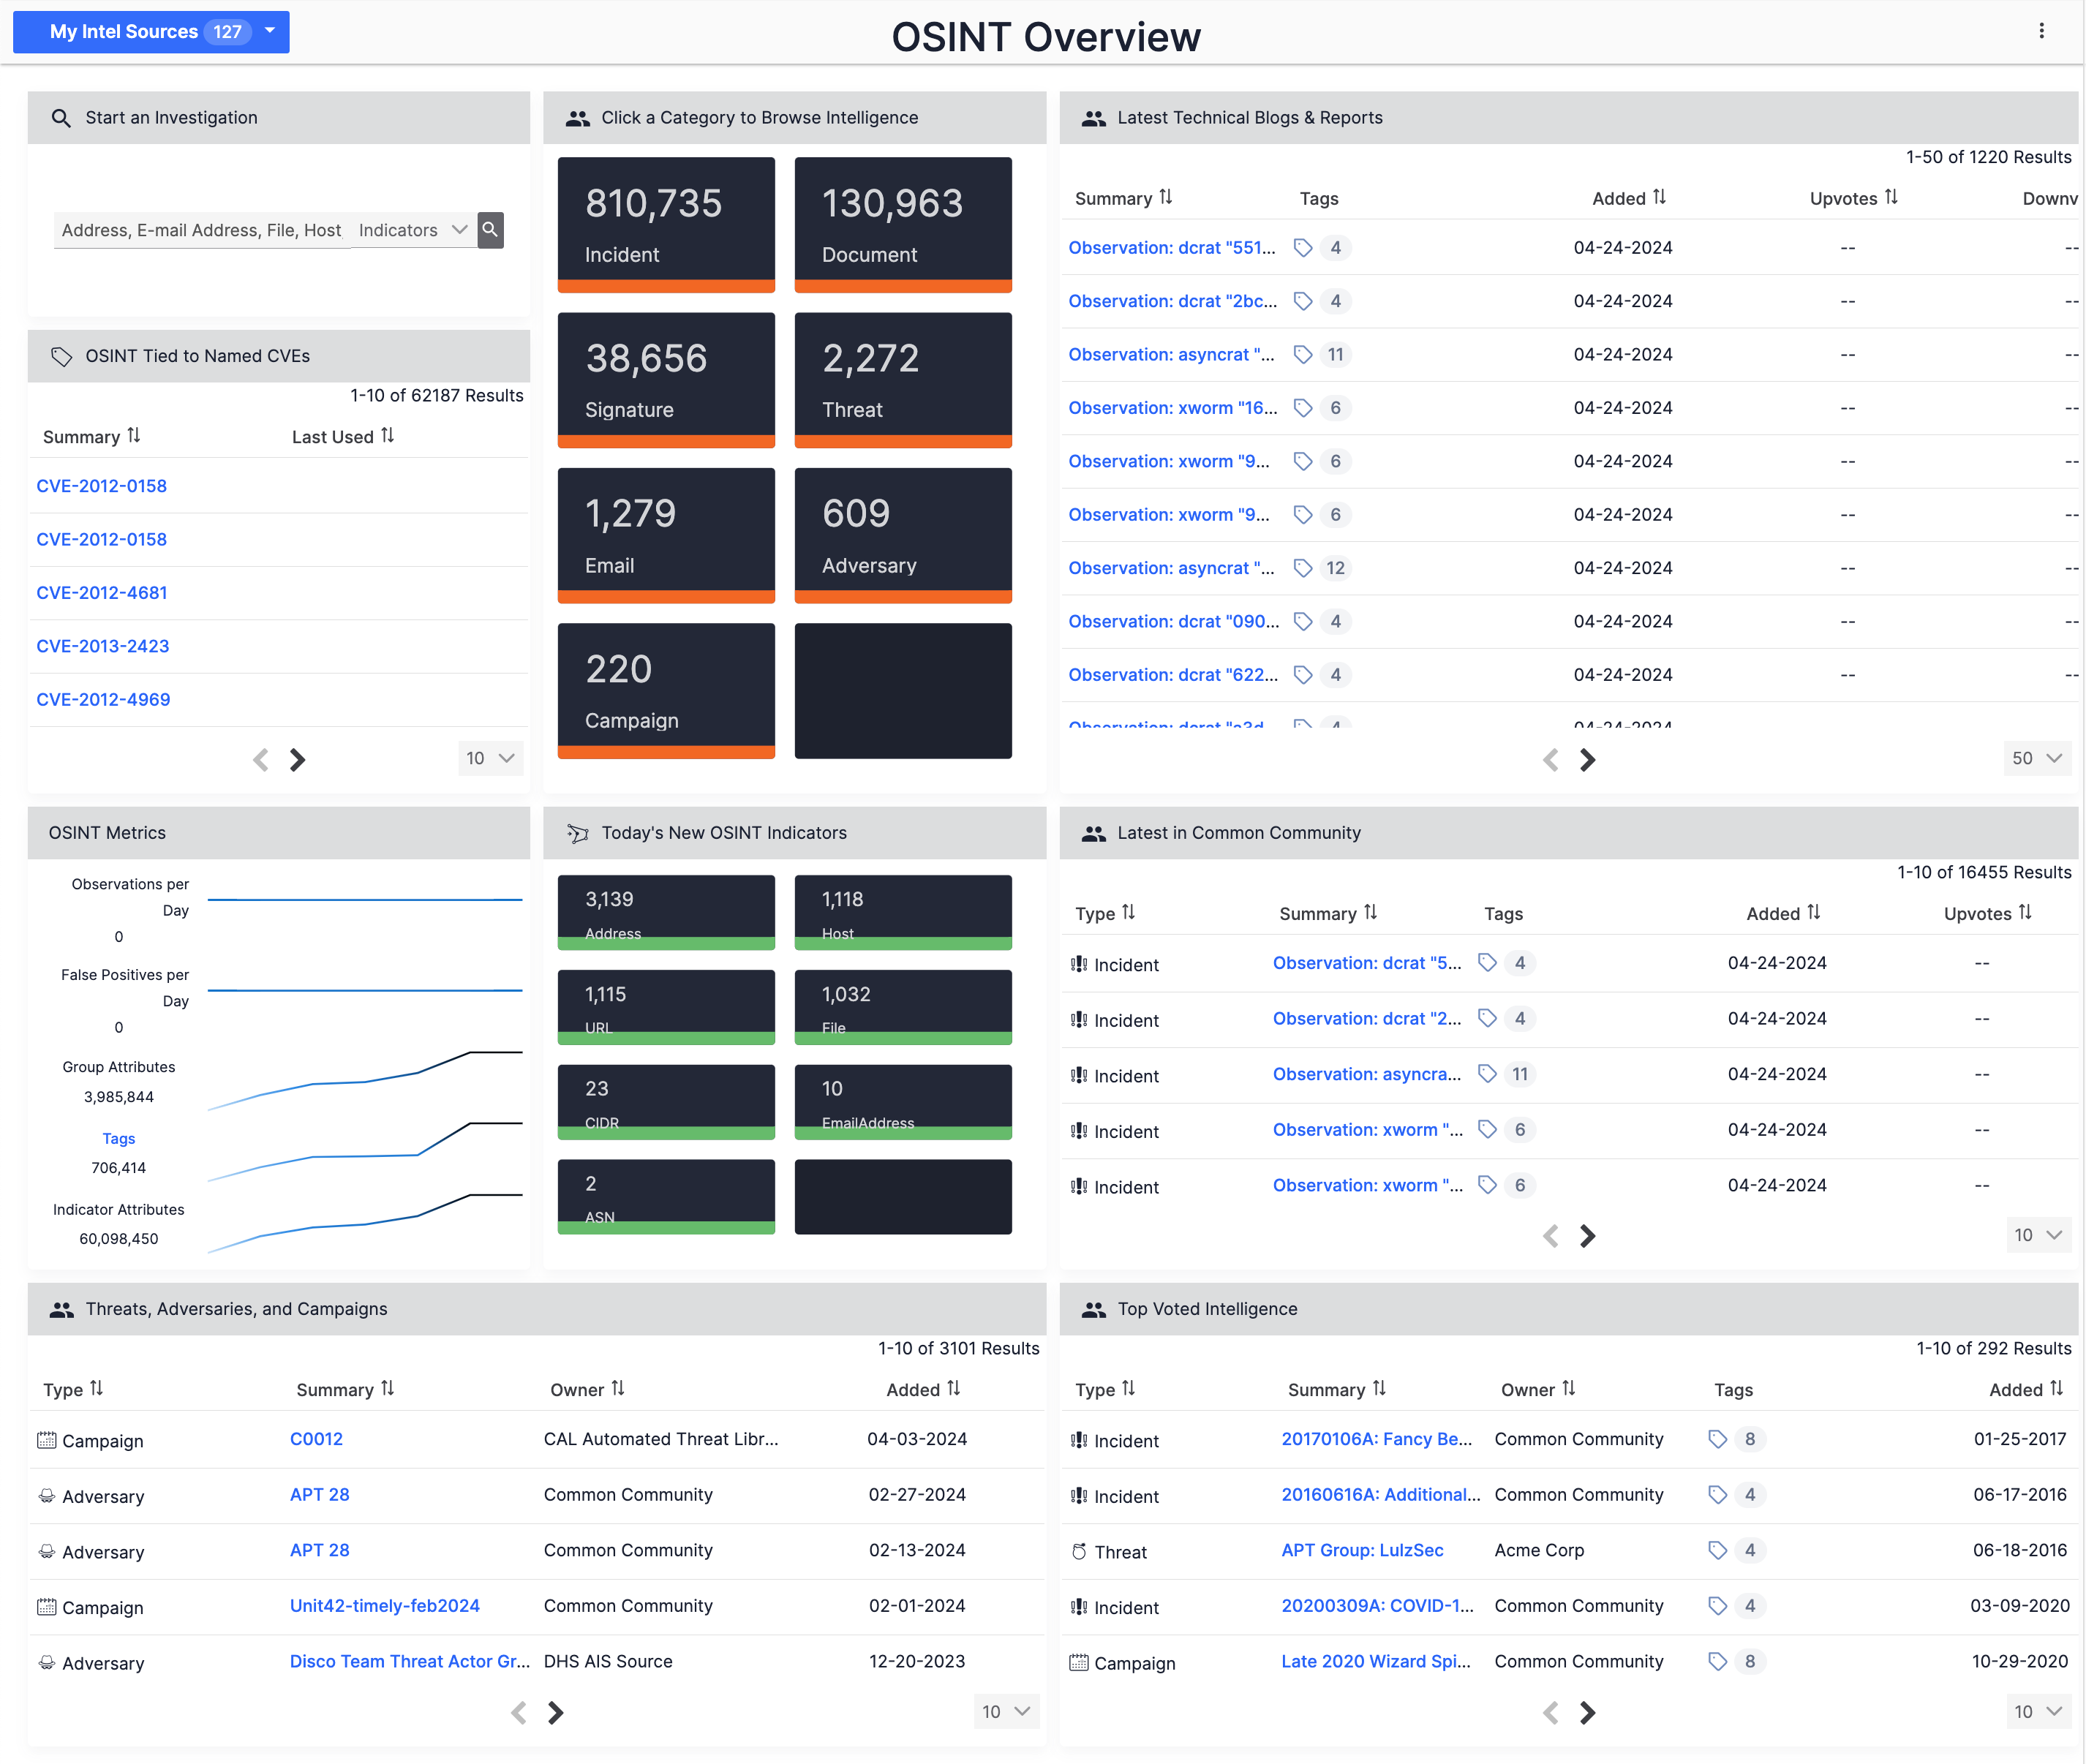
OSINT Overview Dashboard
OSINT Overview (Figure 3) provides a starting point for exploring context-rich sources in ThreatConnect, focusing on Groups rather than Indicators. This dashboard highlights the most recent Incidents in the Common Community and provides a variety of metrics related to open-source intelligence (OSINT). Different Groups may be explored by navigating from this dashboard to the Browse screen or by searching for intelligence based on Common Vulnerabilities and Exposures (CVE®) data.
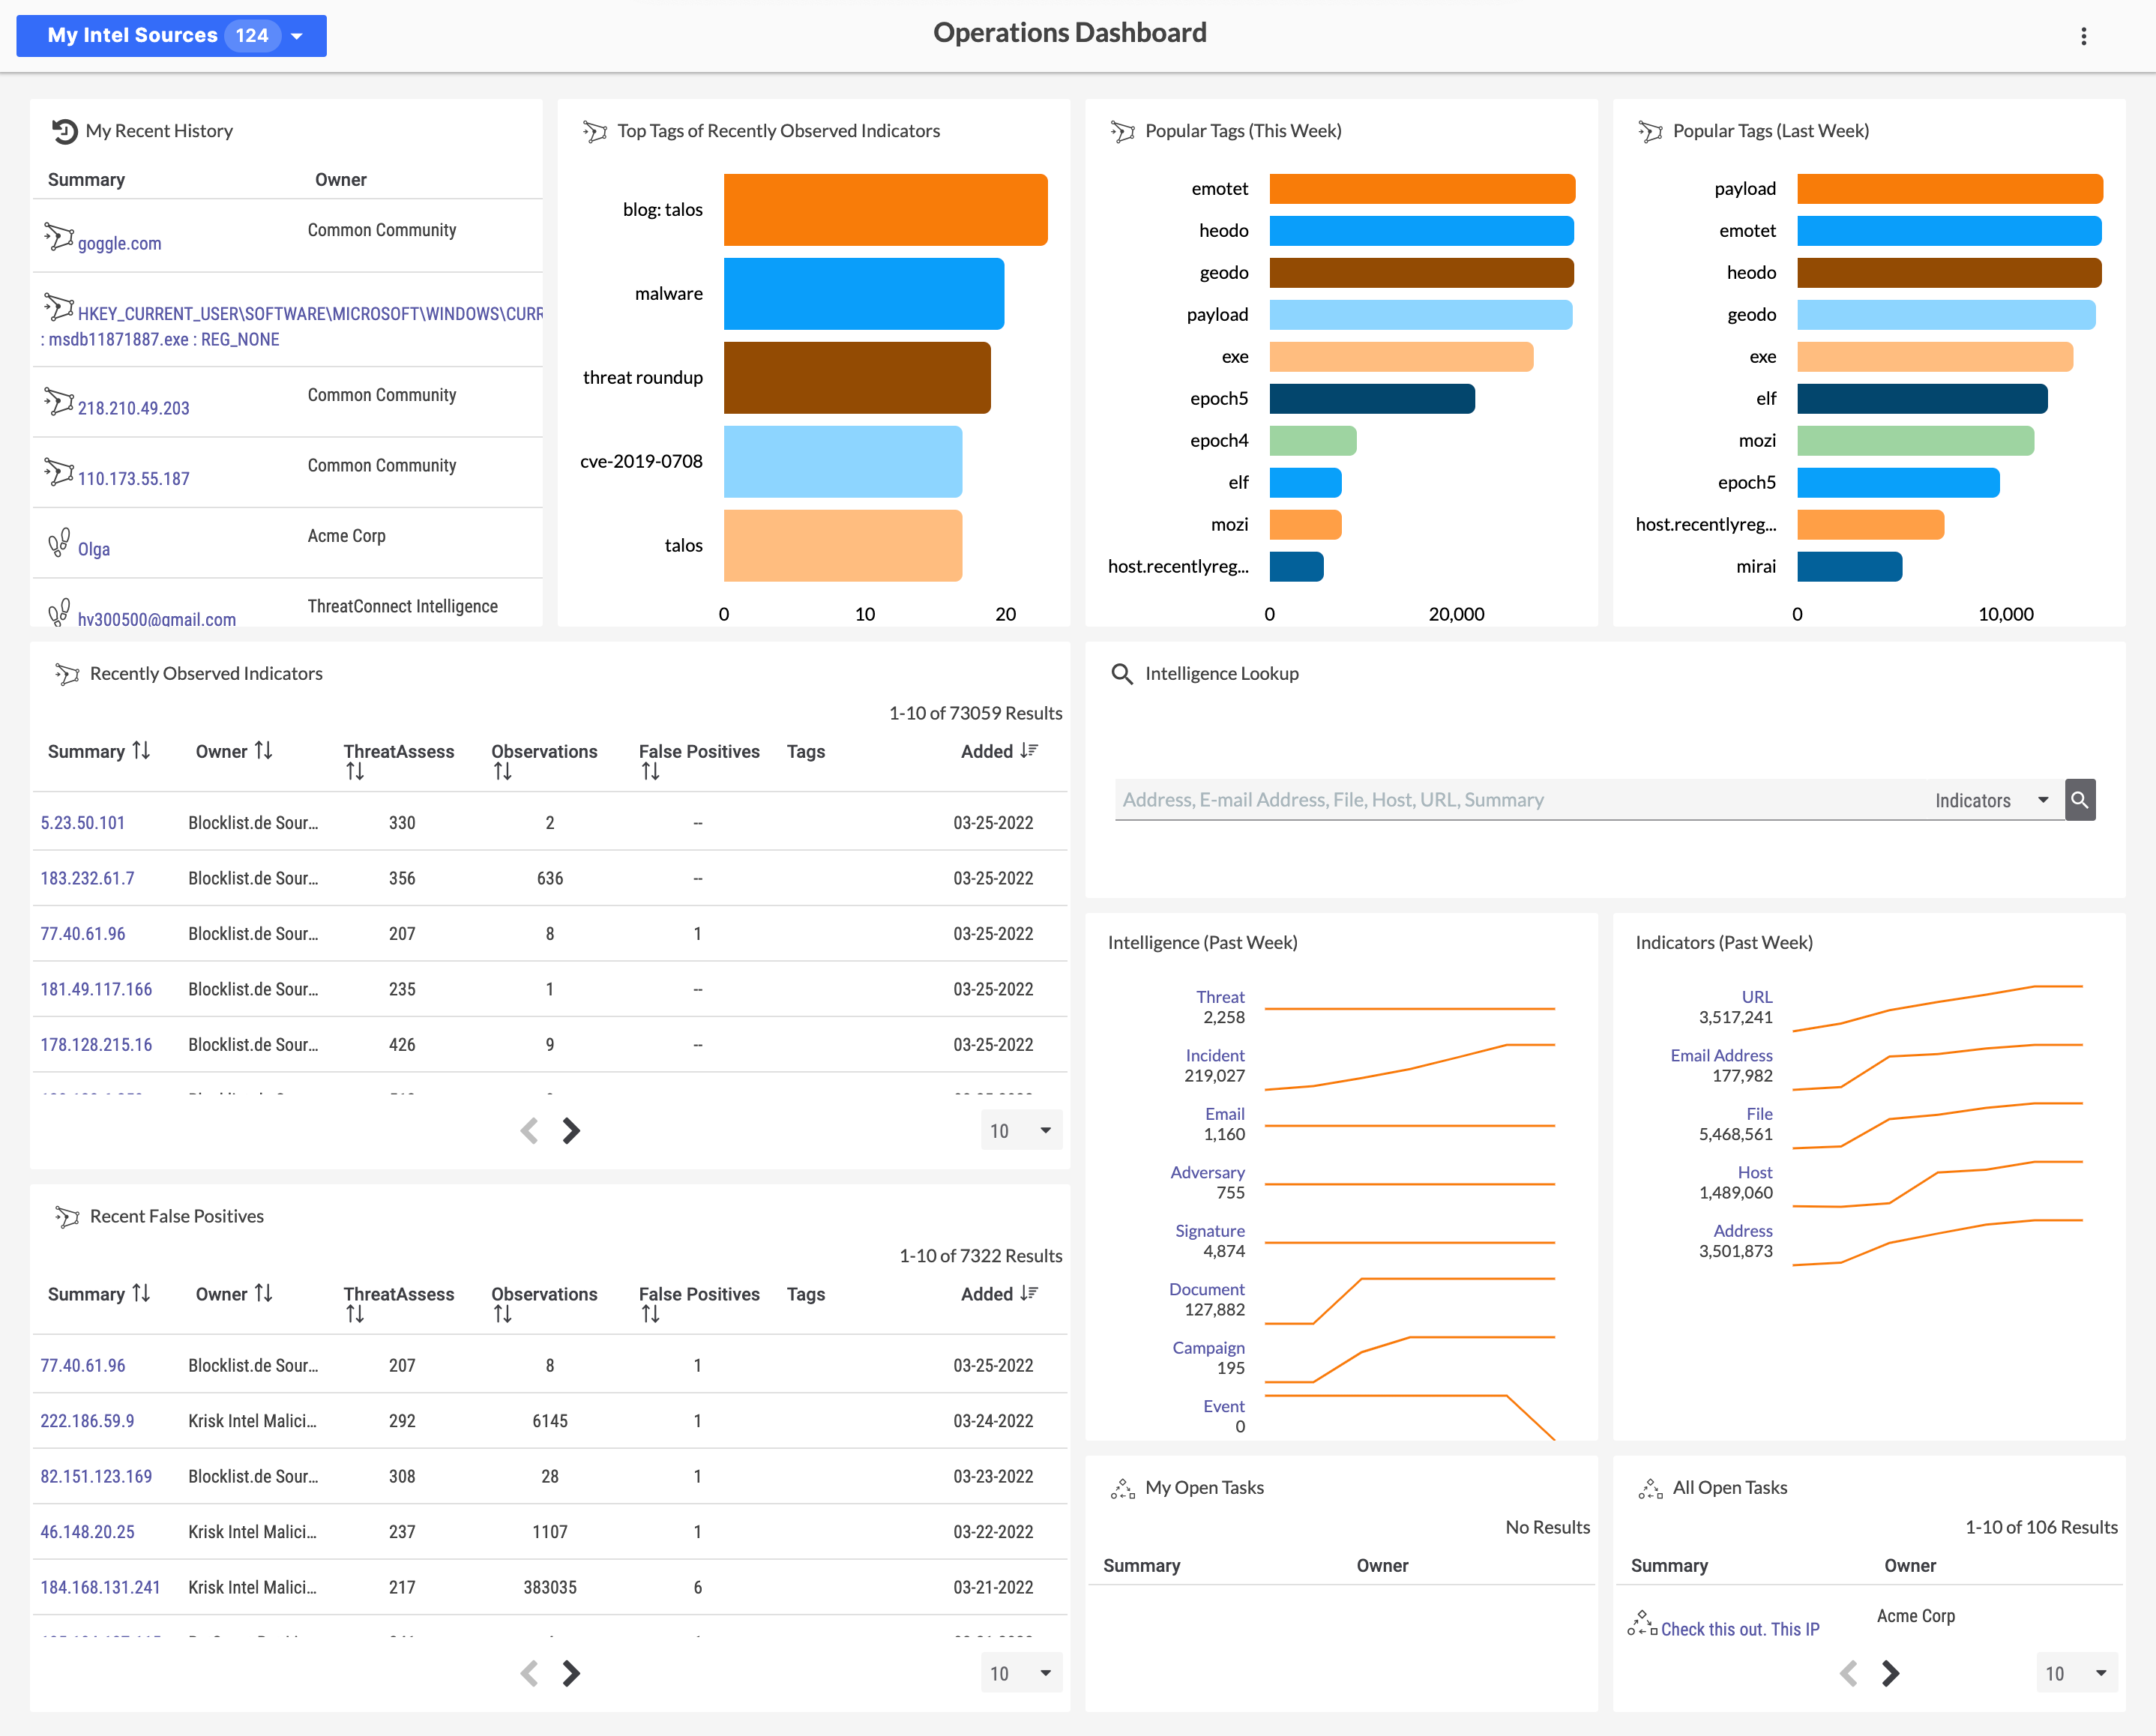
Operations Dashboard
Operations Dashboard (Figure 4) highlights new and trending information over the past week, including recently viewed items, recently observed Indicators, recently marked false positives, popular Tags (this week vs. last week), and trends in numbers of Groups and Indicators added over the past week.
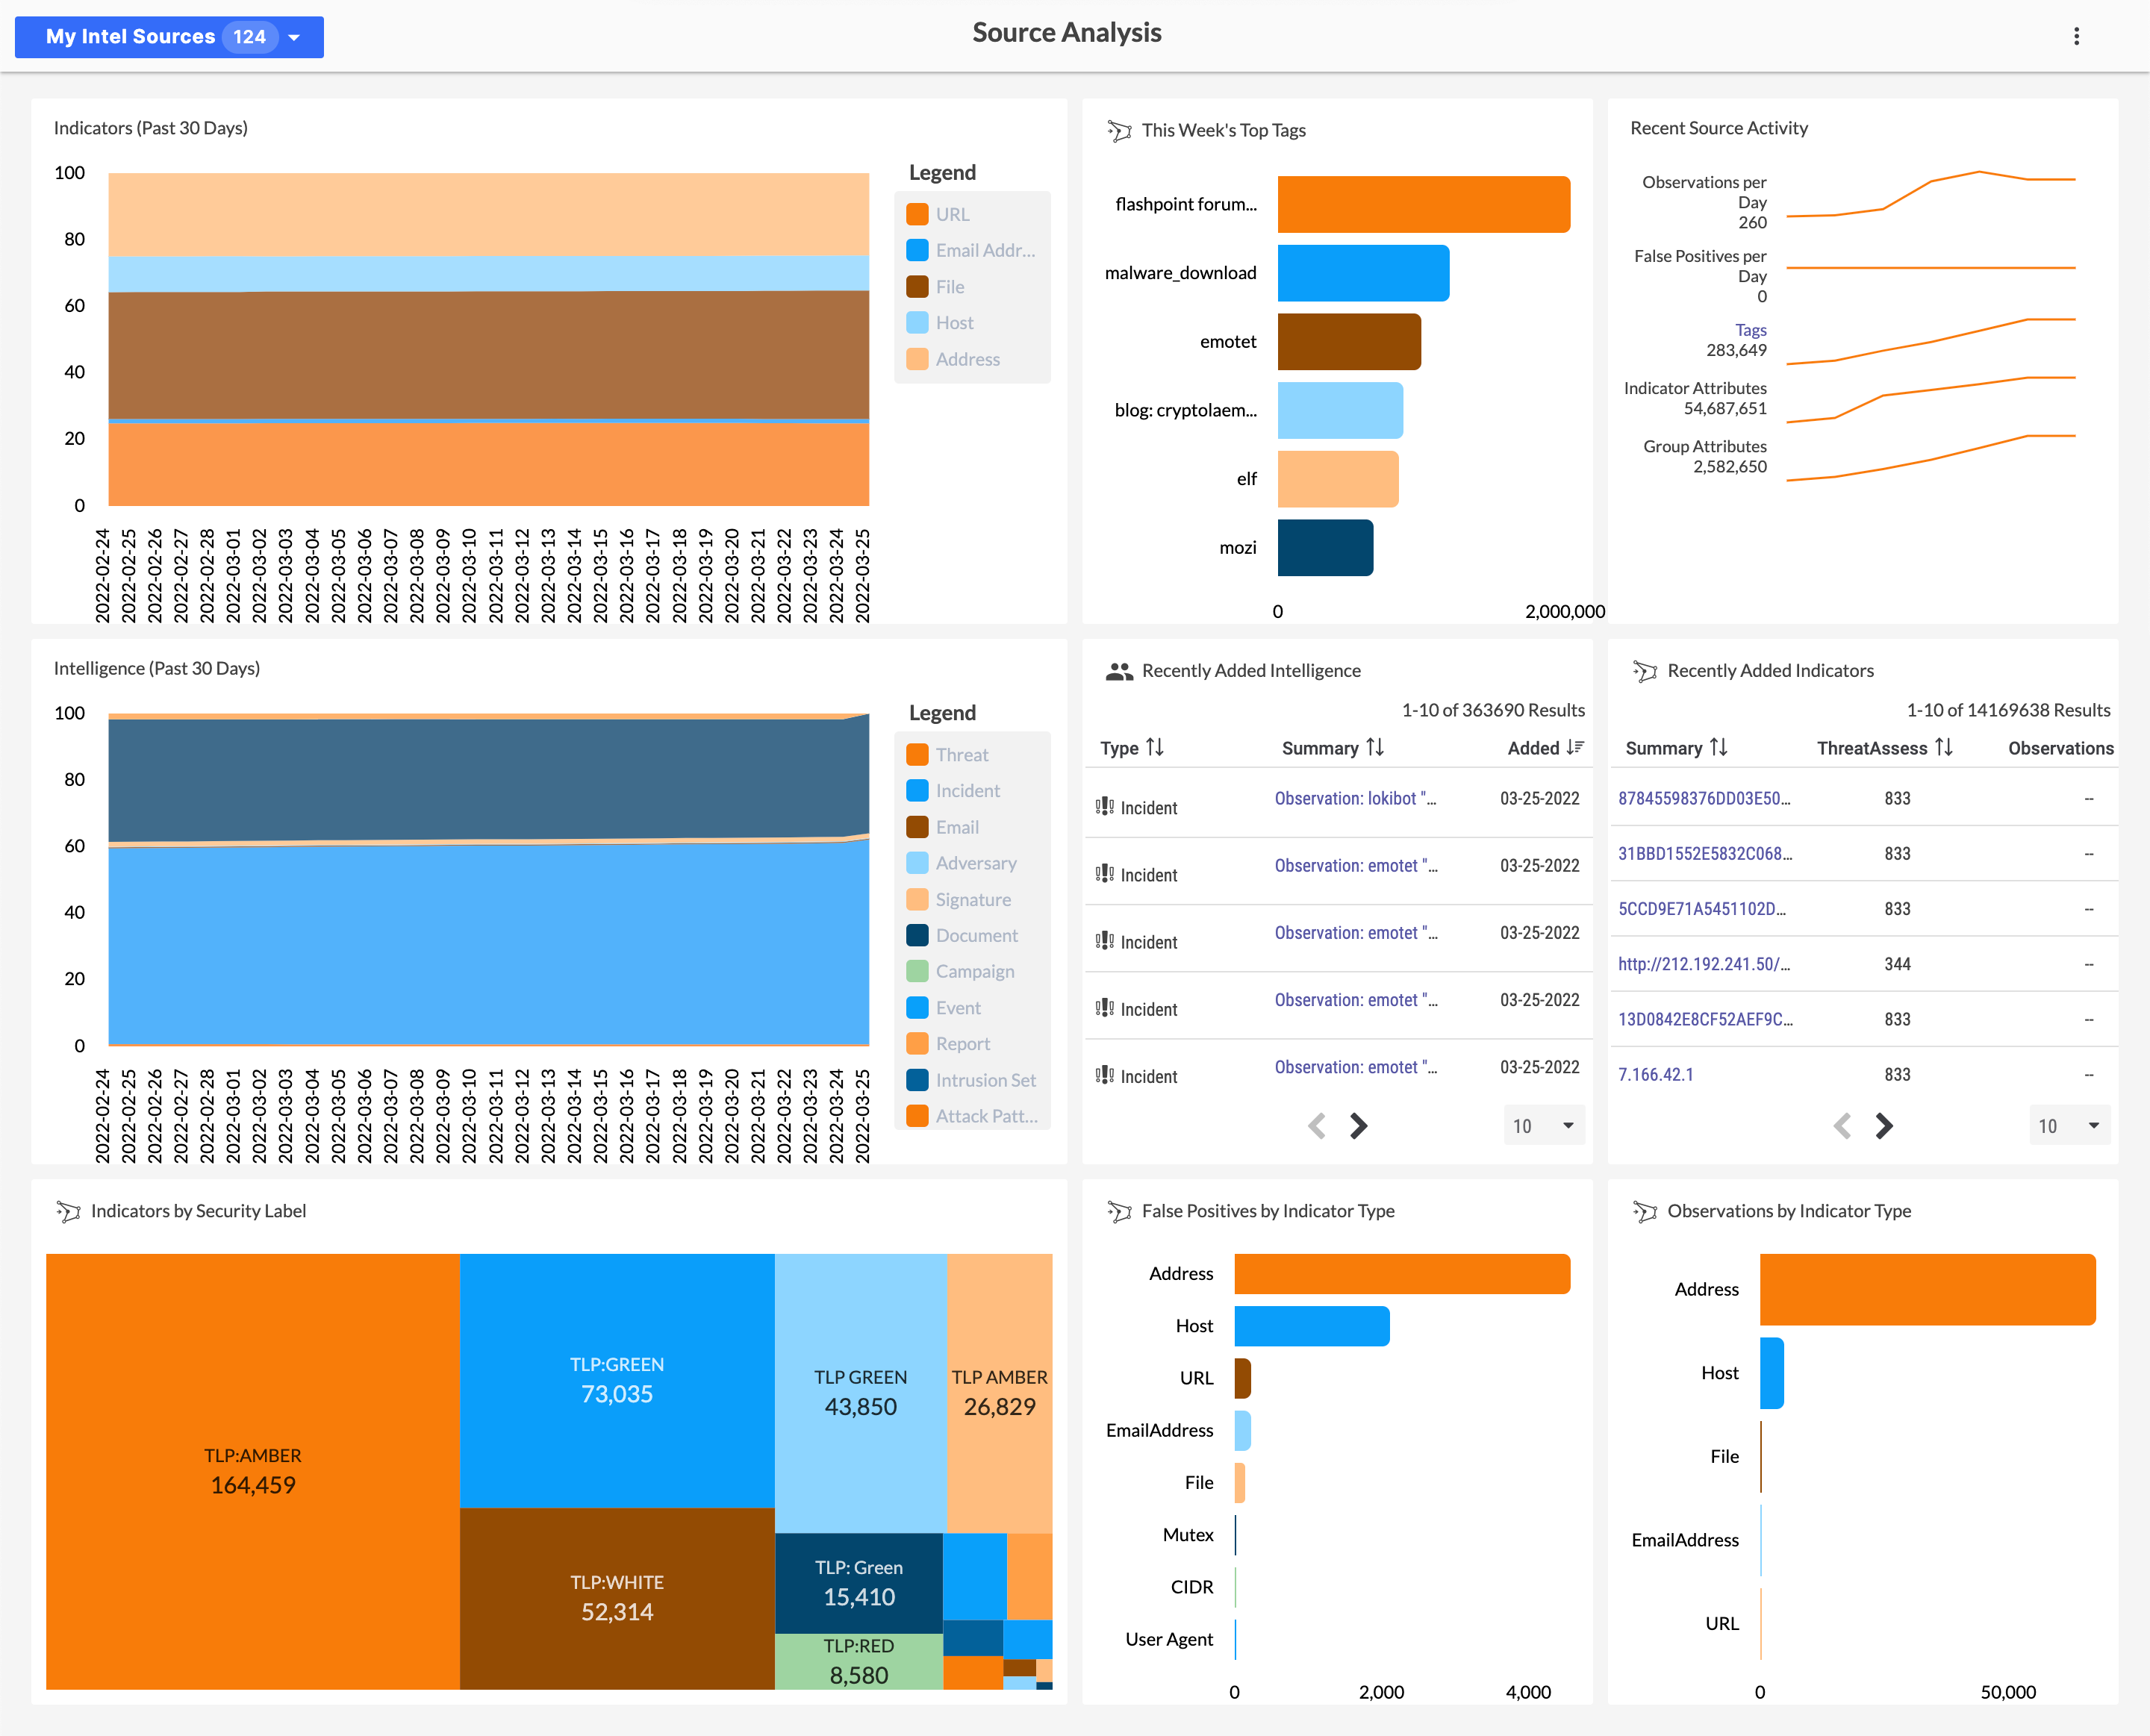
Source Analysis Dashboard
Source Analysis (Figure 5) provides a detailed breakdown of an intelligence source (i.e., Organization, Community, or Source) in ThreatConnect, including Indicator and Group types over the last 30 days, Indicators by Security Label, recent Source activity (broken down by observations, false positives, Tags, and Indicator and Group Attributes), recently added Indicators and Groups, and top Tags over the past week. Use the My Intel Sources selector to filter by a single Organization, Community, or Source in order to use this dashboard effectively.
ThreatConnect® is a registered trademark of ThreatConnect, Inc.
CVE® (Common Vulnerabilities and Exposures) is a registered trademark of The MITRE Corporation.
20044-02 v.16.A