- 30 Oct 2023
- 6 Minutes to read
-
Print
-
DarkLight
-
PDF
The Feed Explorer
- Updated on 30 Oct 2023
- 6 Minutes to read
-
Print
-
DarkLight
-
PDF
Overview
The Feed Explorer is similar in function to the Feeds tab of TC Exchange™. This feature, available to all ThreatConnect users, is accessed by clicking Feed Explorer on the My Intel Sources selector. The Feed Explorer displays all active TC Exchange feeds, presenting them in a table with associated metric data derived from CAL™. A report card is also available for each feed, comparing the metrics for the feed with aggregated metrics for other feeds.
Before You Start
| Minimum Role(s) |
|
|---|---|
| Prerequisites | CAL enabled in System Settings and Account Settings to view report card data |
Enabling CAL
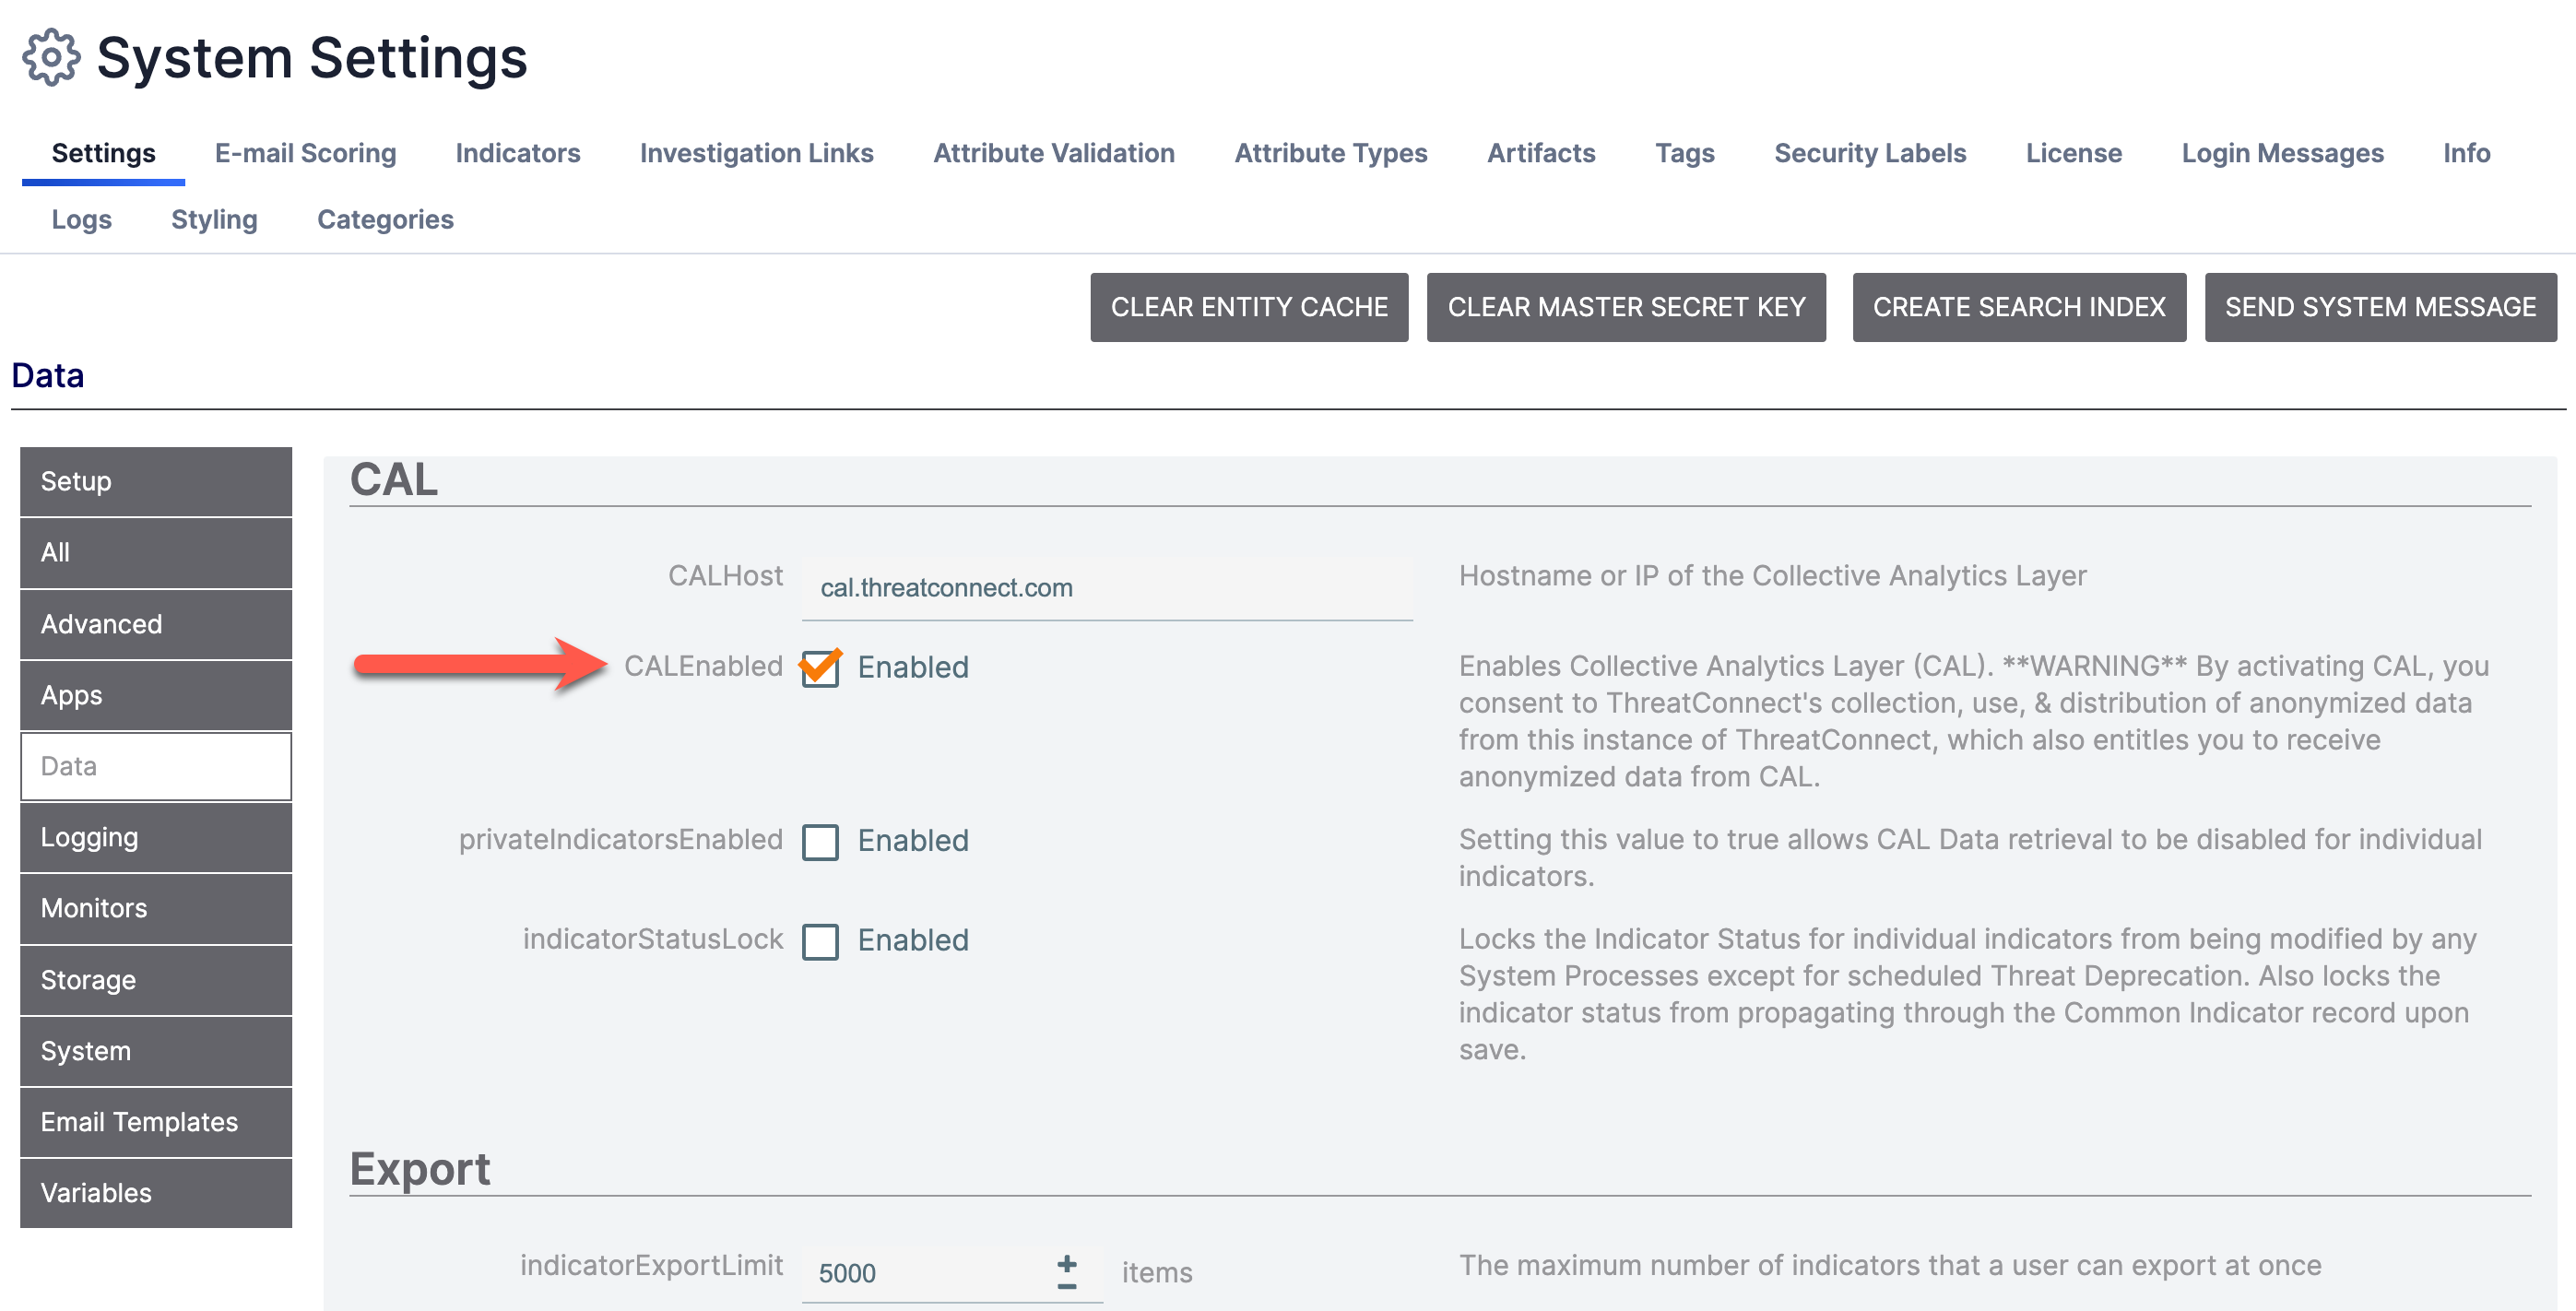
CAL must be enabled in two places in order to view report card data. First, it must be enabled in the System Settings screen in ThreatConnect. Second, the System Organization must be given permission to enable CAL data from the Account Settings screen.
System Settings
- Log into ThreatConnect with a System Administrator account.
- On the top navigation bar, hover the cursor over Settings
 and select System Settings. The Settings tab of the System Settings screen will be displayed.
 - Select Data from the menu on the left side of the System Settings screen, scroll down to the CAL section, and select the CALEnabled checkbox (Figure 1).
Account Settings
- Log into ThreatConnect with a System Administrator account.
- On the top navigation bar, hover the cursor over Settings
 and select Account Settings. The Organizations tab of the Account Settings screen will be displayed.
 - Use the search box to locate the System Organization (Figure 2).

- Click Edit
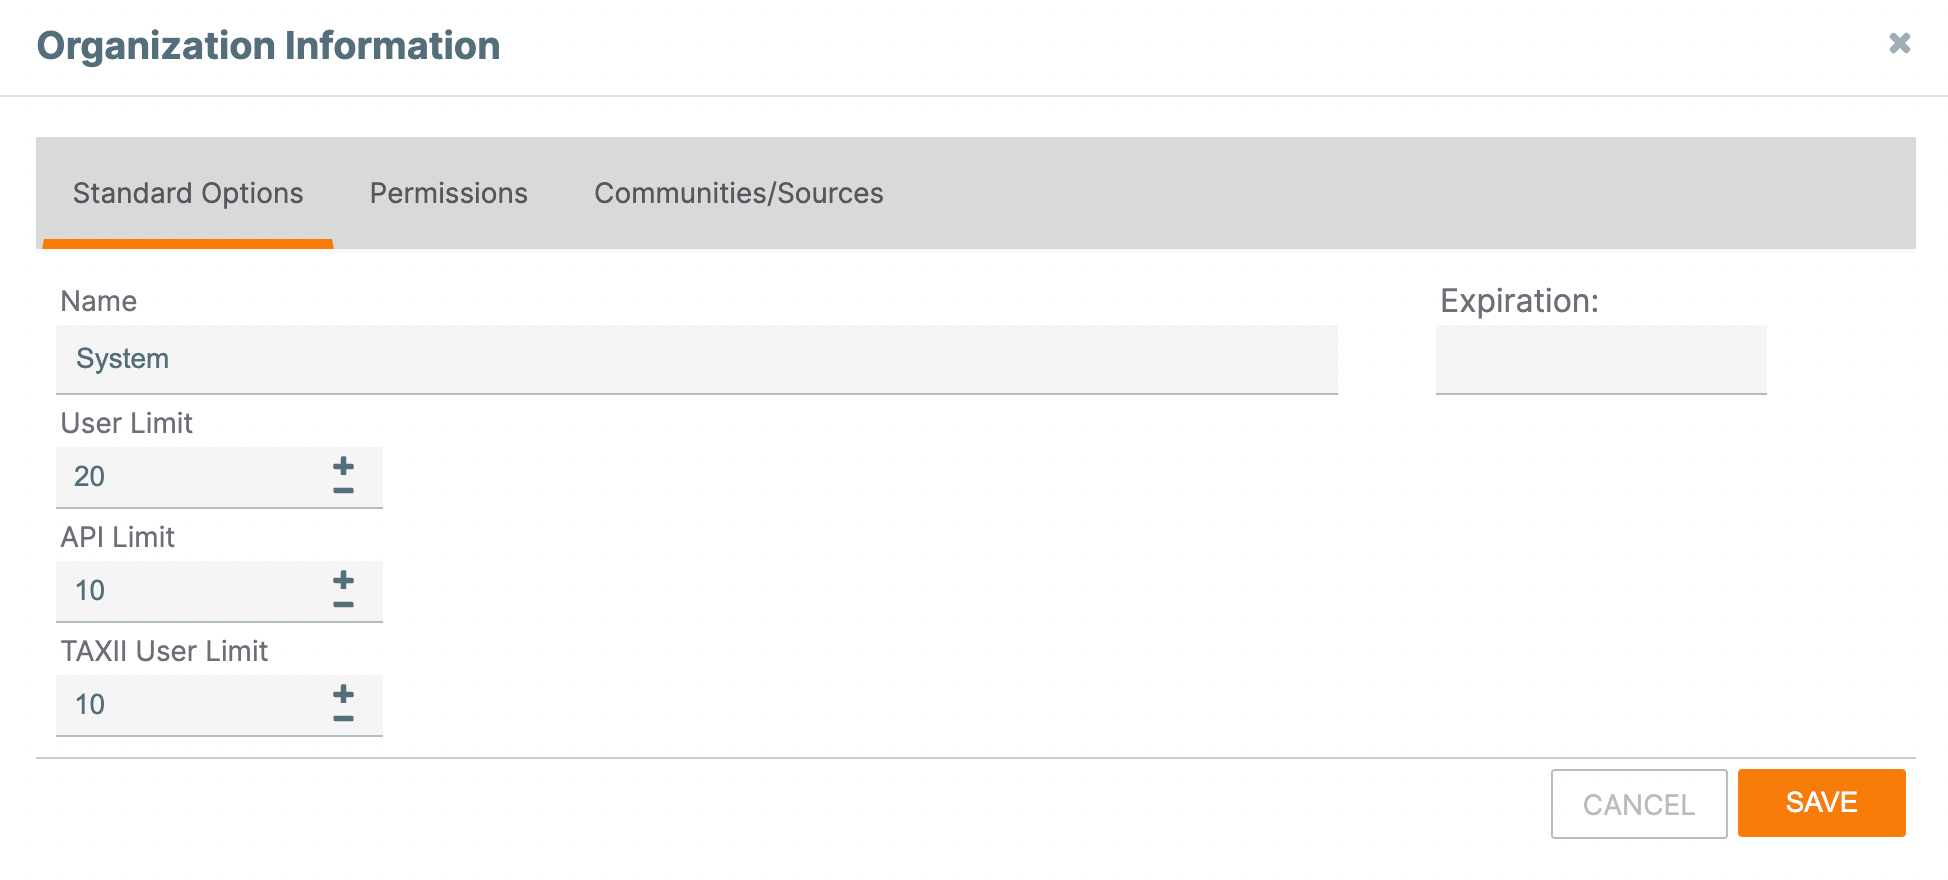
 in the Options column. The Standard Options tab of the Organization Information window will be displayed (Figure 3).
- Click the Permissions tab (Figure 4).
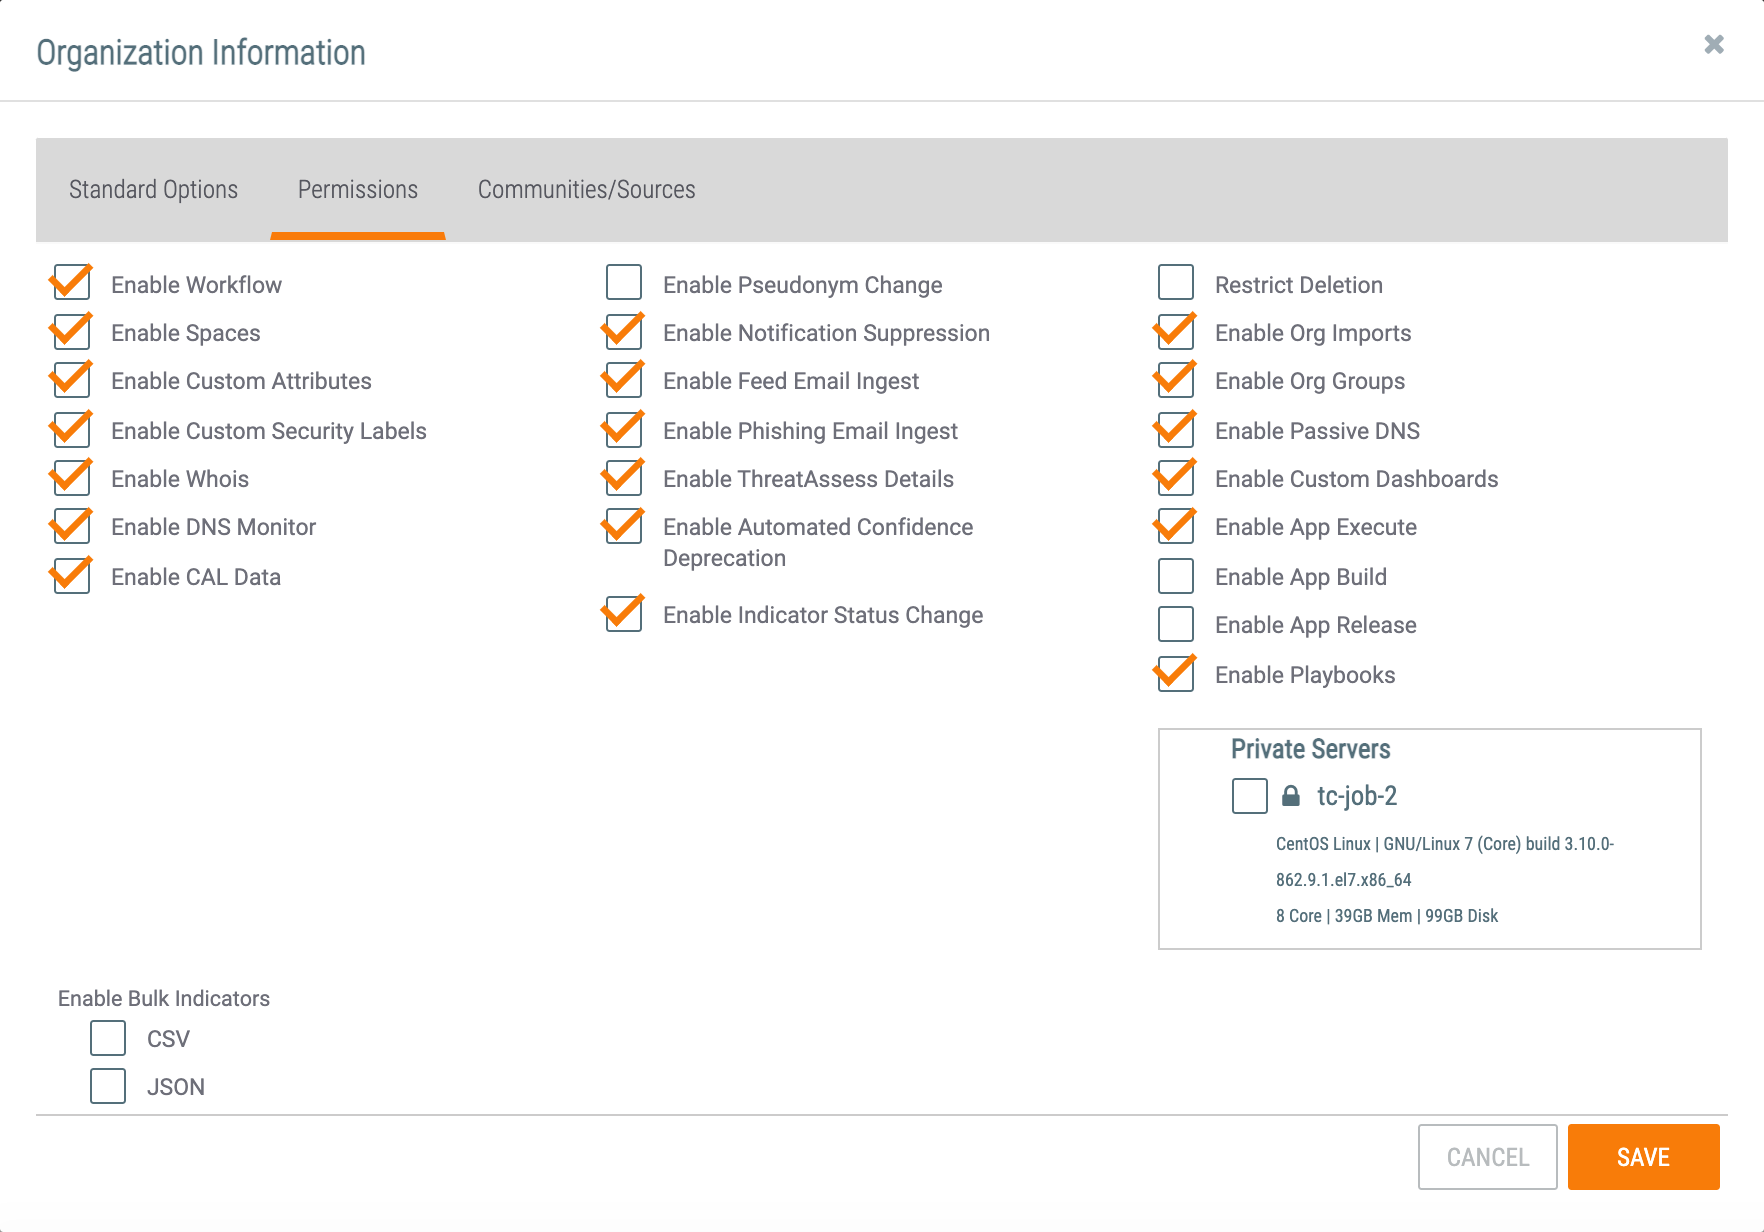
- Select the Enable CAL Data checkbox, and then click the SAVE button. If this checkbox is already selected, click the CANCEL button.
Accessing the Feed Explorer
The Feed Explorer can be accessed from three different screens in ThreatConnect: the Dashboard screen (Figure 5), the Browse screen (Figure 6), and the Search drawer (Figure 7).


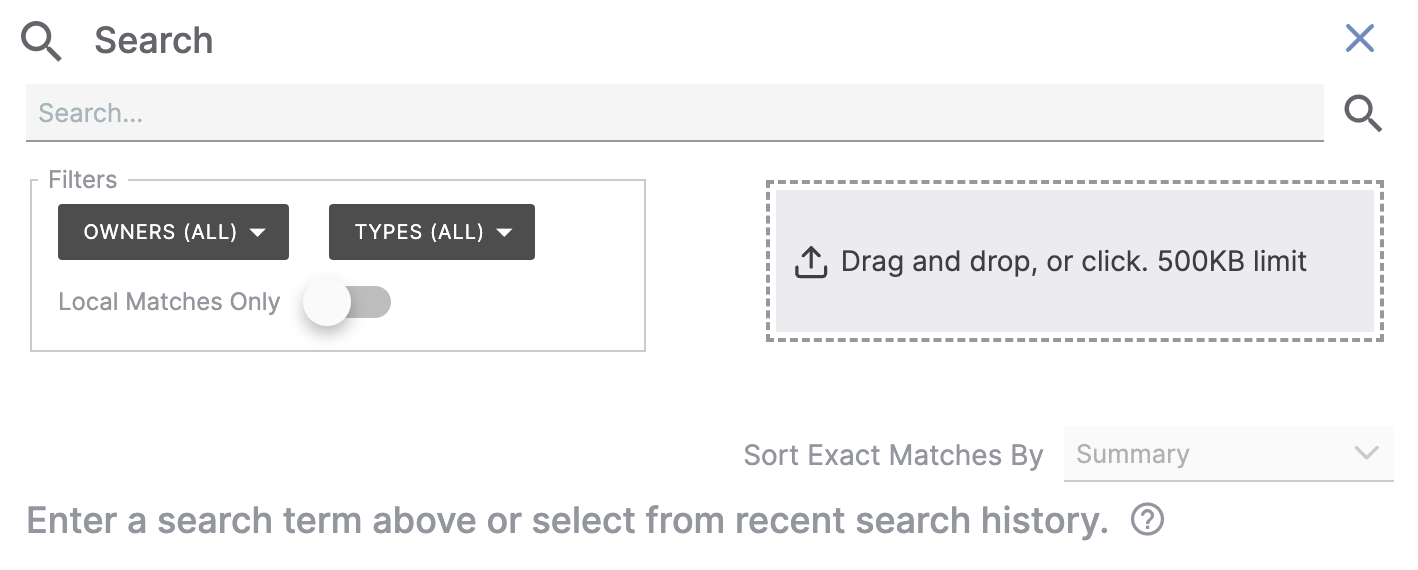
Click the My Intel Sources selector at the upper-left corner of the Dashboard or Browse screen (Figure 8), or click the OWNERS selector in the Filters section of the Search drawer (Figure 9), to display Organizations, Communities, and intelligence Sources available on your ThreatConnect instance.
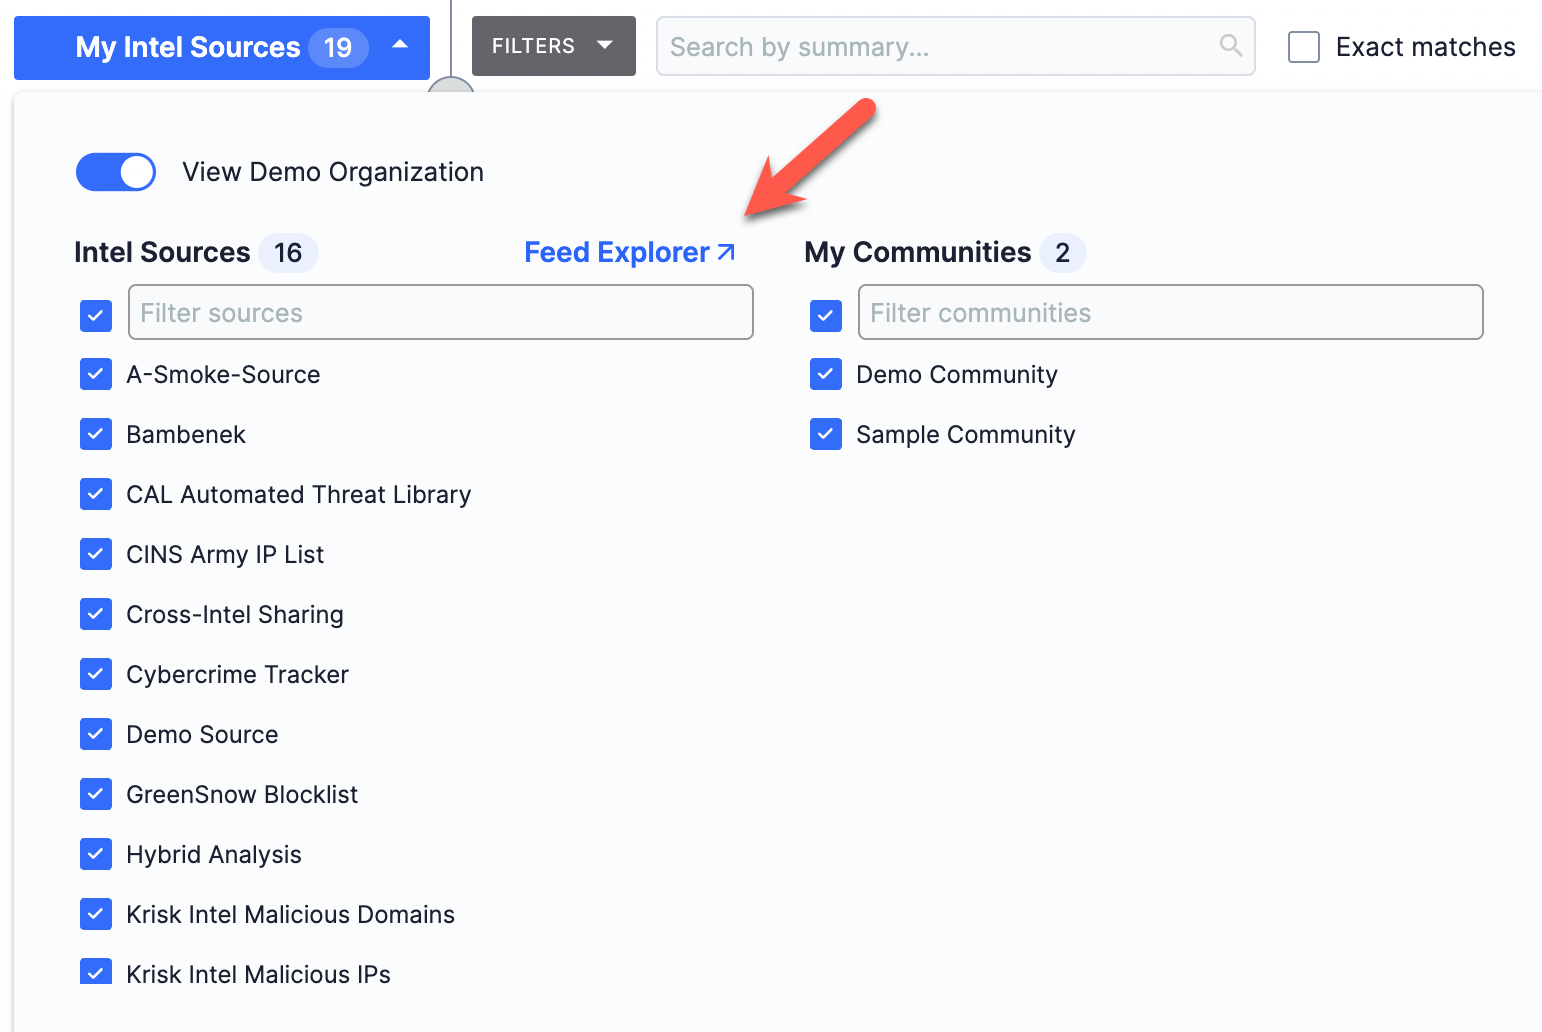
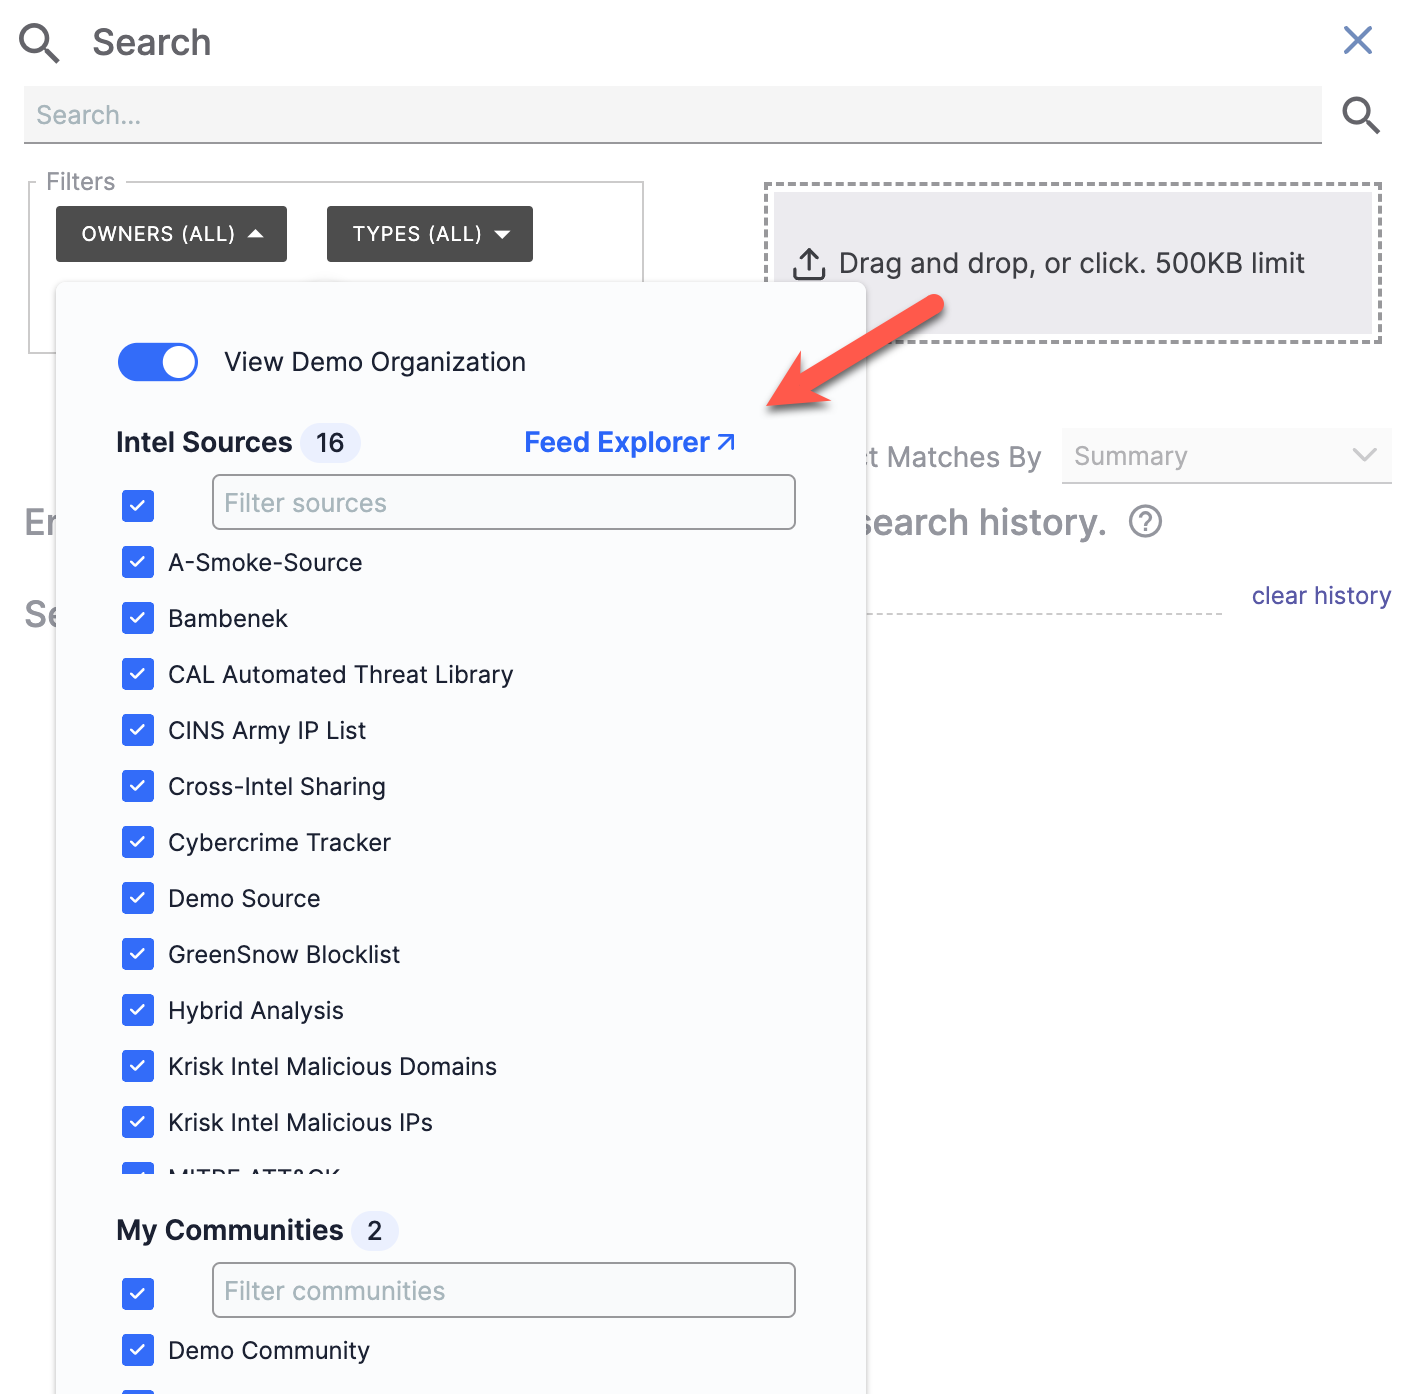
Click Feed Explorer to display the Feed Explorer screen (Figure 10).
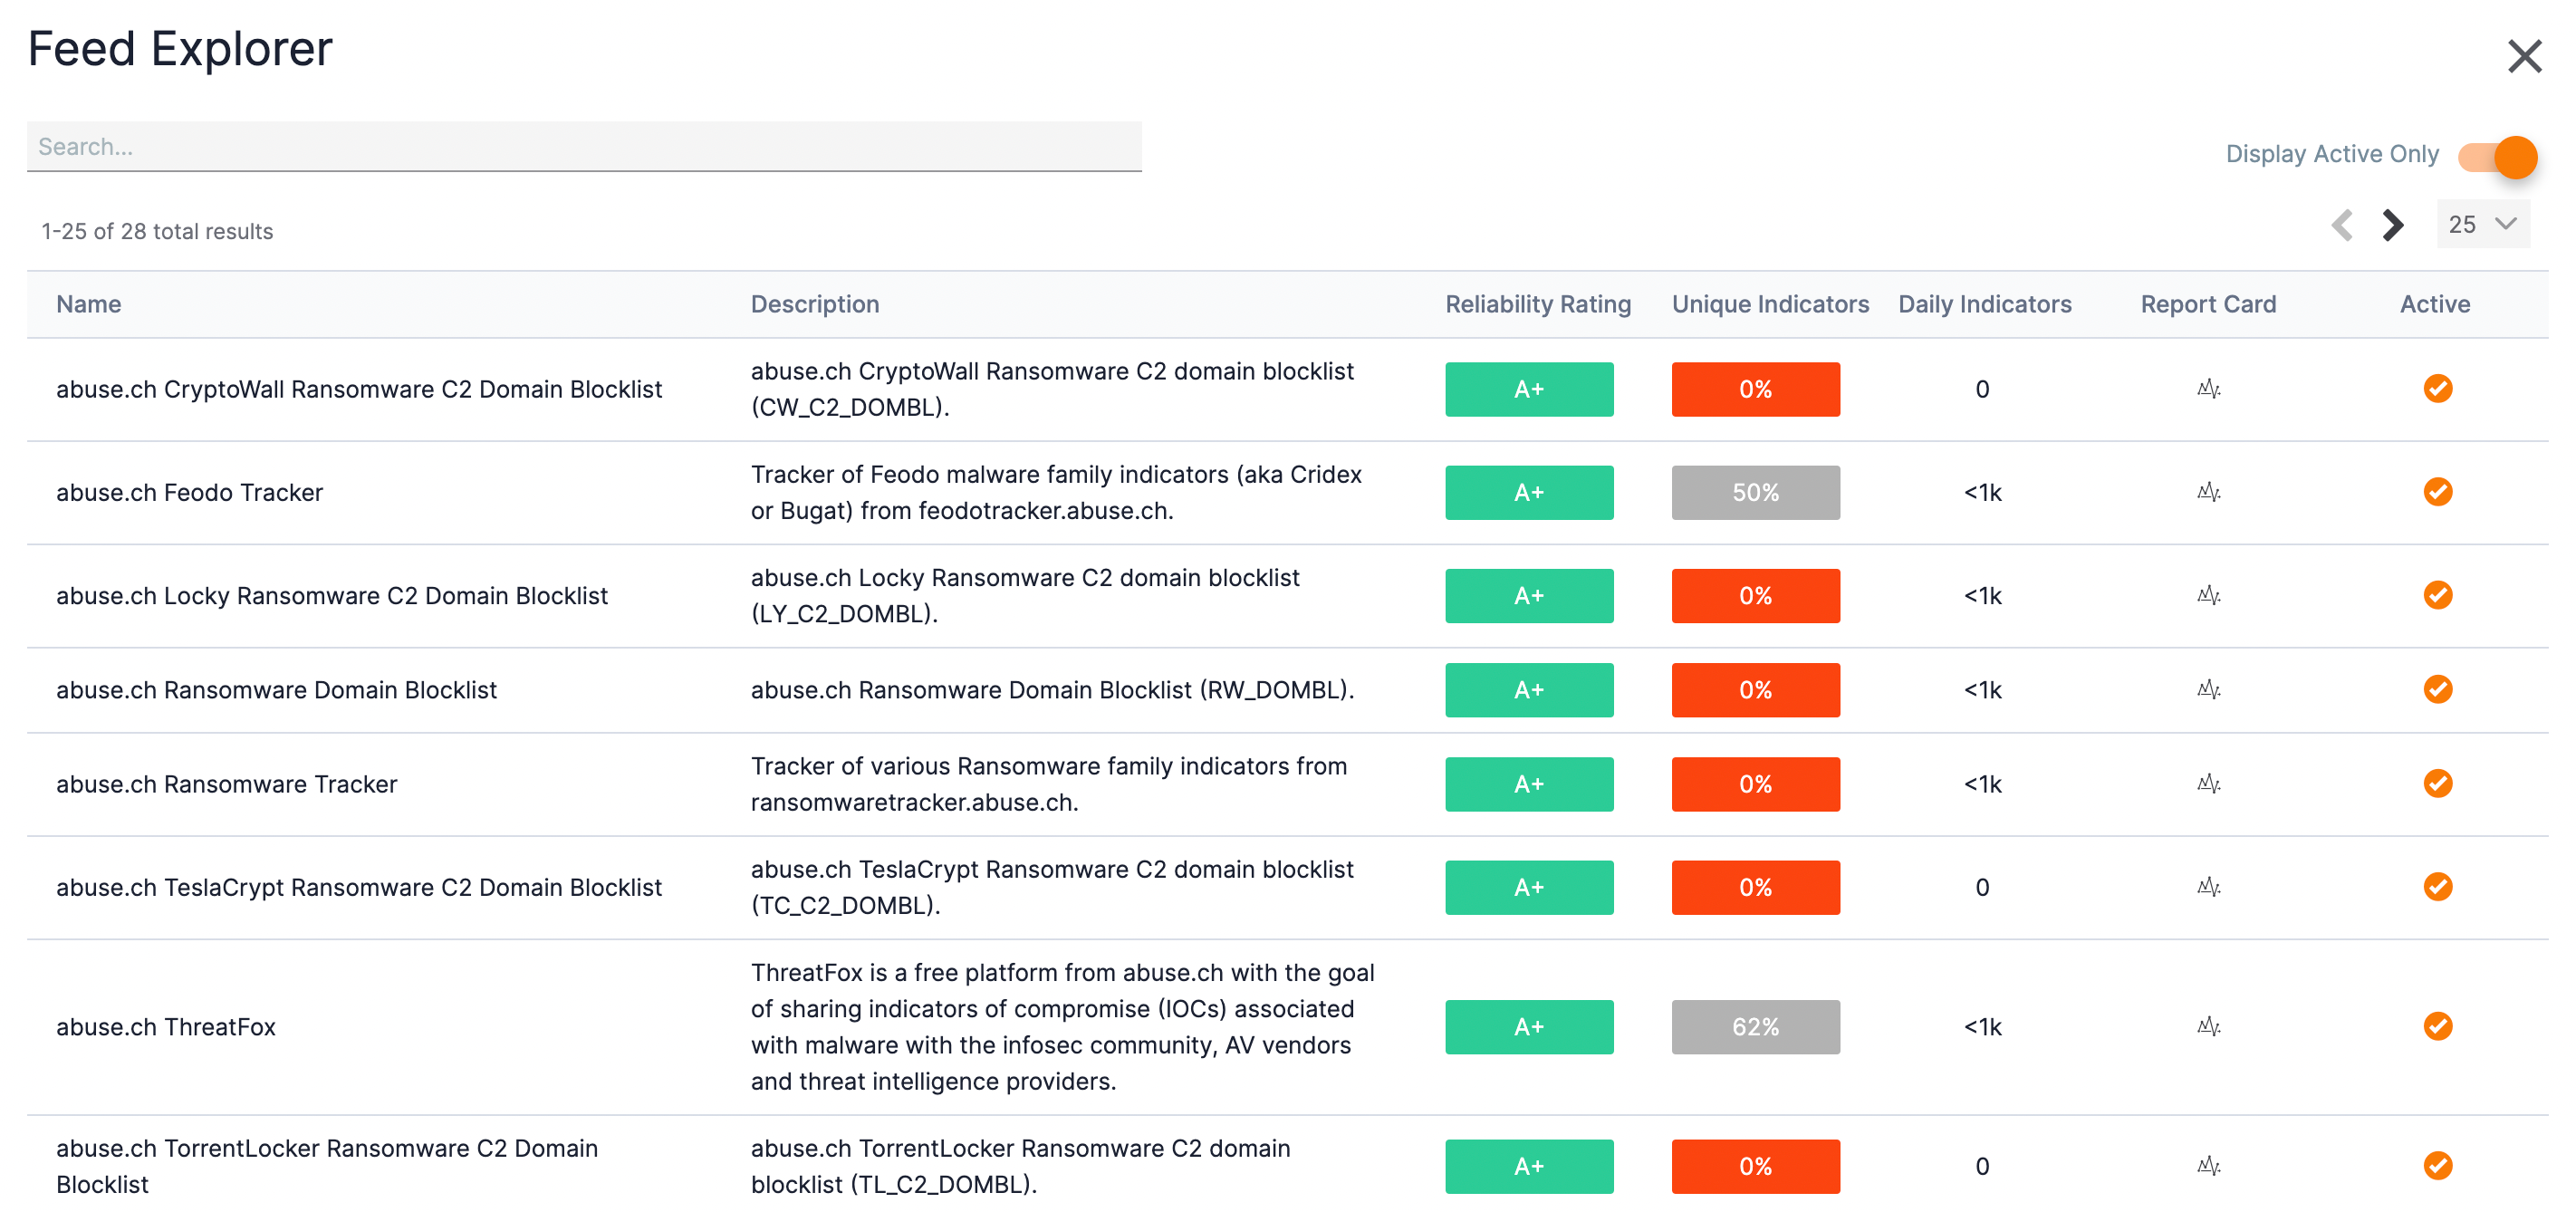
- Name: This column provides the name of the feed.
- Description: This column provides a description of the feed.
- Reliability Rating: This column provides a letter grade indicating how reliable the feed is. This metric is derived from the number of false positives found in the feed, among other things, and is a measure of how likely a feed is to yield large numbers of negatively impactful false positives. The Reliability Rating for each feed reflects the following color scheme:
- Green: The feed received an A+, A, or A- letter grade.
- Gray: The feed received a B+, B, or B- letter grade.
- Red: The feed received a C or lower letter grade.
- Unique Indicators: This column provides the percentage of Indicators in the feed that are unique (i.e., that are not found in other feeds on which CAL gathers data as well). For example, a score of 28% means that 28% of the Indicators in the feed are not found in other feeds (and, consequently, that 72% of the Indicators appear in other feeds). The Unique Indicators value reflects the following color scheme:
- Green: The percentage is greater than or equal to 77%.
- Gray: The percentage is less than 77% and greater than 21%.
- Red: The percentage is less than or equal to 21%.
- Daily Indicators: This column provides an estimate of the number, in thousands, of Indicators the feed pulls in per day.
- Report Card: Clicking the graph
 icon displays a graphic showing metrics from the other columns and how they compare with aggregated metrics from other feeds. See the next section, “Report Cards”, for more information.
 - Active: If a feed is active, this column will display a checkmark
 icon.
icon.
By default, the Feed Explorer screen displays only active open-source feeds, which is indicated by the orange Display Active Only slider at the upper-right corner. Toggling the slider off will display all feeds.
A green dot to the right of a feed's name indicates that you should consider activating that feed because of its high reliability and high degree of uniqueness. A red dot to the right of a feed's name indicates that you should consider deactivating that feed because of its low reliability rating and low degree of uniqueness.
Report Cards
Clicking the graph![]() icon in the Report Card column will display a feed's report card (Figure 11). The information found within is similar to that found in the TC Exchange report card, except that is available to all users.
icon in the Report Card column will display a feed's report card (Figure 11). The information found within is similar to that found in the TC Exchange report card, except that is available to all users.
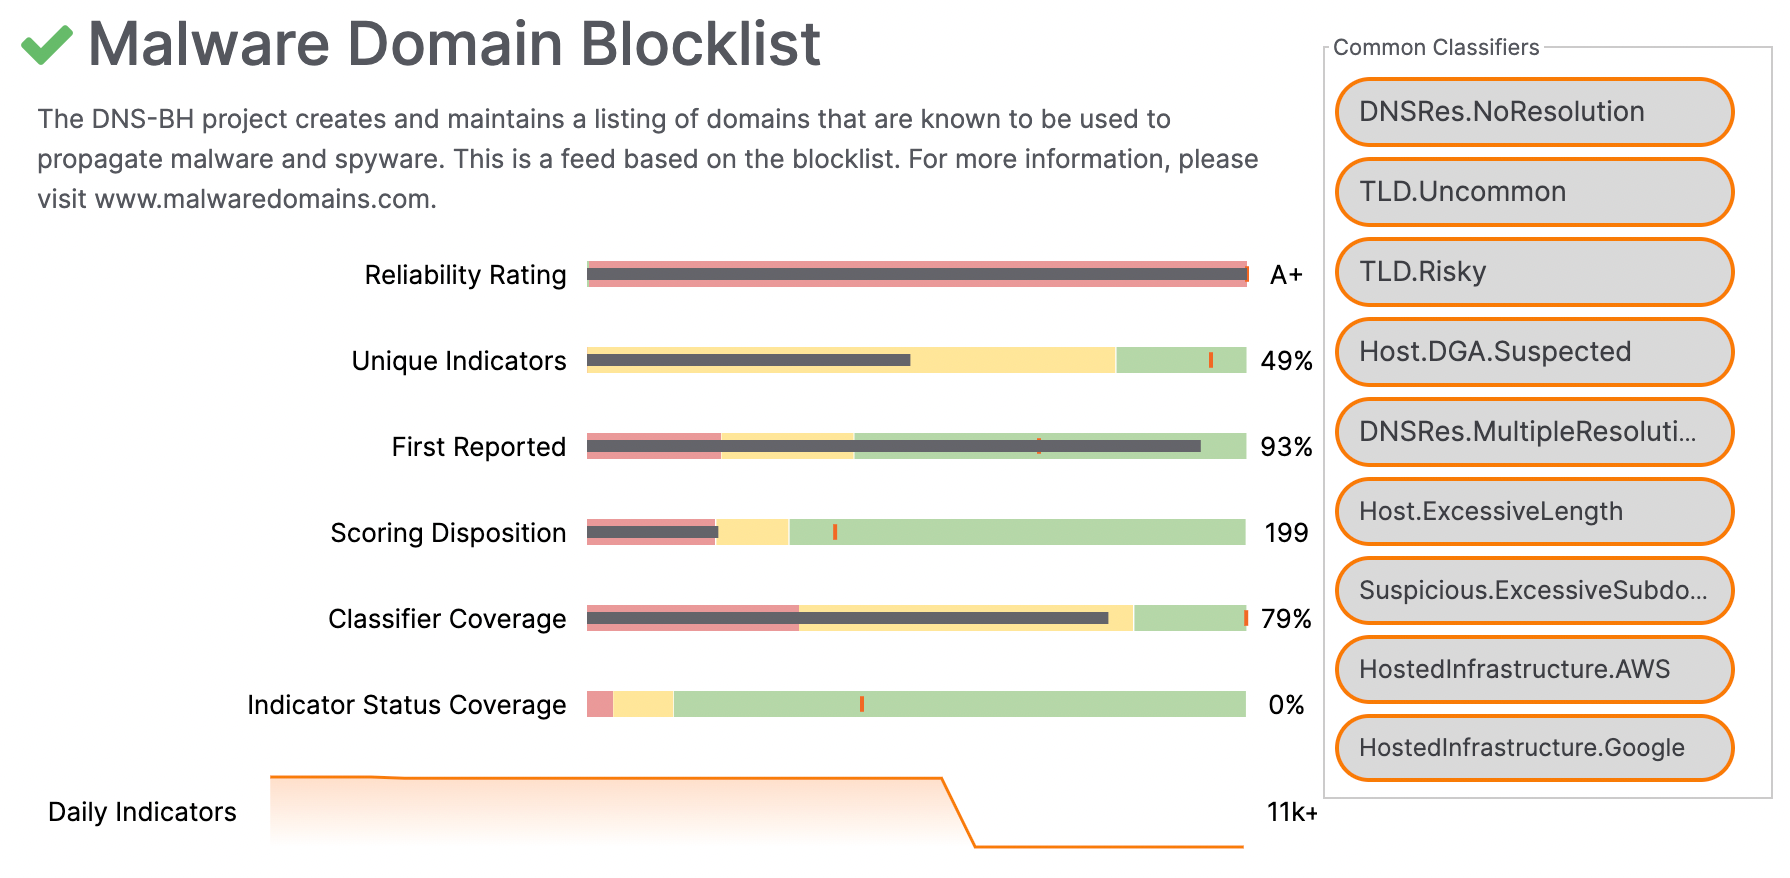
A list of Common Classifiers from CAL that apply to the feed is displayed on the right side of the report card. The six bullet graphs displayed in the middle of the report card provide data on the following metrics:
- Reliability Rating: This metric is the same as the Reliability Rating on the Feed Explorer screen.
- Unique Indicators: This metric is the same as Unique Indicators on the Feed Explorer screen.
- First Reported: This metric is a measure of how often a feed is the first feed to report a particular Indicator when that Indicator is observed in other feeds as well.
- Scoring Disposition: Like ThreatAssess, CAL produces a score for each Indicator that measures how dangerous the Indicator is, on a scale of 0 (benign) to 1000 (very dangerous). The Scoring Disposition metric is a weighted average of the CAL scores for the Indicators in the feed.
- Classifier Coverage: This metric indicates the percentage of Indicators in the feed that have at least one Classifier applied by CAL’s analytics. It is a measure of how well existing analytics can qualitatively understand the data from the feed.
- Indicator Status Coverage: This metric indicates the percentage of Indicators in the feed that have a definitive Indicator Status set by CAL. It is a measure of how conclusively CAL’s analytics can provide quantitative statements of the data from the feed.
The bullet graphs use four visual elements to put the data for the feed in context with the other feeds:
- Horizontal Black Line: The horizontal black line represents the value of the metric for the particular feed. For example, in Figure 11, for Unique Indicators, the black line represents a value of 49%, where the left side of the chart is a value of 0% and the right side of the chart is a value of 100%.
- Vertical Orange Line: The vertical orange line represents the target value of the metric across all feeds. The target value is computed by CAL and ThreatConnect analysts to help determine which feeds have the most impact. In this example, the 49% value for Unique Indicators for the Malware Domain Blocklist is a lot less than the target value of this metric across all feeds, indicating that, on average, this feed provides a lesser number of unique Indicators than other feeds do.
- Colored Bands: The red, yellow, and green bands represent algorithmically derived segments of quality, where red is a “bad” range, yellow is a “medium” range, and green is a “good” range. For the Malware Domain Blocklist, its Unique Indicators value, at 49%, falls in the “medium” range, while its First Reported value, at 93%, falls in the “good” range.
- Value: The value for each metric is displayed to the right of its respective bullet graph.
The Daily Indicators graph, which appears below the six bullet graphs, is a sparkline depiction of the number of Indicators the feed is bringing in per day over the last 30 days. The value to the right of the graph indicates the total number of Indicators in the feed added in the last 30 days.
ThreatConnect® is a registered trademark, and TC Exchange™ and CAL™ are trademarks, of ThreatConnect, Inc.
20104-01 v.03.D


