Overview
Once you design, activate, and execute a Playbook, it runs in real time and provides detailed logs of each execution on the Executions screen in the Playbook Designer. Information captured includes inputs to and outputs from Apps and Operators, App logs, OS logs, and start and end times for each execution.
This article describes how to view the details and logs for a Playbook execution, view an active Playbook execution in the Execution Graph pane, and stop (or kill) a Playbook execution. For instructions on how to execute a Playbook based on the type of Trigger it uses, see Executing a Playbook.
Before You Start
| Minimum Role(s) |
|
|---|---|
| Prerequisites |
|
Accessing the Executions Pane
When a Playbook is active, you can access details about its executions, including execution logs for each App and Operator used in the Playbook, via the Executions pane.
- On the top navigation bar, click Playbooks to display the Playbooks screen.
- Open an active Playbook.
- Click
 Executions on the side navigation bar of the Playbook Designer to display the Executions pane (Figure 1).
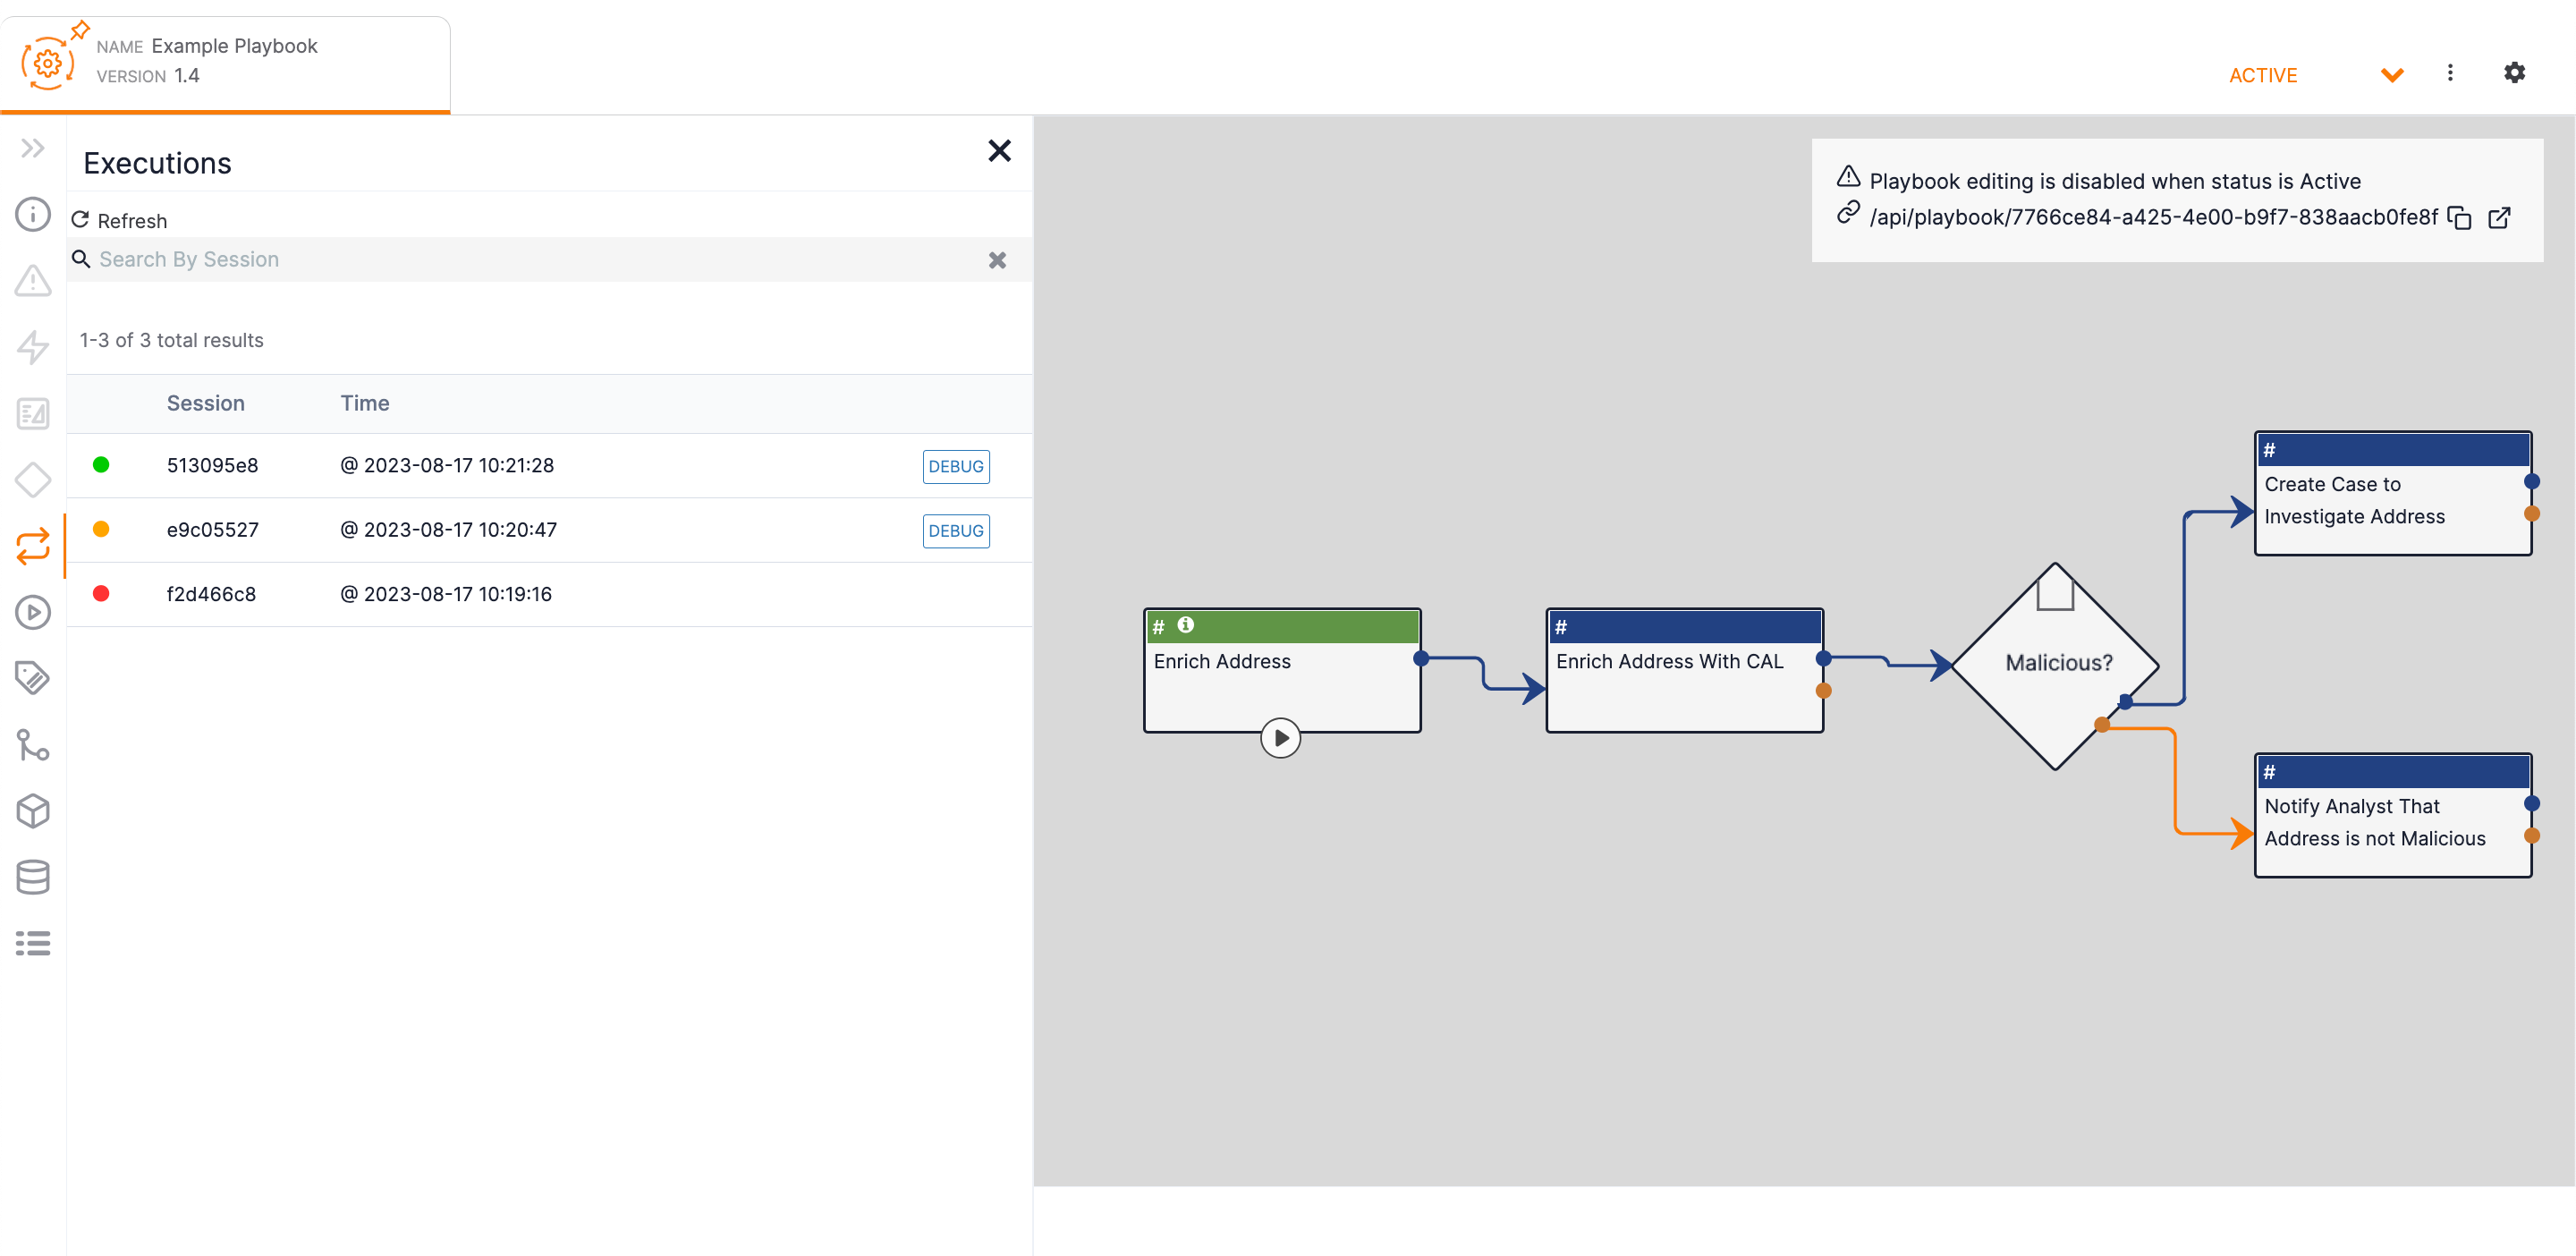
The Executions pane displays a list of executions for the Playbook. The colored circle to the right of each execution’s session ID indicates the status of the execution as follows:
- Green circle: The execution was successful.
- Orange circle: The execution partially failed (that is, one or more pathways failed, while others ran successfully).
- Red circle: The execution completely failed (that is, all pathways failed).
Viewing a Playbook Execution’s Details and Logs
Click on an execution in the Executions pane to open its Execution screen in a new tab within the Playbook Designer (Figure 2).
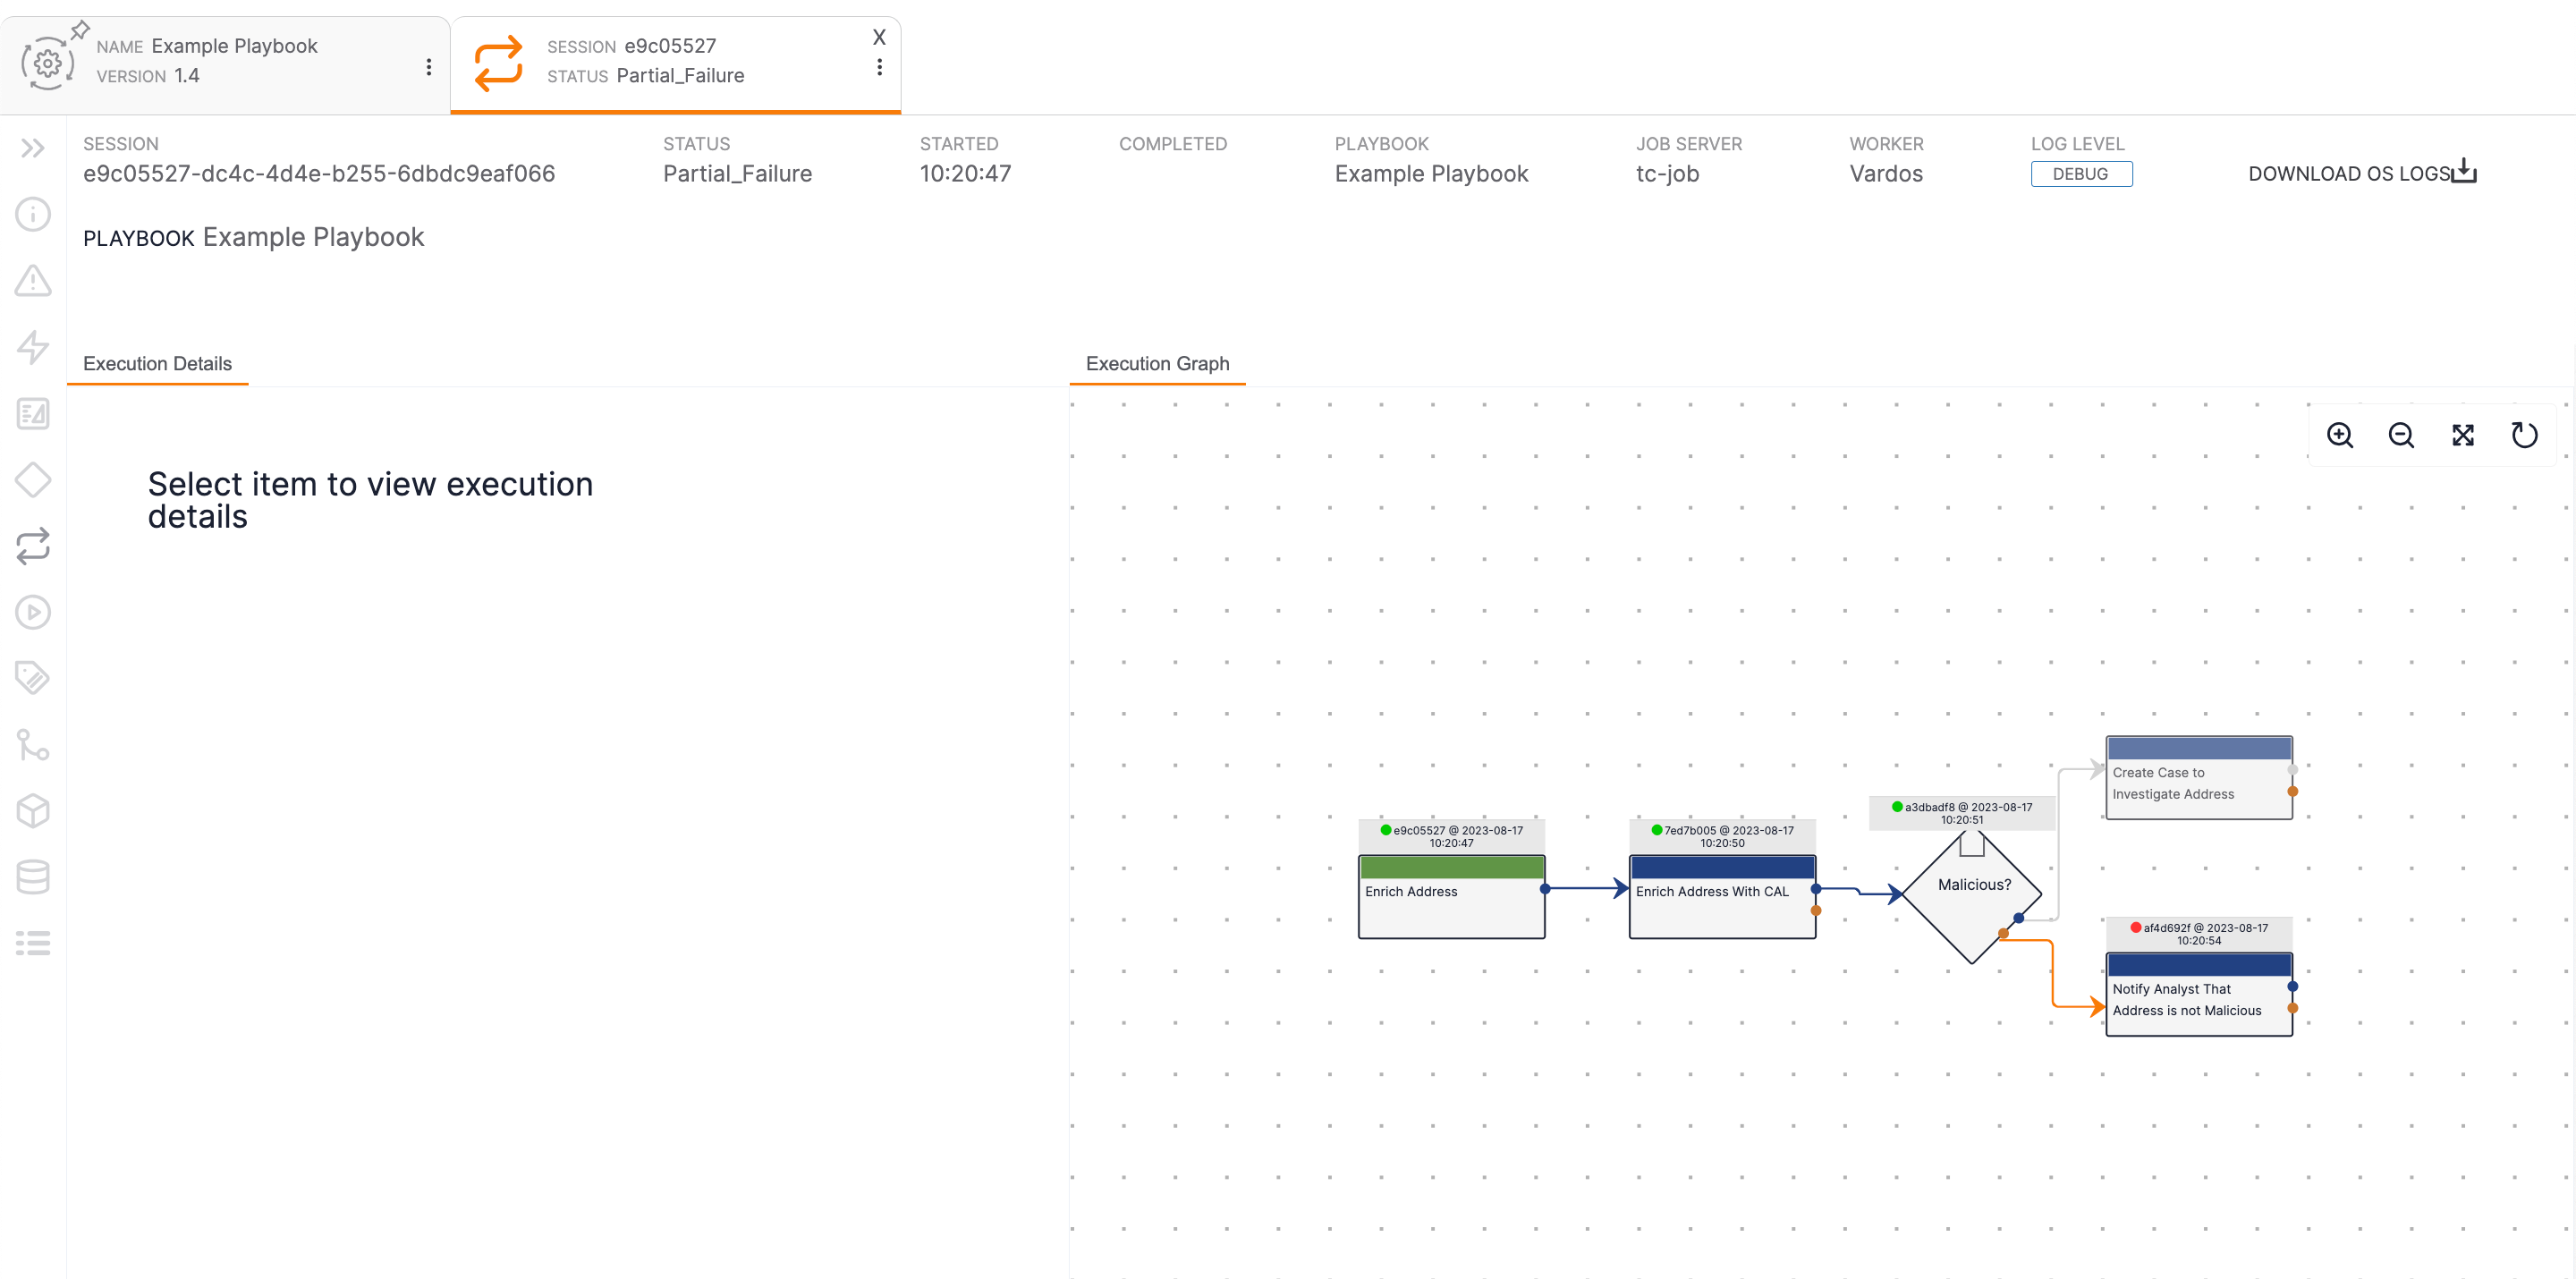
- SESSION: The execution’s session ID
- STATUS: The status of the execution.
- STARTED: The time when the execution started.
- COMPLETED: The time when the execution completed successfully. If the execution failed, no time will be displayed.
- PLAYBOOK: The Playbook’s name.
- JOB SERVER: The Job Server on which the Playbook was executed.
- WORKER: The Worker on which the Playbook was executed.
- LOG LEVEL: The log level used during the execution.
- DOWNLOAD OS LOGS: If a Playbook’s log level is set to DEBUG or TRACE, a DOWNLOAD OS LOGS button will be displayed in the upper-right corner of the Execution screen. Click this button to download a ZIP file that contains separate ZIP files for each App for which OS logs (e.g., standard error, standard output, logs particular to the given App) are available.
- Execution Details: This pane displays details about the execution and includes four tabs (Inputs, Outputs, App Logs, and OS Logs) with additional details at the bottom of the pane. See the “Execution Details” section for more information on this pane.
- Execution Graph: This pane displays the path an execution took in an interactive graph. See the “Execution Graph” section for more information on this pane.
Execution Graph
The Execution Graph pane displays the path that the execution took (Figure 3). Steps that executed will be displayed in color, and the status, session ID, and date and time of execution will be displayed along the top of the corresponding Trigger, App, or Operator on the graph. (See the “Accessing the Executions Pane” section for an explanation of each status and its respective color.) Steps that were not executed will be grayed out.
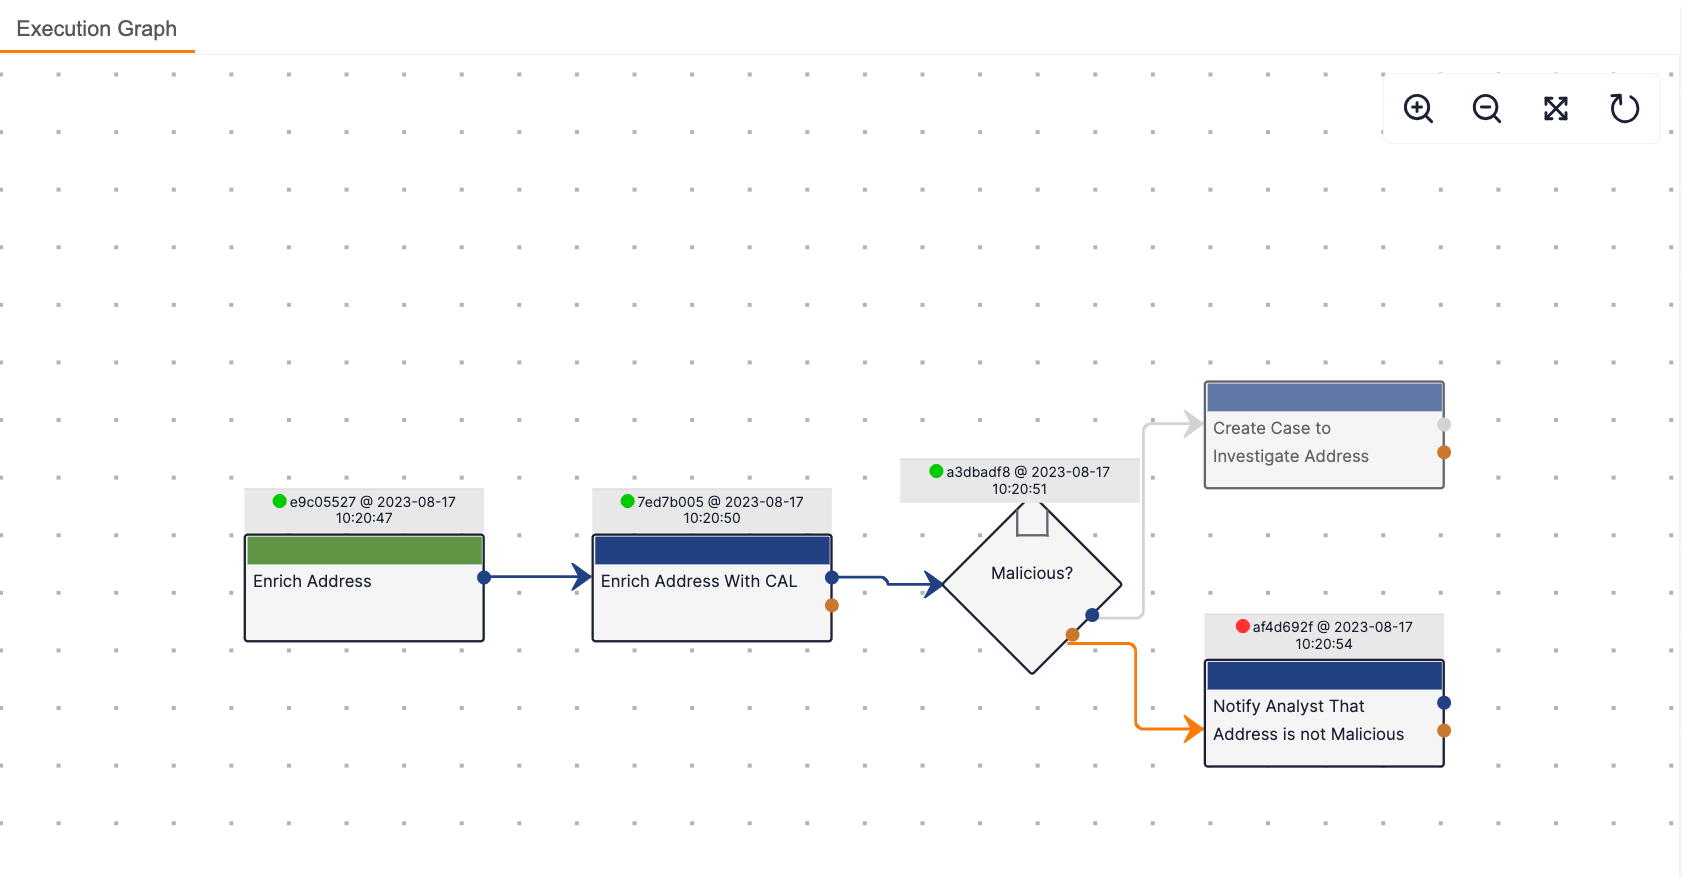
The toolbar at the upper-right corner of the Execution Graph pane allows you to perform the following actions:
- Zoom in
 : Click this icon to increase the size of Playbook elements on the graph.
 - Zoom out
 : Click this icon to decrease the size of Playbook elements on the graph.
 - Zoom to fit
 : Click this icon to adjust the zoom automatically so that all Playbook elements on the graph are displayed in the pane.
 - Refresh
 : Click this icon to refresh the graph to display the current status of the execution.NoteAs of ThreatConnect version 6.6, the Execution Graph pane will update automatically for active Playbook executions to indicate the current status of the execution. See the “Viewing an Active Playbook Execution” section for more information.
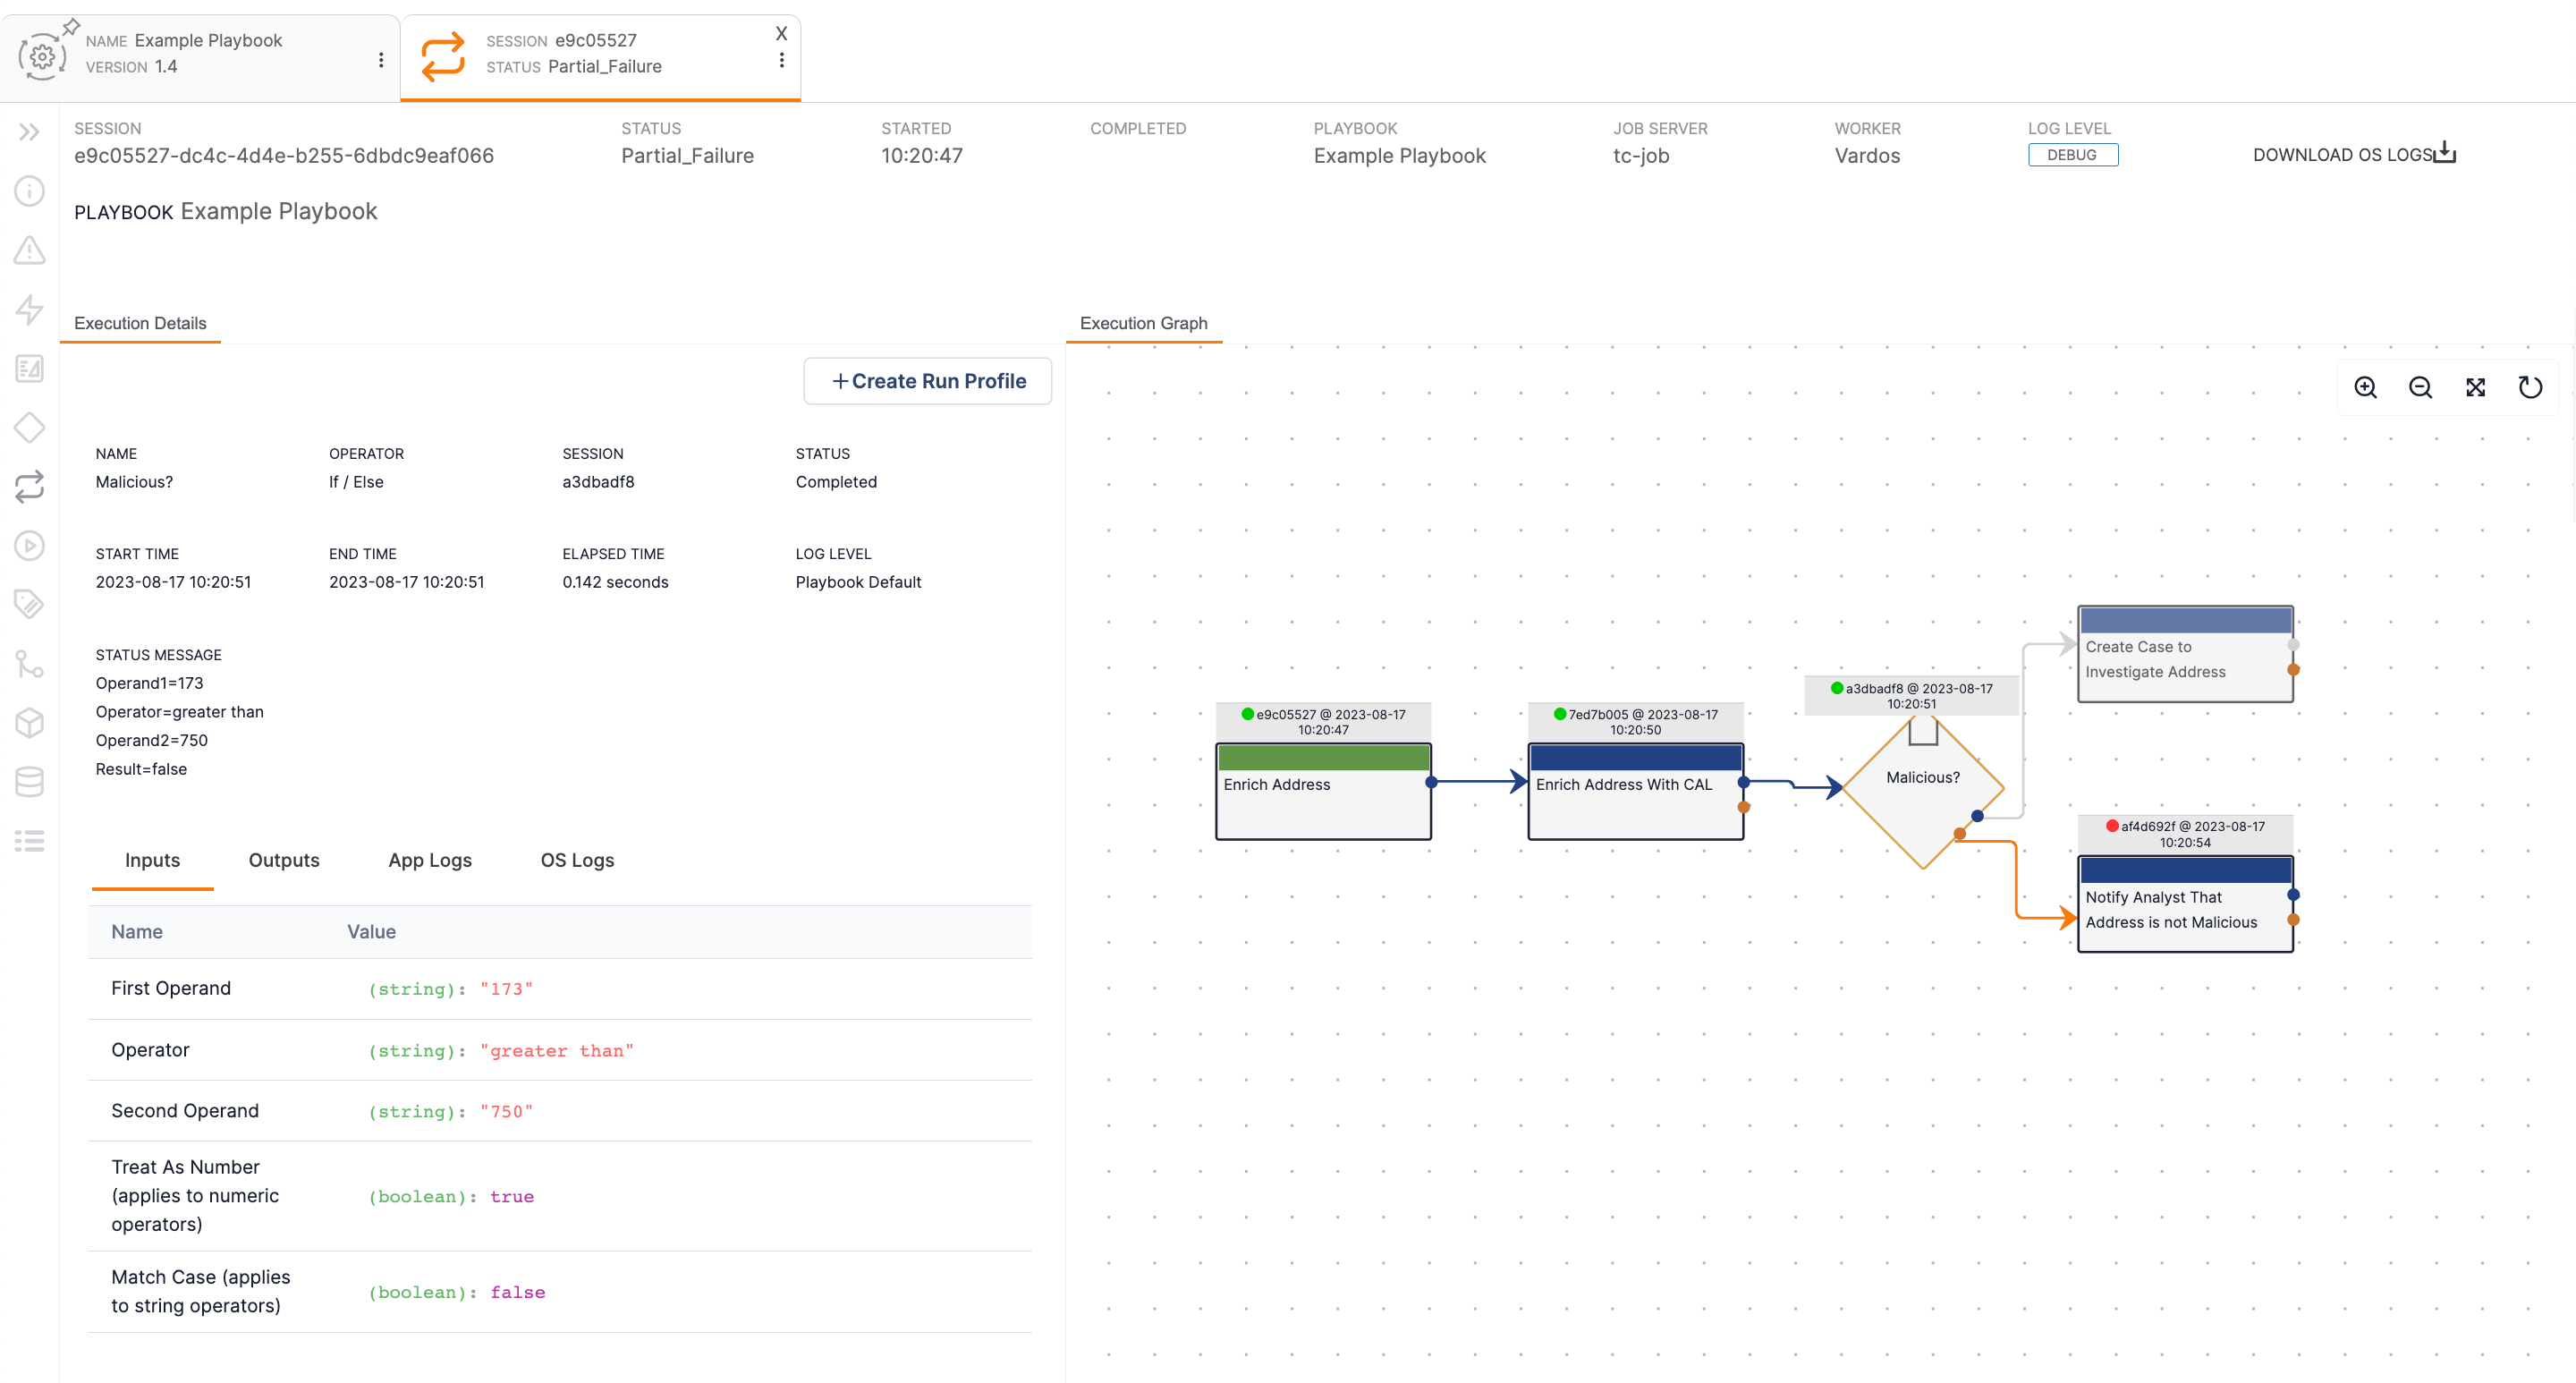
Click on a Trigger, App, or Operator on the Execution Graph pane to display its execution details in the Execution Details pane (Figure 4).
Execution Details
The Execution Details pane displays details about the execution at the top of the pane and in four tabs (Inputs, Outputs, App Logs, and OS Logs) at the bottom of the pane, depending on the selected Trigger, App, or Operator. Details about the selected Trigger, App, or Operator displayed at the top of the Execution Details pane may include its name, type, session ID, execution status, start time, end time, elapsed time, log level, and status message. Figure 5 displays the Execution Details pane for the “Malicious?” If/Else Operator used in the Playbook (Figure 3).
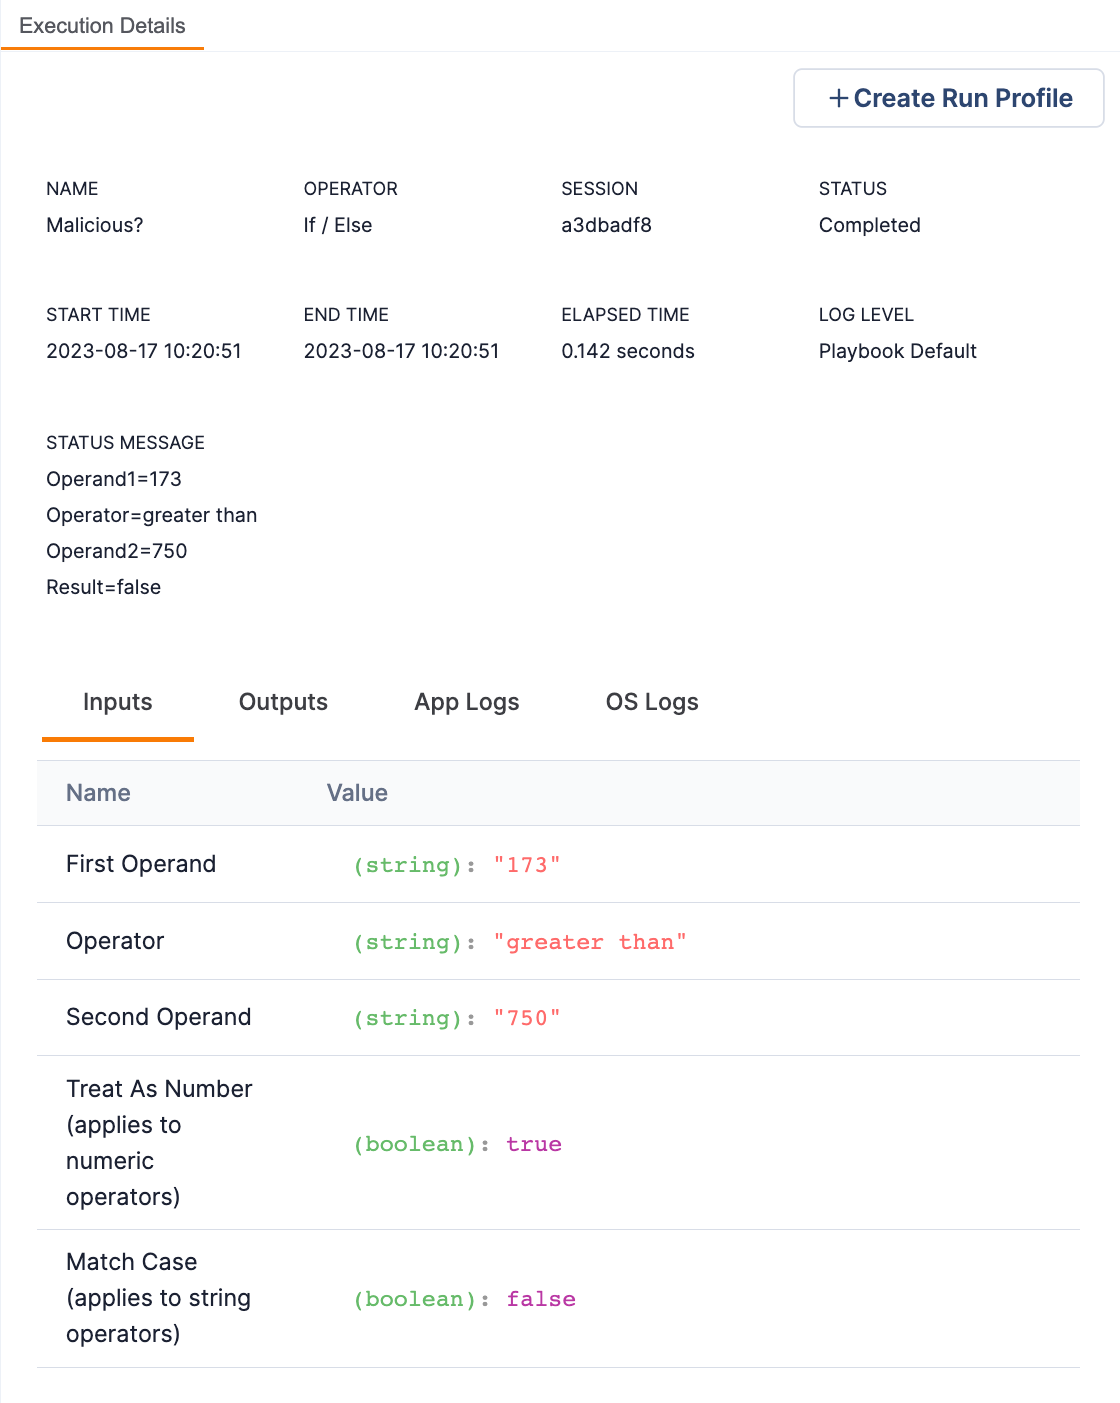
- + Create Run Profile: Click this button to create a Run Profile based on the logged execution for the selected Trigger, App, or Operator. The Create Run Profile window will be displayed. Enter a name for the Run Profile in the Profile Name box, and then click the Save button.
- Inputs: This tab displays the names and values of all inputs passed to the App or Operator. Triggers do not take inputs, so a Trigger will display the text “Trigger Inputs not available” on this tab. Inputs are recorded only when the log level for the App or Operator has been set to DEBUG or TRACE.
- Outputs: This tab displays the names and values of all outputs from the Trigger, App, or Operator. Outputs are recorded only when the log level for the Trigger, App, or Operator has been set to DEBUG or TRACE.
- App Logs: This tab displays the logs for an App. The information provided depends on the log level assigned to the App. You can use the search bar to search for logs based on an entered term. The logs can be downloaded into a .csv file.
- OS Logs: This tab displays the logs generated on the server side of the Playbook execution. It also provides the capability to download all OS logs. The OS logs for the selected App must be downloaded together as a single ZIP file, as you cannot download them individually. For Apps that do not support OS logs, the text “OS Logs not available for this selection” will be displayed on this tab.
If viewing the Execution Details pane for a Component App, a VIEW EXECUTION button will be displayed below the status message. Click this button to display the Execution Details and Execution Graph panes for the selected Component (Figure 6).
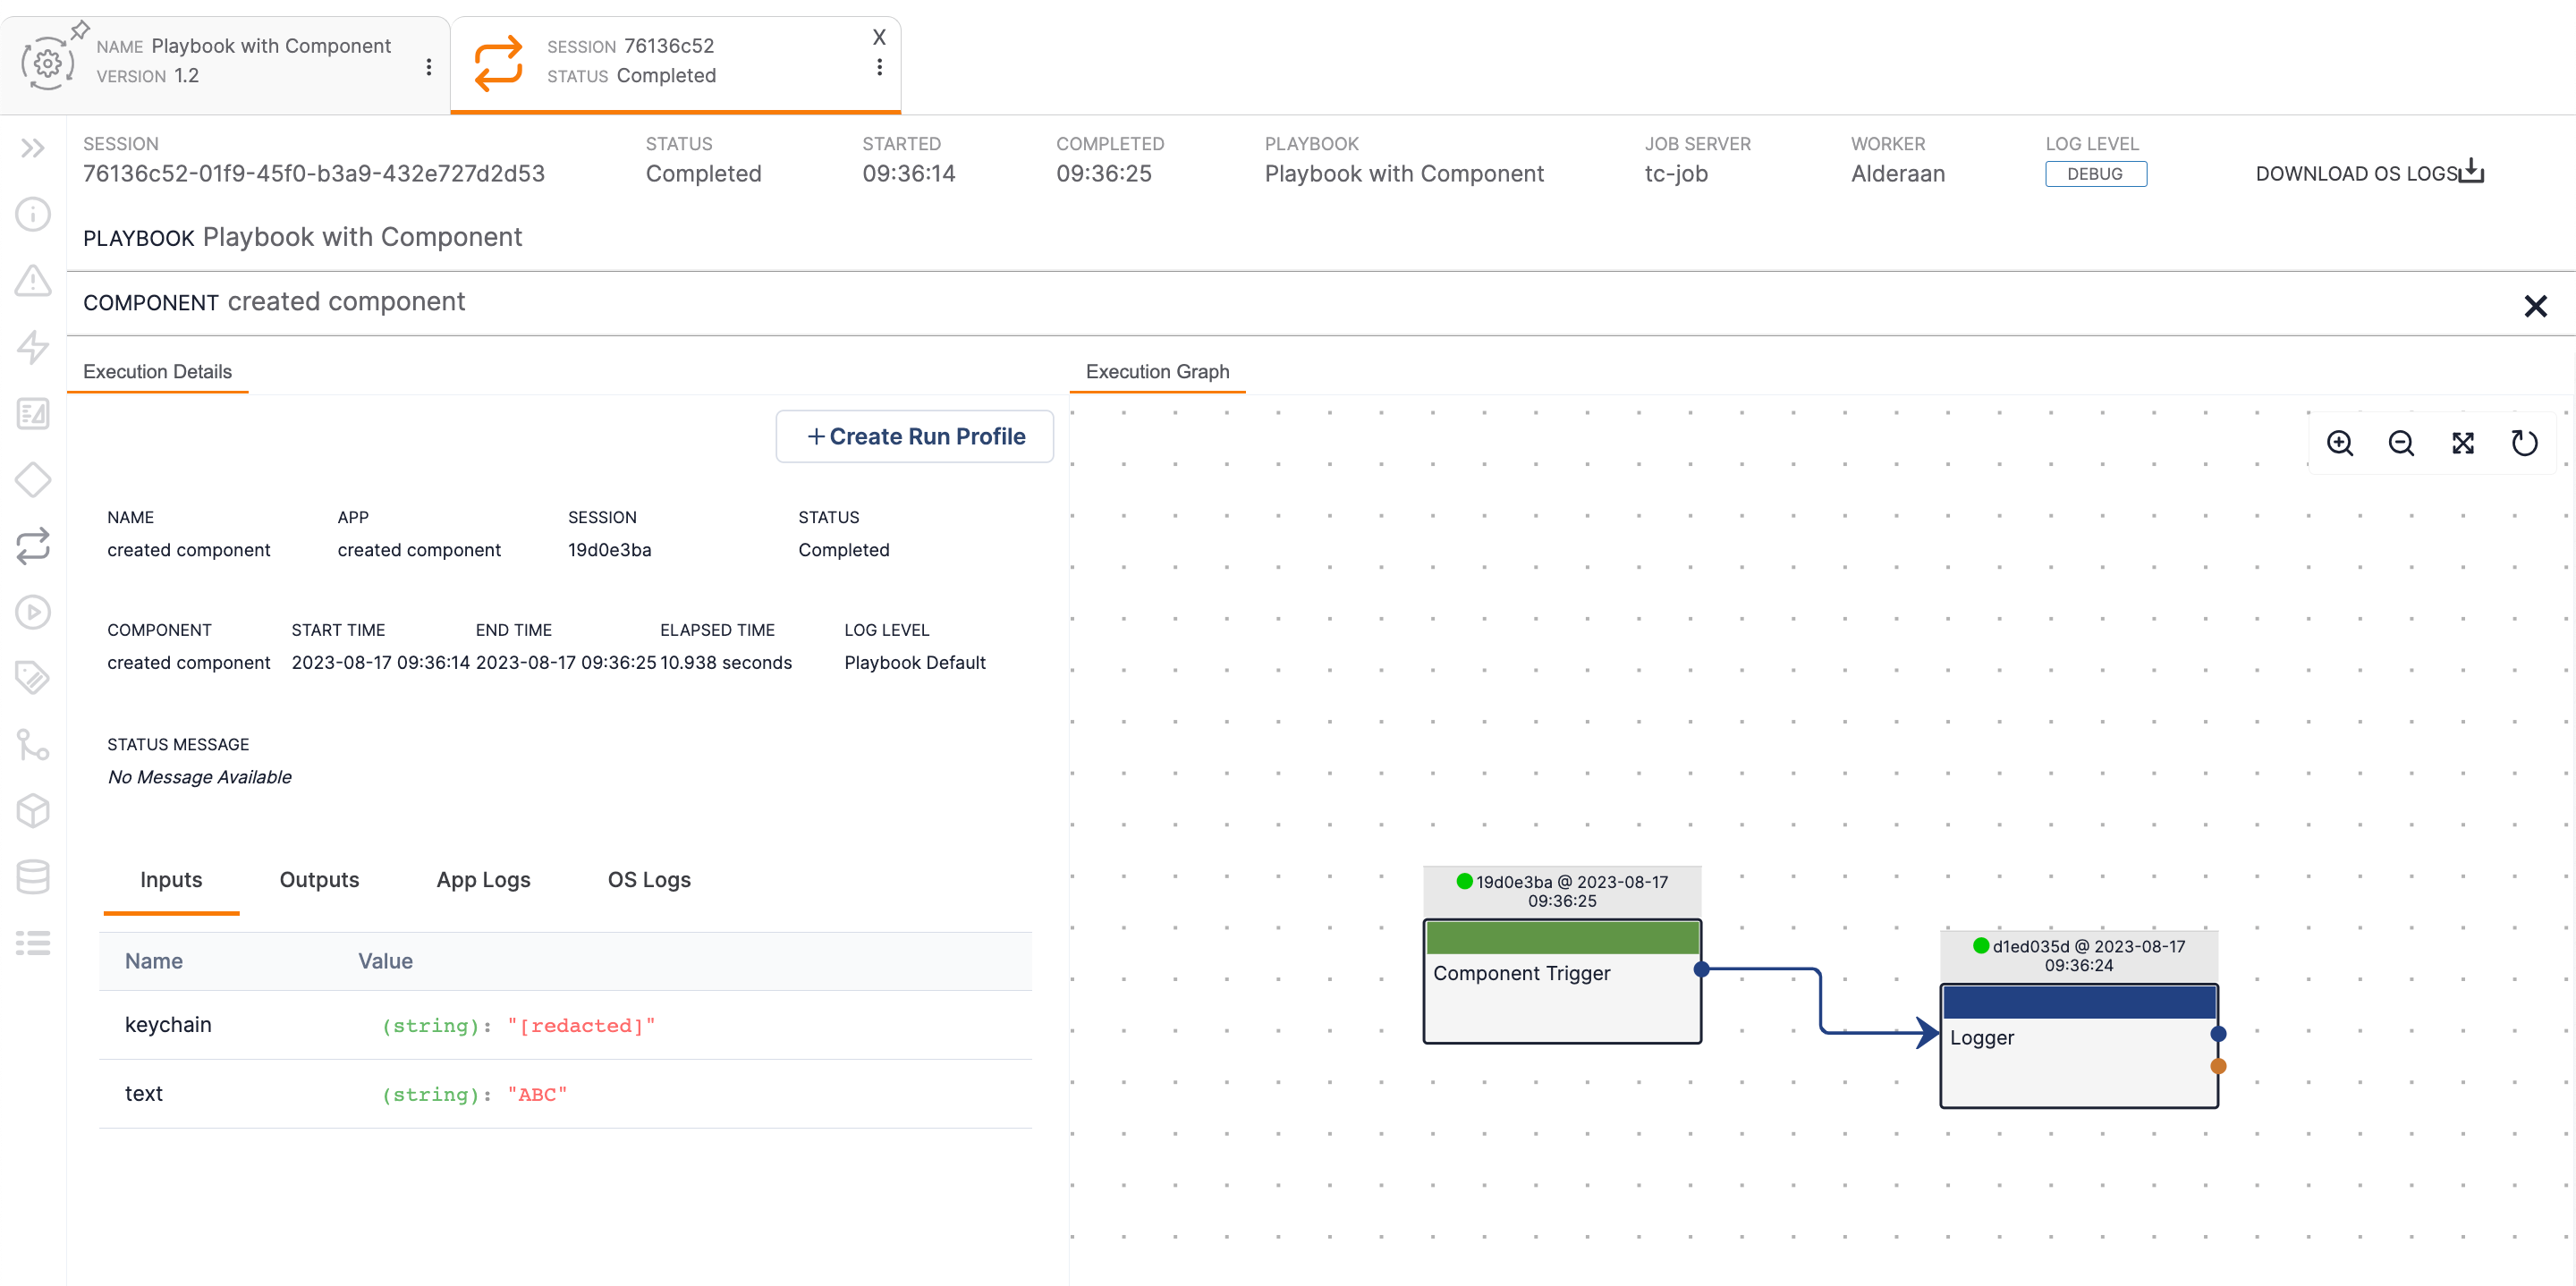
Click Close at the top right to return to the Playbook’s Execution Details and Execution Graph panes.
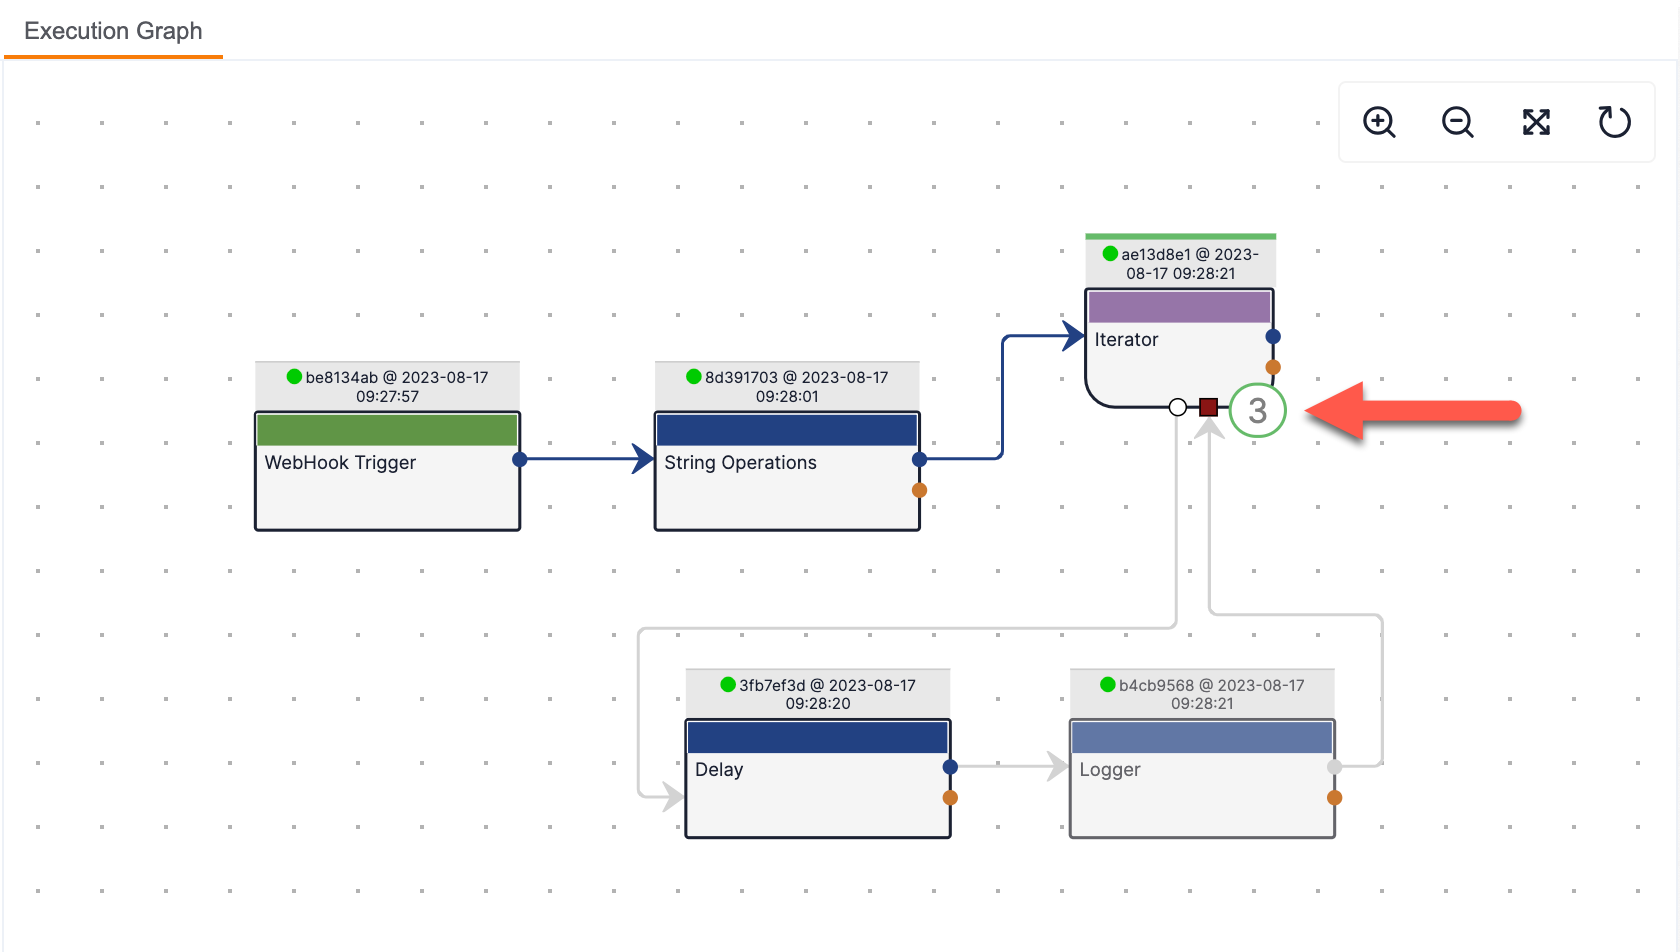
Iterator Index
If viewing the Execution screen for a Playbook that uses an Iterator Operator, like the one in Figure 7, the number of successful iterations will be displayed in the lower-right corner of the Operator displayed in the Execution Graph pane.
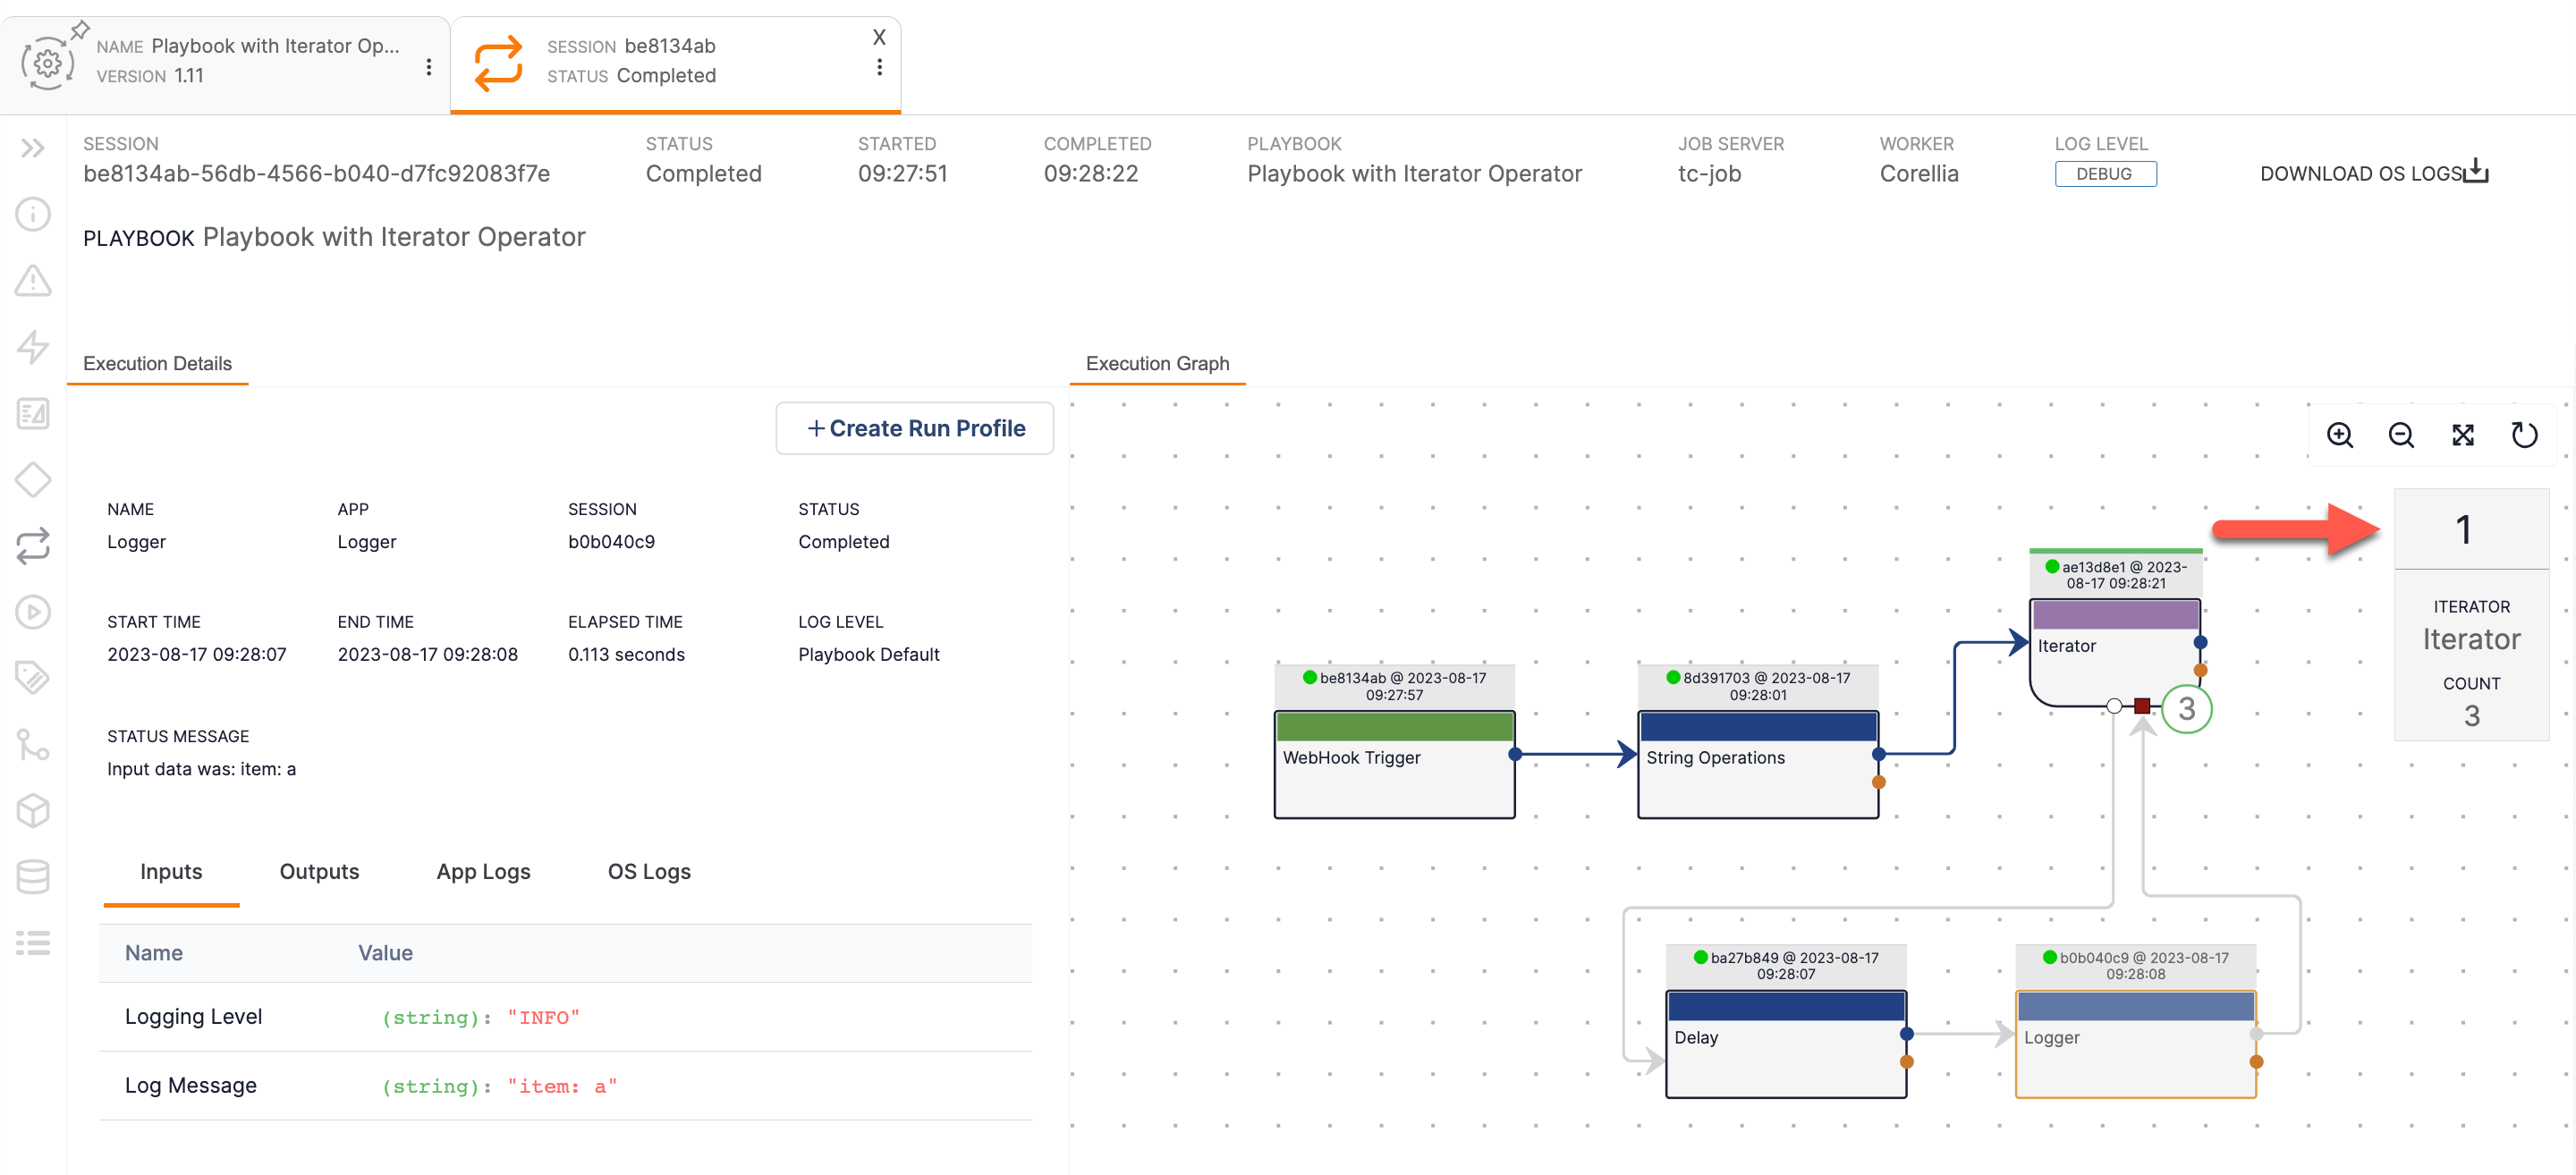
Clicking on an App used in the iteration process will display its Execution Details pane and its Iterator Index on the right side of the Execution Graph pane (Figure 8). Hover over the number displayed at the top of the Iterator Index to display arrows that you can use to navigate between each iteration for the selected App. As you navigate between iterations, the Execution Details pane will automatically update based on the selected iteration.
Viewing an Active Playbook Execution
If viewing the Executions screen for an active Playbook execution, as in Figure 9, the Execution Graph pane will update automatically to indicate the current status of the execution. As the Playbook executes, the graph updates in real time to indicate when Playbook elements are pending execution, currently executing, and finished executing.
After a Playbook element finishes executing, click on it in the Execution Graph pane to display its execution details in the Execution Details pane.
Stopping a Playbook Execution
- ClickExecutions on the side navigation bar of the Playbook Designer to display the Executions pane.
- Hover over the progress indicator to the left of the session ID for an active Playbook execution. A Kill button will be displayed (Figure 10).
- Click the Kill button. The Confirm Kill Playbook window will be displayed.
- Click the YES button to stop the Playbook execution.
ThreatConnect® is a registered trademark of ThreatConnect, Inc.
20109-01 v.03.A