Overview
The Playbooks Activity screen in ThreatConnect® is a control panel on which Organization Administrators can monitor Playbook Server and Worker execution metrics, priorities, and processes for their Organization or instance. From this screen, current, present, and past Worker activity and allocation to Servers can be viewed and Playbook executions can be killed. For more information on Playbooks in general, see the Playbooks category.
Before You Start
| Minimum Role(s) |
|
|---|---|
| Prerequisites | Playbook Servers configured and deployed by a System Administrator |
Servers and Workers
A Playbook Server, also known as a Job Server, is a ThreatConnect instance that is dedicated to the execution of Playbooks. Multiple Playbook Servers can be deployed to an instance in order to scale Playbook execution capacity, enable high availability, or isolate resources. Playbook Servers can be designated as Public or Private. Private Playbook Servers enable ThreatConnect Organizations to assign a Playbook to a dedicated instance for resource allocation or quality-of-service needs. Public Playbook Servers are designated to a pool and can be used to scale horizontally for any Organization. See ThreatConnect System Administration Guide for information about configuring and deploying Playbook Servers.
A Playbook Worker is an embedded process in a Playbook Server responsible for executing orchestration logic in a queue. A Worker can execute only one Playbook at a time, and multiple Workers can exist inside a Playbook Server. The maximum number of Workers is limited by the hardware capacity of the Playbook Server.
The Playbooks Activity Screen
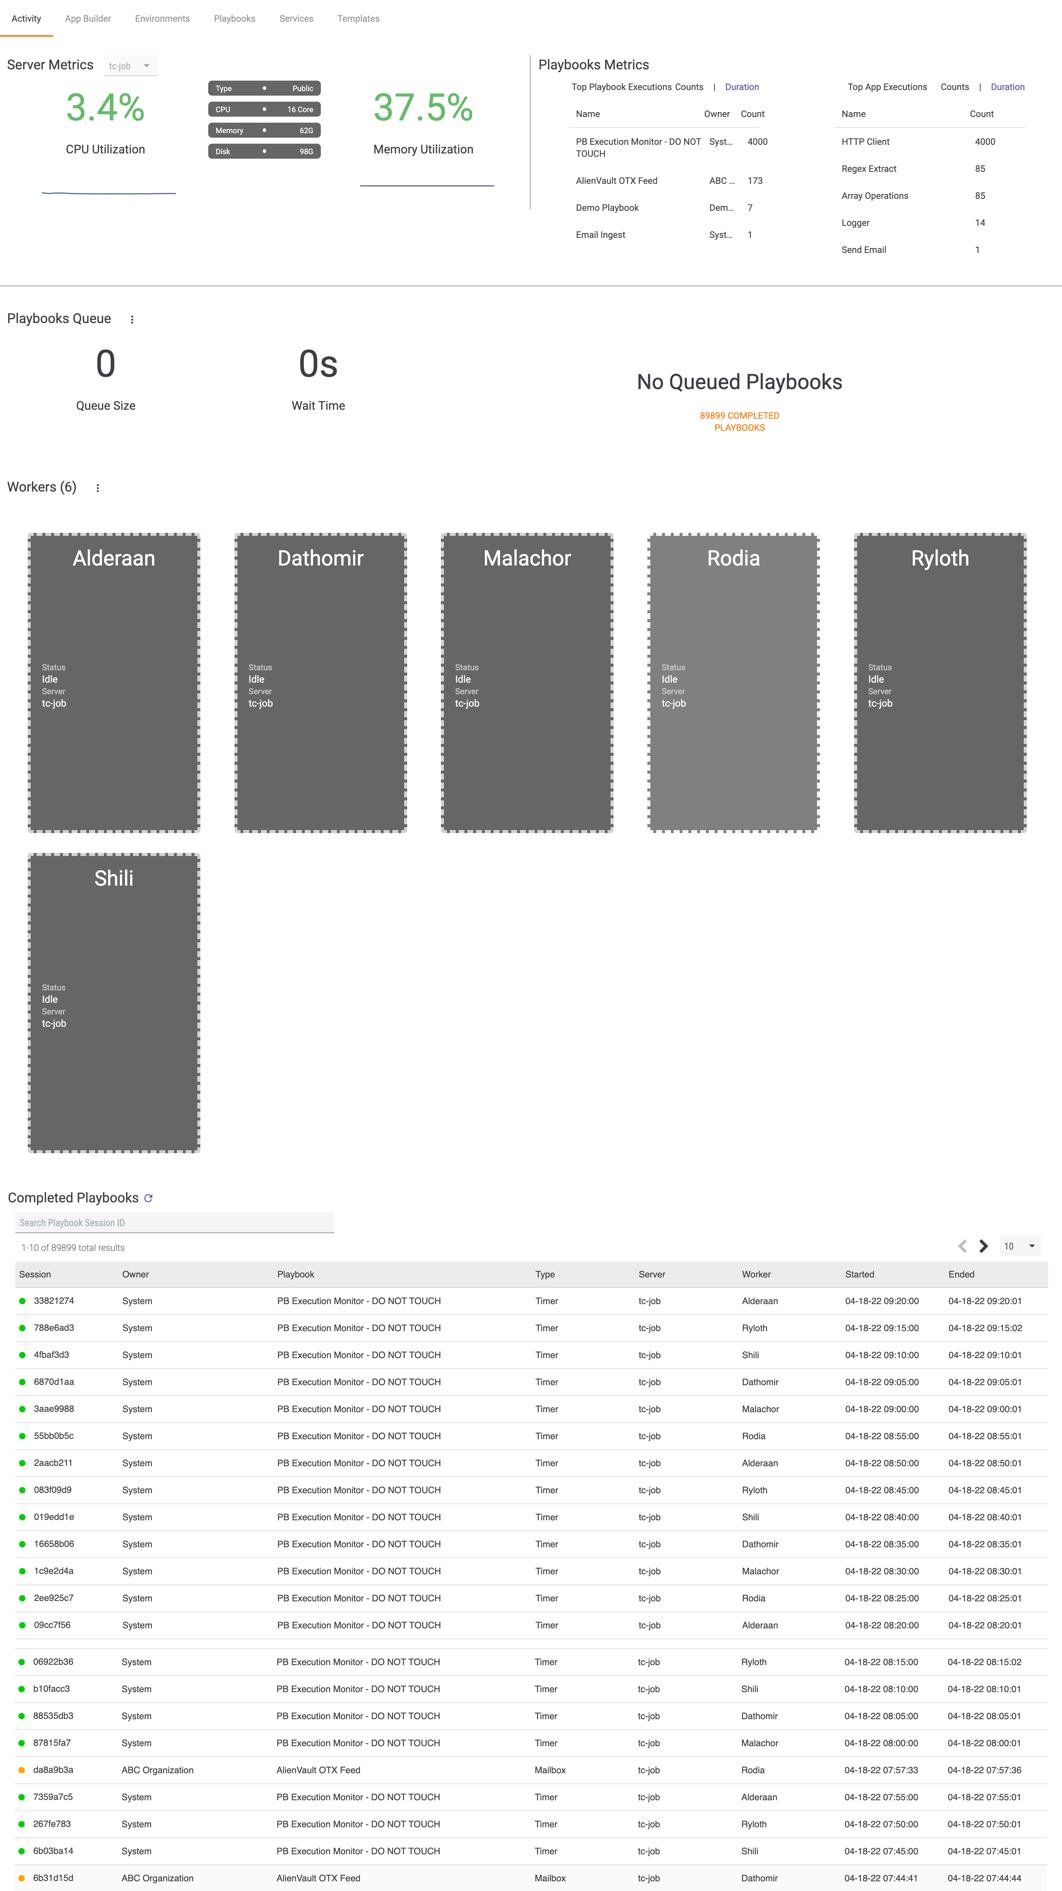
On the top navigation bar, hover the cursor over Playbooks, and select Activity. The Activity screen will be displayed (Figure 1). This screen provides metrics and other information on the Playbook Servers, Workers, and queued and completed Playbooks for your Organization or instance.
Server Metrics
The Server Metrics section (see Figure 1) provides metrics about the Playbook Servers available to your ThreatConnect instance, including the following information:
- CPU Utilization: This metric specifies the current usage of the CPU of the instance by the selected Playbook Server.
- Memory Utilization: This metric specifies the current usage of the memory of the system by the selected Playbook Server.
- Type: This metric specifies whether the server is a Public Server or a Private Server.
- CPU, Memory, and Disk: These metrics specify information about the hardware configuration of the Playbook Server.
Use the dropdown menu at the top of the Server Metrics section to select a Server for which to view information. Private Servers will be designated by a lock icon next to their name. In a multi-tenant instance of ThreatConnect, Private Servers are dedicated instances on which users in an Organization can run a Playbook rather than have the Playbook execute through the queue of the pool of Public Servers (i.e., the Default Server Pool). Private Servers should be used for Playbooks of priority or performance requirements that necessitate their execution outside of the Default Server Pool.
Playbook Metrics
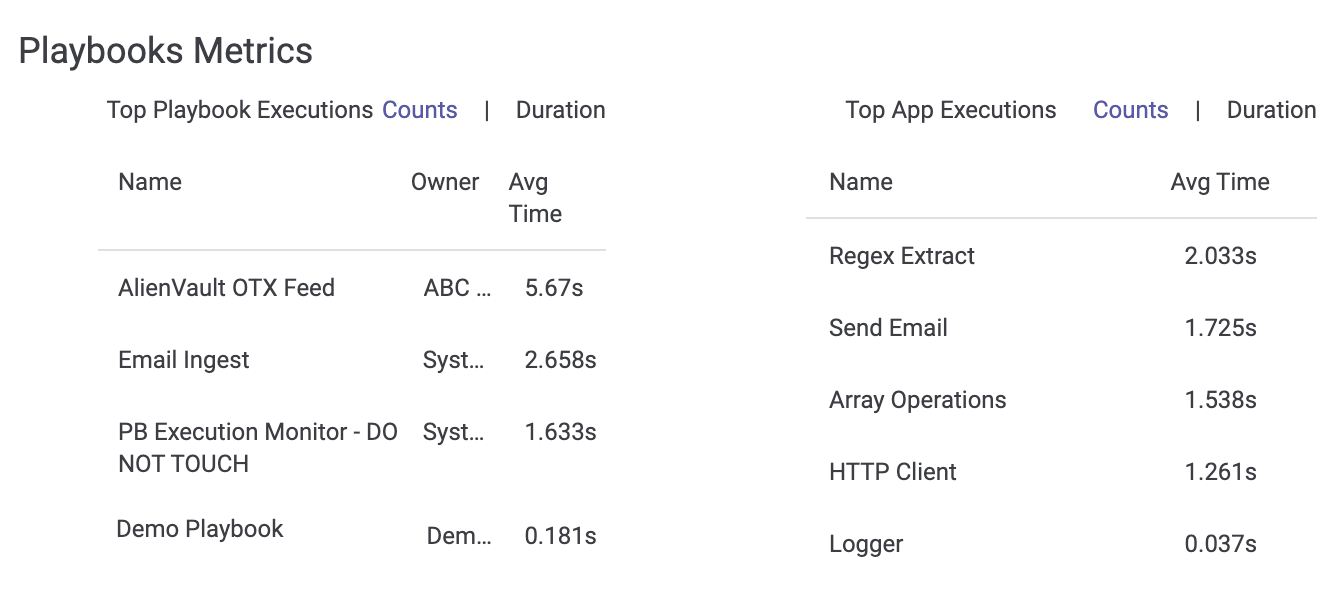
The Playbook Metrics section (see Figure 1) provides metrics about the top Playbook and App executions in your Organization (for Organization Administrators) or on your instance (for System Administrators) that have run on all Servers available to your instance. If the Counts columns are selected, as in Figure 1, the section provides information about the number of executions of those Playbooks and Apps that have executed the most. If the Duration columns are selected, as in Figure 2, the section provides information about the average amount of time it took for the Playbooks and Apps that have had the longest execution durations to execute.
Playbooks Queue
The Playbooks Queue section (see Figure 1) provides the following information about the queue of Playbooks waiting for execution in your Organization or on your instance:
- Queue Size: This section provides the number of Playbooks in the queue. The number changes in real time as Playbooks move through the queue and are executed.
- Wait Time: This section provides an estimate of the number of seconds that a Playbook will wait for execution if it just got added to the queue.
- Queued Playbooks: This section lists the Playbooks that are in the queue, including their name, owner, and count (i.e., how many executions are queued for that particular Playbook).
- Completed Playbooks: This section displays the number of Playbooks that have been completed in your Organization or on your instance. Clicking on it causes the screen to scroll down to the list of completed Playbooks. (See the “Completed Playbooks” section for more information.)
Figure 3 shows what the Playbooks Queue section looks like when there are Playbooks in the queue.

Each Playbook’s name is a link that, when clicked, will display the Playbook in the Playbook Designer.
Queue Administration
The vertical ellipsis menu at the top left of the Playbooks Queue section, which is available only for System Administrators, provides three options for administrating the Playbooks queue:
- Pause Queue: Select this option to prevent new Playbook executions from occurring.
- Resume Queue: After the queue has been paused, select this option to resume Playbook executions.
- Flush Queue: Select this option to remove all messages from the queue.
Workers
The Workers section (see Figure 1) provides the number of Workers available to your instance (in parentheses after the Workers heading) and rectangular boxes that represent each Worker.
Worker Details
Each Worker is represented by a card, as shown in Figure 4 for the idle Worker named Naboo and in Figure 5 for the active Worker named Jedha.
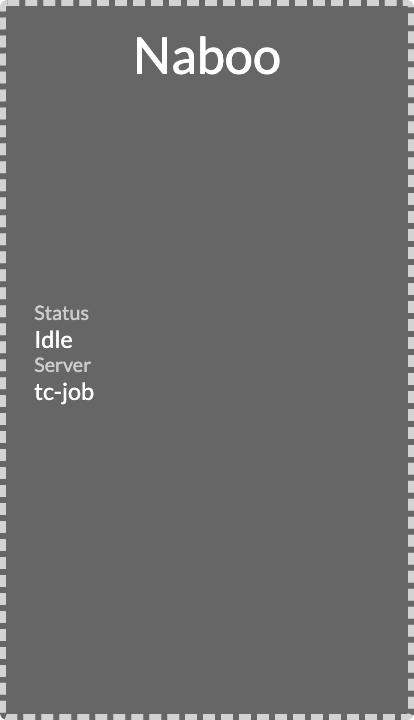
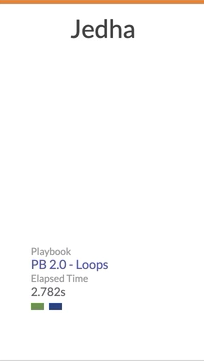
A Worker’s card provides the following information:
- Status or Playbook: If this section displays the Status heading, then it will also indicate that the Worker is idle. If the Worker is active, then the heading will change to Playbook, and it will display the name of the Playbook that the Worker is currently executing.
- Server or Elapsed Time: For idle Workers, this section displays the Server on which the Worker is operating. For active Workers, this section displays the amount of Elapsed Time for which the Worker has been executing the Playbook.
- Colored Boxes: The colored boxes at the bottom of an active Playbook provide a linear depiction of the different Triggers, Apps, and Operators in the Playbook. As in the Playbook Designer, Triggers are green rectangles; Apps are blue rectangles; and Operators are black squares (Merge), orange diamonds (If/Else), or blue rectangles (Delay). The Iterator and Break Iterator Operators appear as blue rectangles. If an item (Trigger, App, or Operator) is gray, then it has not yet finished executing.
When a Worker is active, hovering the cursor over its card will provide the display in Figure 6. If you hover the cursor over one of the colored boxes, a bubble with the name of the Trigger, App, or Operator will be displayed, as shown in the figure.
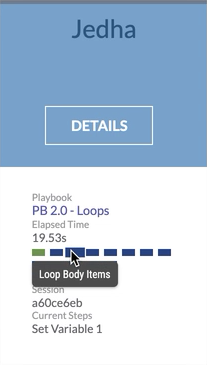
This view provides the following additional information:
- Session: The unique session identification number that is assigned to each Playbook execution.
- Current Steps: The App(s) that are currently being executed.
Click the DETAILS button at the top of the card to display the Worker drawer (Figure 7).
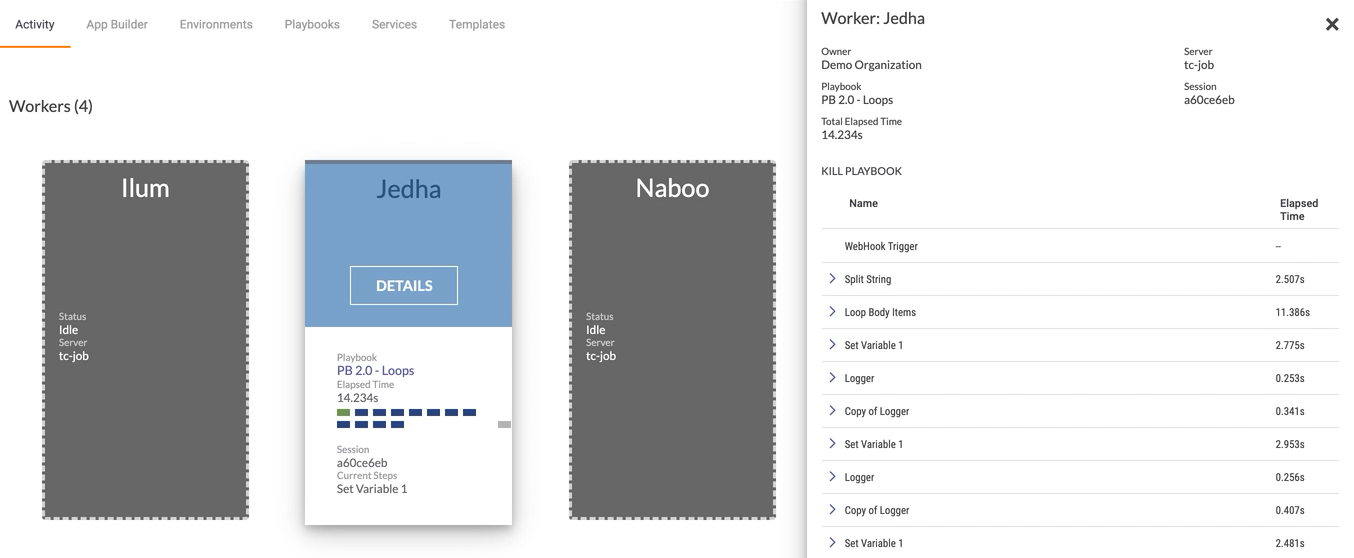
The Worker drawer provides information on the Owner of the Playbook being executed, the Server on which the Worker is operating, the Playbook that the Worker is currently executing, the Session identification number for the execution, the Total Elapsed Time for the current Playbook execution, and a table containing a breakdown of the execution status for the Apps in the Playbook.
Stopping a Playbook Execution
Click the KILL PLAYBOOK button in the Worker drawer (Figure 7) to stop a Playbook’s execution.
Worker Count
The vertical ellipsis menu at the top left of the Workers section, which is only available for System Administrators, provides an option for changing the Worker count on your instance. Once you have selected a new number of Workers, refresh the screen to see the changes. Note that the names of some of the Workers may change after the Worker count has been changed.
Completed Playbooks
The Completed Playbooks section (see Figure 1) provides a list of all Playbooks that have been executed in your Organization (for Organization Administrators) or on your instance (for System Administrators), including the following information:
- Session: The unique session identification number for each Playbook execution. The colored circle to the left of the session identification number indicates whether a Playbook’s execution was successful (green), partially failed (orange), or completely failed (red).
- Owner: The name of the owner for each executed Playbook.
- Playbook: The name of the Playbook that was executed.
- Type: The Trigger type of the Playbook.
- Server: The name of the Server on which the Playbook executed.
- Worker: The name of the Worker that executed the Playbook.
- Started: The date and time when the Playbook execution started.
- Ended: The date and time when the Playbook execution ended. If a Playbook execution was stopped, no time will be listed in this column.
Click anywhere in one of the rows to open the Execution screen for that particular execution as a new tab in the Playbook Designer, displaying the pathway that the Playbook took for the execution in the Execution Graph pane (Figure 8).
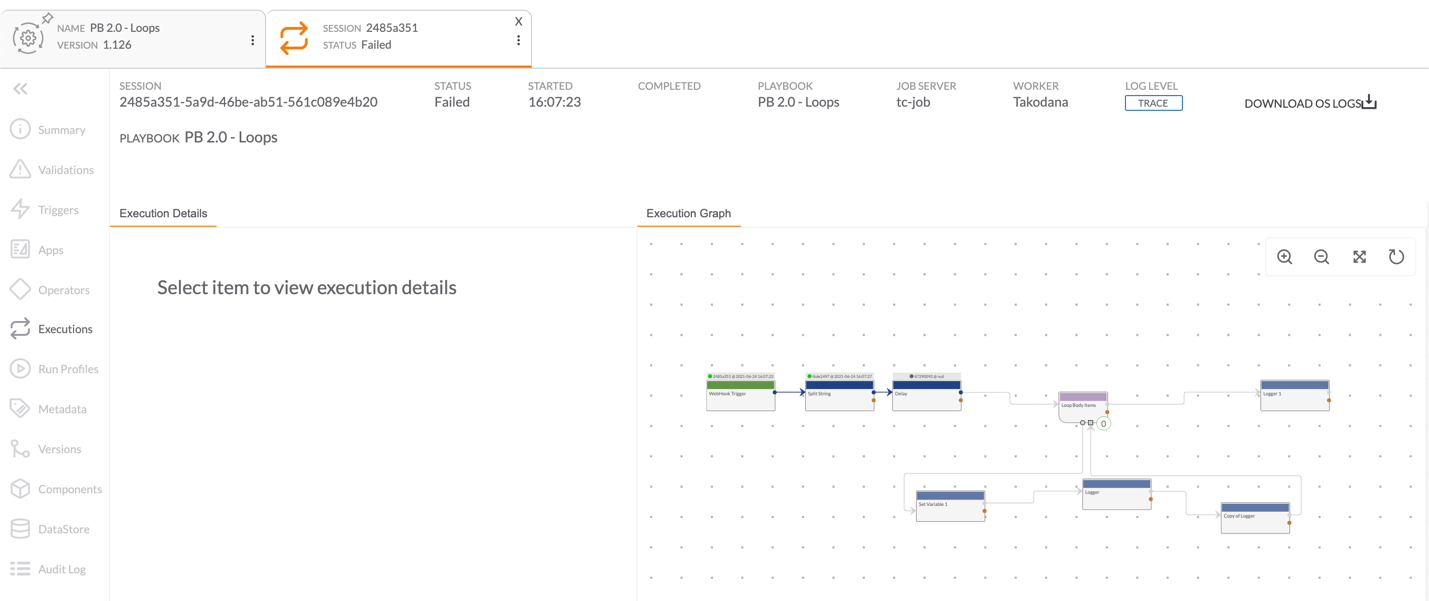
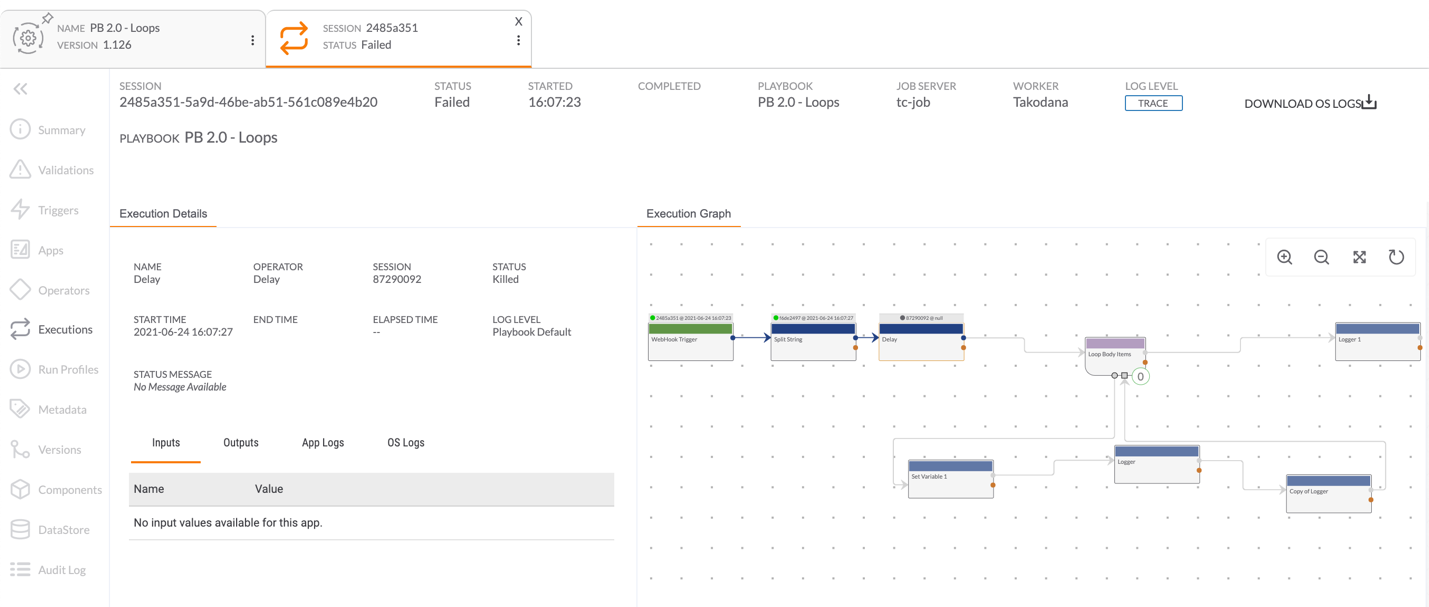
Playbooks that were stopped will have a status of Failed. The status of the App that was running when the Playbook was stopped will be listed as Killed in the Execution Details pane when that App is selected in the Execution Graph pane of the Execution screen (Figure 9).
ThreatConnect® is a registered trademark of ThreatConnect, Inc.
20079-01 v.03.B