Adjusting View and Layout in Threat Graph
- 22 Jan 2025
- 5 Minutes to read
-
Print
-
DarkLight
-
PDF
Adjusting View and Layout in Threat Graph
- Updated on 22 Jan 2025
- 5 Minutes to read
-
Print
-
DarkLight
-
PDF
Article summary
Did you find this summary helpful?
Thank you for your feedback!
Overview
The Threat Graph feature in ThreatConnect® provides a graph-based interface that you can use to discover, visualize, and contextualize associations and relationships between Indicators, Groups, Cases, and Tags. As you pivot in Threat Graph and add nodes to the graph, you may want to adjust your view of the graph or rearrange nodes to ensure you focus on the objects that matter most to your investigation. Threat Graph provides five layout options that enable you to quickly visualize your data in different ways, which may help you notice relationships and trends that were unclear or previously overlooked or prompt you to adjust your analytical conclusions.
Before You Start
User Roles
- To adjust the view settings and layout of nodes in Threat Graph, your user account can have any Organization role.
Rearranging Nodes
Individual Node
Follow these steps to reposition an individual node in Threat Graph:
- Open Threat Graph.
- Click and hold a node on the graph.
- Drag the node to the desired location on the graph, and then release the node.
Multiple Nodes
Follow these steps to reposition multiple nodes at once in Threat Graph:
- Open Threat Graph.
- Ensure there is at least one other node on the graph in addition to the origin node. If there are no other nodes on the graph except for the origin node, pivot in ThreatConnect, CAL™, or an enrichment service to add nodes.
- Press and hold the CTRL key on your keyboard.
- Drag and select a group of nodes on the graph, and then release the CTRL key on your keyboard.
- Drag the selected nodes to the desired location on the graph, and release the nodes.
Adjusting Zoom Settings
You can use the following options in the toolbar at the top left of the graph to adjust the zoom settings in Threat Graph:
- Zoom In
 : Zoom in to see more details on the graph.
 - Zoom Out
 : Zoom out to see more objects on the graph.
 - Zoom to Fit
 : Adjust the zoom automatically to show all objects on the graph.
 - Scroll to zoom: Click Settings
 in the Threat Graph legend and select the Enable scroll to zoom checkbox to zoom in and out by scrolling your mousewheel.
Important
This setting is specific to your user account and applies to all graphs you view in ThreatConnect.
Showing and Hiding Data
The Threat Graph legend (Figure 1) includes a scrollable list of object types and labels that can be shown on the graph. It also provides a key that defines the node border scheme for objects on the graph that belong to multiple ThreatConnect owners and color scheme for arrows corresponding to CAL relationships (CAL Intelligence), enrichment service relationships (Enrichment Intel), and ThreatConnect associations (ThreatConnect).
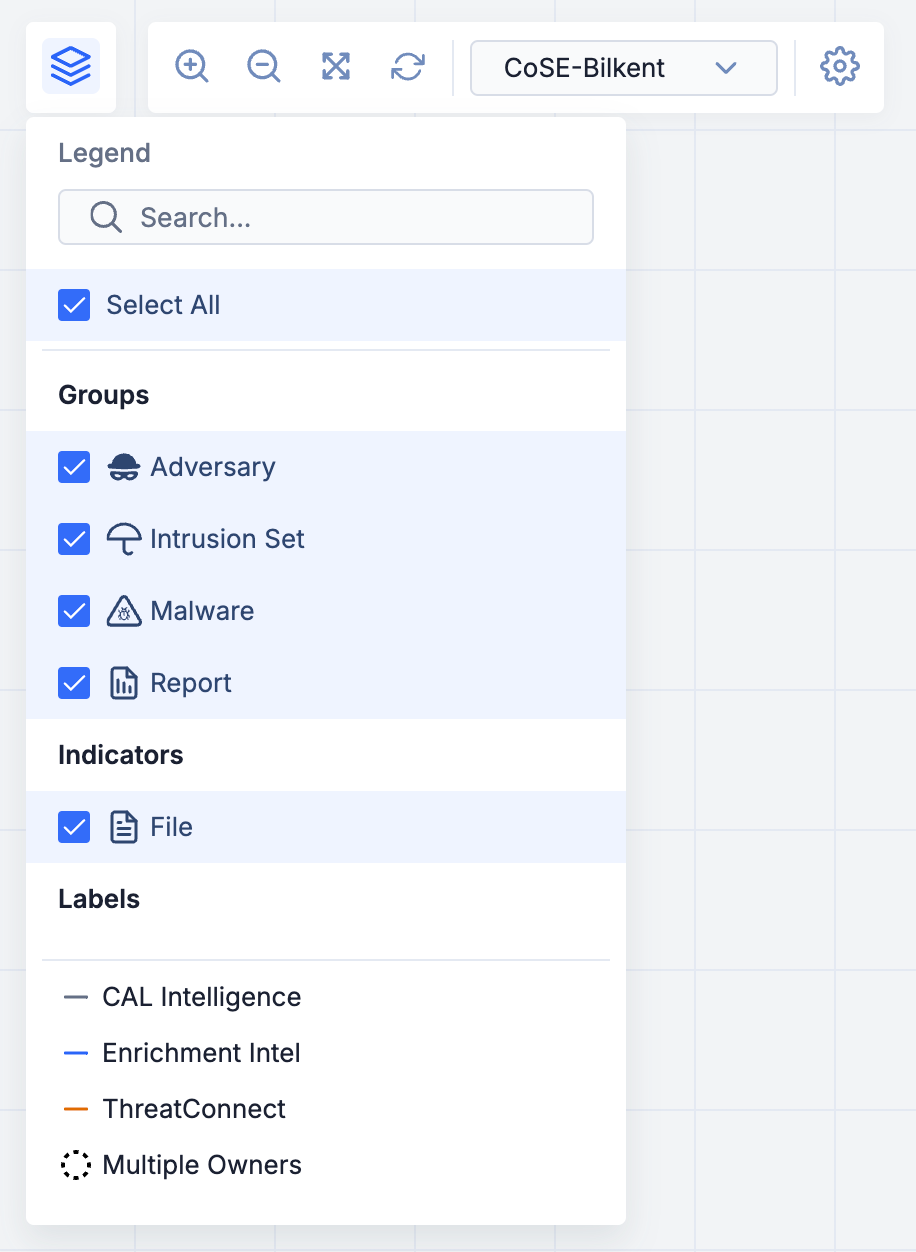
Note
Only object types that are available on the graph will be displayed in the legend.
Follow these steps to use the Threat Graph legend to show and hide items on the graph. By default, all types of Indicators, all types of Groups, Cases, Tags, node labels, and connection labels will be shown on the graph.
- Open Threat Graph.
- Click Legend
 in the toolbar at the top left of the graph to open the Threat Graph legend (Figure 1).
 - Select or clear an item’s checkbox in the Groups, Indicators, Other Object Types, or Labels section of the Threat Graph legend to show or hide the item, respectively, on the graph. To view objects of only one type (e.g., Adversary, File), hover over the object in the legend and click View Only This
 .ImportantClearing the checkbox for an object type will hide all nodes corresponding to objects of that type and their respective connections.
Reorganizing the Layout
Layout Options
Threat Graph offers five layout options you can use to visualize your data in different configurations. Select one of the following layouts from the dropdown in the toolbar at the top left of the graph (Figure 2):
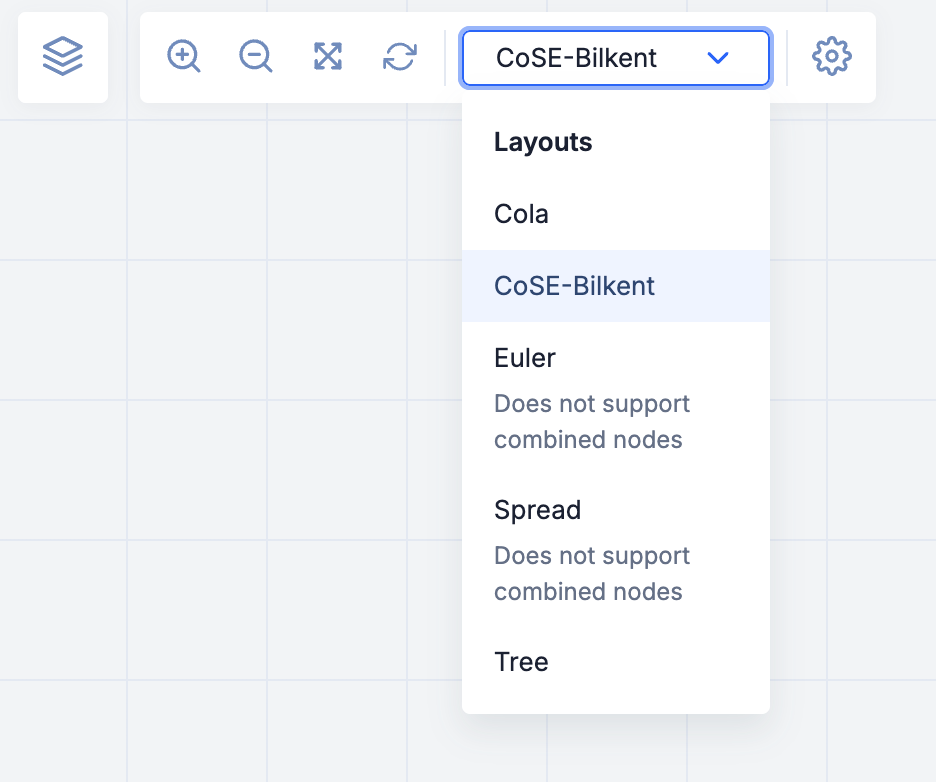
- Cola: This layout clusters nodes around their root, using alternating arrow length to maintain spacing between nodes, It uses long arrows to separate and distinguish between node clusters.
- CoSE-Bilkent: This layout clusters nodes around their root, using alternating arrow length to maintain spacing between nodes. Unlike the Cola layout, it does not use long arrows between clusters, which makes the graph more compact. CoSE-Bilkent is the default layout for new graphs.
- Euler: This layout arranges nodes concentrically around their root using uniform arrow lengths, creating an even, circular configuration.ImportantThe Euler layout does not support combined nodes.
- Spread: This layout maintains the arrangement of the previous layout, but with greater distances between nodes.ImportantThe Spread layout does not support combined nodes.
- Tree: This layout arranges nodes according to a top-down hierarchy.
Note
The arrangement of a layout may be influenced by the previously selected layout. For example, changing the layout of a graph from Tree to Cola and from CoSE-Bilkent to Cola may result in two different Cola arrangements.
Auto-Layout
If you want Threat Graph to automatically rearrange a graph’s layout to incorporate new nodes added via pivots, click Settingsin the Threat Graph legend and select the Enable auto-layout checkbox. Leave the Enable auto-layout checkbox cleared if you want new nodes added via pivots to be stacked on the left side of a graph so you can arrange them in the graph’s existing configuration yourself.
Important
This setting is turned on by default and applies only to the graph you are viewing. When you save a graph, the selection for the setting will be saved for the graph as well.
Refresh Layout
As you pivot in Threat Graph and rearrange nodes on the graph, the arrangement of nodes may become disorganized and difficult to follow. To restore the default arrangement for the currently selected layout, click Refresh current layout in the toolbar at the top left of Threat Graph.
Reset Graph
If you are working with an unsaved graph and want to reset the graph so that it only contains the origin node, refresh the browser tab in which Threat Graph is open.
Note
If you try to refresh, navigate away from, or close the browser tab displaying an unsaved graph or a saved graph with unsaved changes, you will be prompted to confirm the intended action, as doing so will result in the loss of any unsaved changes. For instructions on saving and exporting graphs, see Saving, Exporting, and Managing Graphs in Threat Graph.
ThreatConnect® is a registered trademark, and CAL™ is a trademark, of ThreatConnect, Inc.
20117-07 v.06.A
Was this article helpful?