Figure 1 shows the Associations card in graph view for the verybadguy.com Host Indicator. Graph view displays the Indicators, Groups, Victim Assets, and Tags associated to the primary object (i.e., the object that is the subject of the Details screen and the central node of the associations graph). All of the objects associated to the primary object are considered first-level associations, because they are directly associated to the primary object.
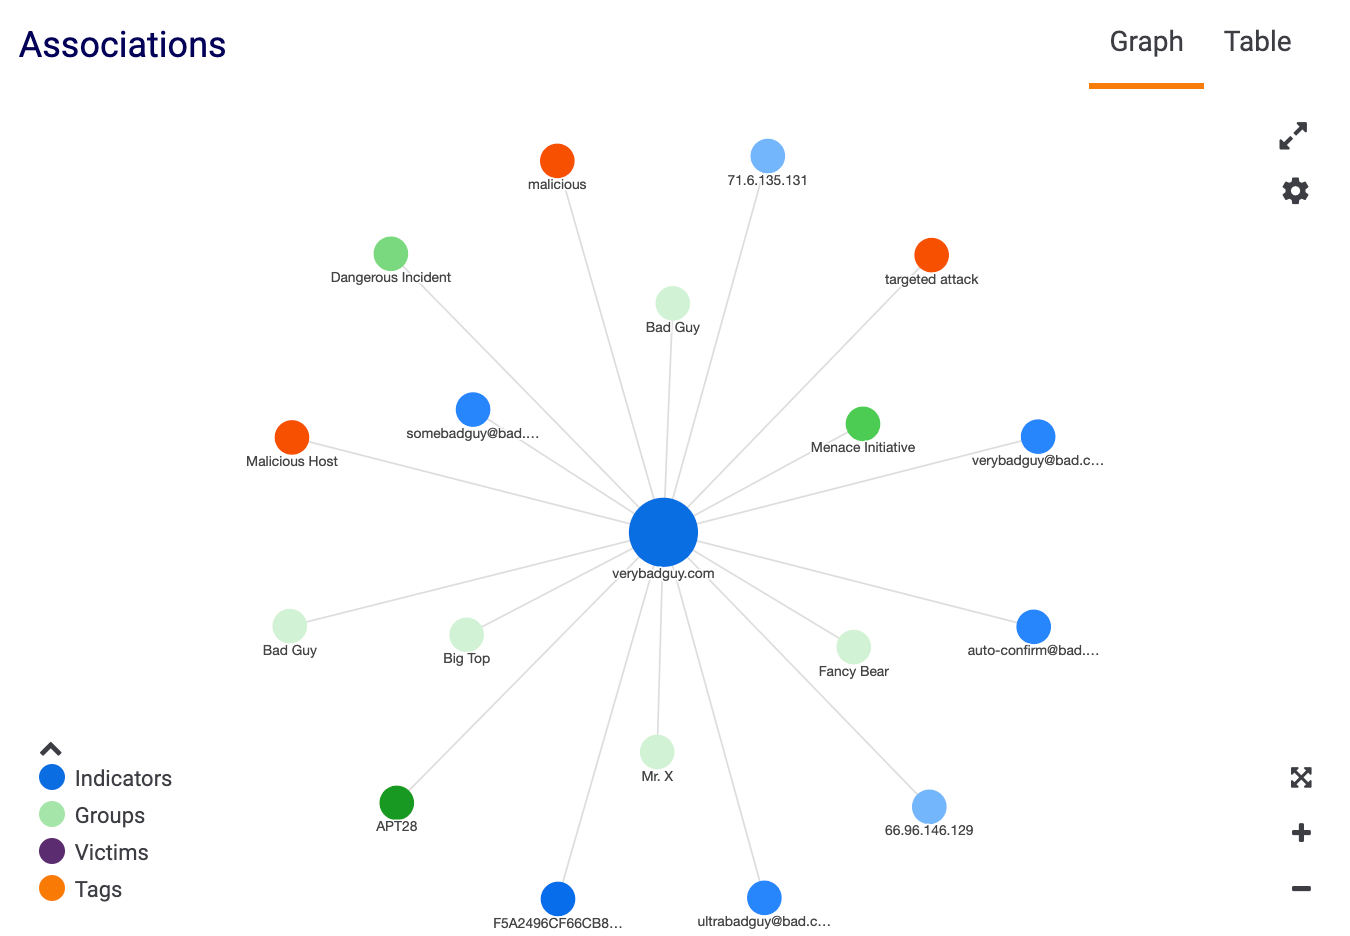
Some of the associated objects may be associated to an object of the same name in a different owner rather than to the primary object itself. For example, in Figure 1, the Host Indicator verybadguy.com is owned by Demo Organization, but some of the objects associated to it have a different owner (e.g., Demo Community) and are associated to a verybadguy.com Host Indicator in Demo Community rather than to the verybadguy.com Host Indicator in Demo Organization.
If an association is displayed in graph view, but not in table view, then the associated object is associated to an object of the same name in a different owner than that of the primary object. Similarly, some of the associated objects may belong to owners other than the owner of the primary object if cross-owner associations are enabled on your ThreatConnect instance.
The legend at the lower-left corner of the graph provides a summary of the main color shade that corresponds to each type of object displayed in the graph. Hover the cursor over the legend to see a detailed breakdown of colors that correspond to each type of Indicator, Group, and Victim Asset, as well as Tags.
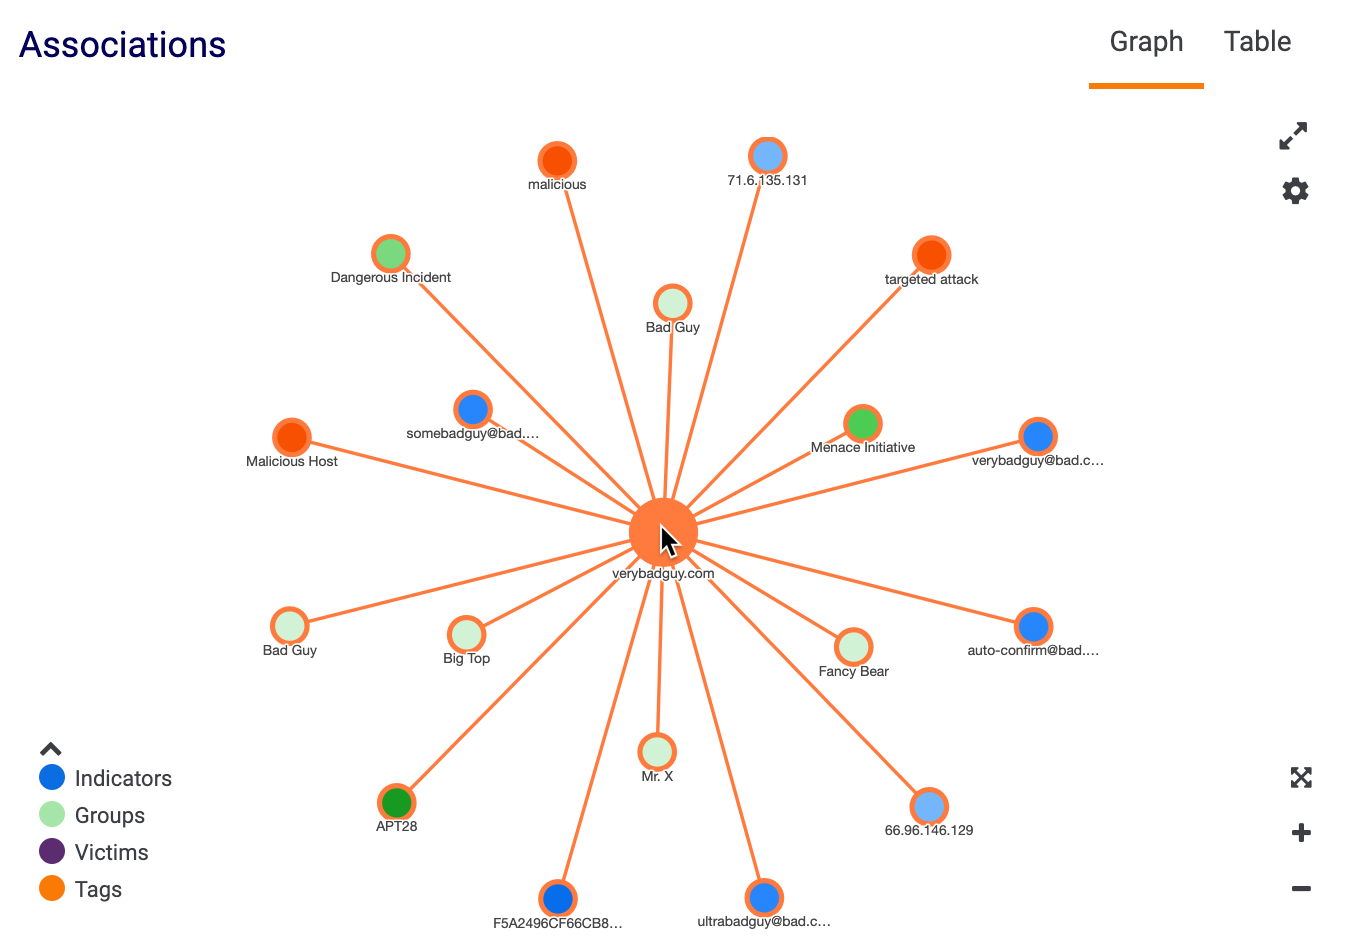
If you hover the cursor over one of the objects in the legend, the object’s label will turn orange, and all objects of that type will be highlighted with an orange border in the graph, as shown in Figure 2 for the Adversary object.

Click Expand  at the top right of the card to view the graph in full-screen mode. When in full-screen mode, click Collapse
  to exit from full-screen mode. Use the three buttons at the lower-right corner of the card to zoom the graph to fit in the card, zoom in, and zoom out, respectively.
Hovering the cursor over an object highlights the object and all other objects associated to it. For example, Figure 3 shows how the Associations card looks when you hover the cursor over the Menace Initiative Threat Group, and Figure 4 shows the card when you hover the cursor over the verybadguy.com Host Indicator (i.e., the Indicator that is the subject of the Details screen displaying the Associations card).

Clicking on the association line between two nodes will display the Association Details window for that association. For example, Figure 5 shows the Association Details window that is displayed when you click the line between the verybadguy.com Host Indicator and the Menace Initiative Threat Group.
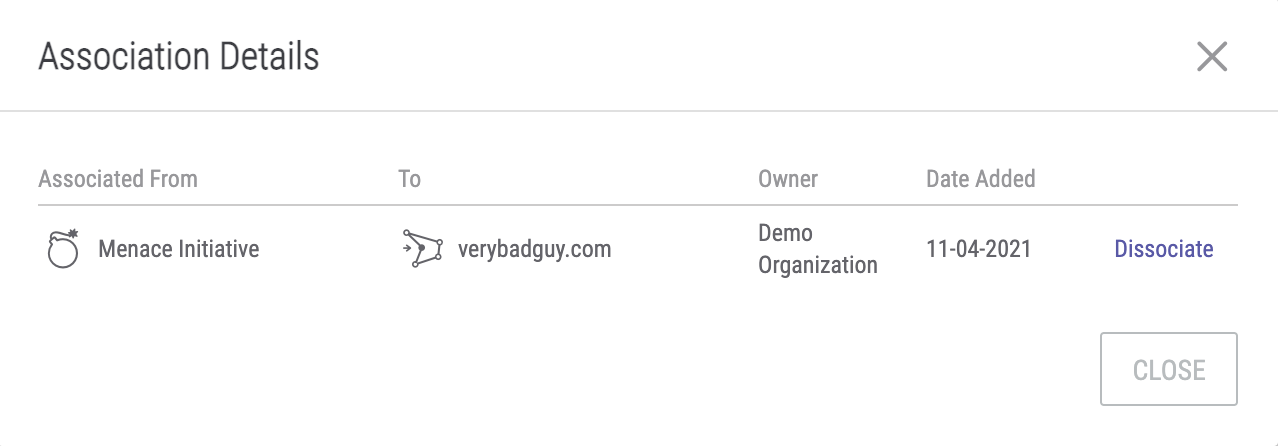
To dissociate the two objects, click Dissociate. This option is not available for objects in a different owner that are associated to an object with the same name as that of the primary object in their owner, as described in the paragraph following Figure 1. Changes to these kinds of associations must be made when viewing the object of the same name in the other owner.
You can move nodes around the graph by clicking and dragging them to the desired location. You can also adjust the lengths of the connections between nodes by clicking and dragging the nodes.
ThreatConnect® is a registered trademark of ThreatConnect, Inc.
20076-03 v.09.B