New Features and Functionality
ThreatConnect® 8.2 builds on the agentic foundation introduced in versions 8.0 and 8.1 and focuses on giving you more context and more control while reducing manual work in your day-to-day processes.
First, this release delivers a unified view for the Indicator Details screen and an accompanying v3 API endpoint for common Indicator data across owners, so that you no longer have to jump between different datasets to get a comprehensive view of an Indicator or deduplicate sets of Indicators that exist in multiple owners when using the v3 API to retrieve or query on Indicators. It also provides a custom view for the Case Details screen, letting you arrange tasks, artifacts, associations, attributes, timeline events, and more in a single view in the order that works best for your investigations.
Version 8.2 delivers a highly impactful refresh of the Indicator confidence deprecation feature, making it easier to view and manage and allowing administrators to use ThreatConnect Query Language (TQL) to define targeted sets of Indicators for deprecation. In addition, this version enables scheduling and dissemination of AI-generated reports and provides native support for MITRE ATLAS™ tactics and techniques. Finally, it introduces a new AI hybrid search feature—currently in beta and available in the Ask AI query agent, agentic playbooks, and a new AI Hybrid Search playbook app—that adds semantic search to existing keyword search functionality so that you can enter natural-language queries and receive results that go beyond keyword matching to include contextually related information.
Unified View: Indicator Details Screen
Version 8.2 adds a unified view to the Details screen for all Indicator types. Similar to the unified view for Vulnerability Groups and Threat Actor Profiles, as well as to the unified view that has been available in the Indicator Details drawer since version 7.7, the unified view for the Indicator Details screen shows all of the information available in all of your owners for a single Indicator in one place, so you no longer need to toggle between owners to compare versions. Use it to evaluate threat ratings across owners, identify the most recently modified version, view attributes and Tags added in different owners, and more. The unified view is read only and includes the Overview, Associations, and Enrichment tabs, all of which provide information about the Indicator in all of its owners that you can access. It does not include the Playbooks and Pinned Association Attributes cards that are provided on the Overview tab when viewing an individual Indicator’s Details screen.
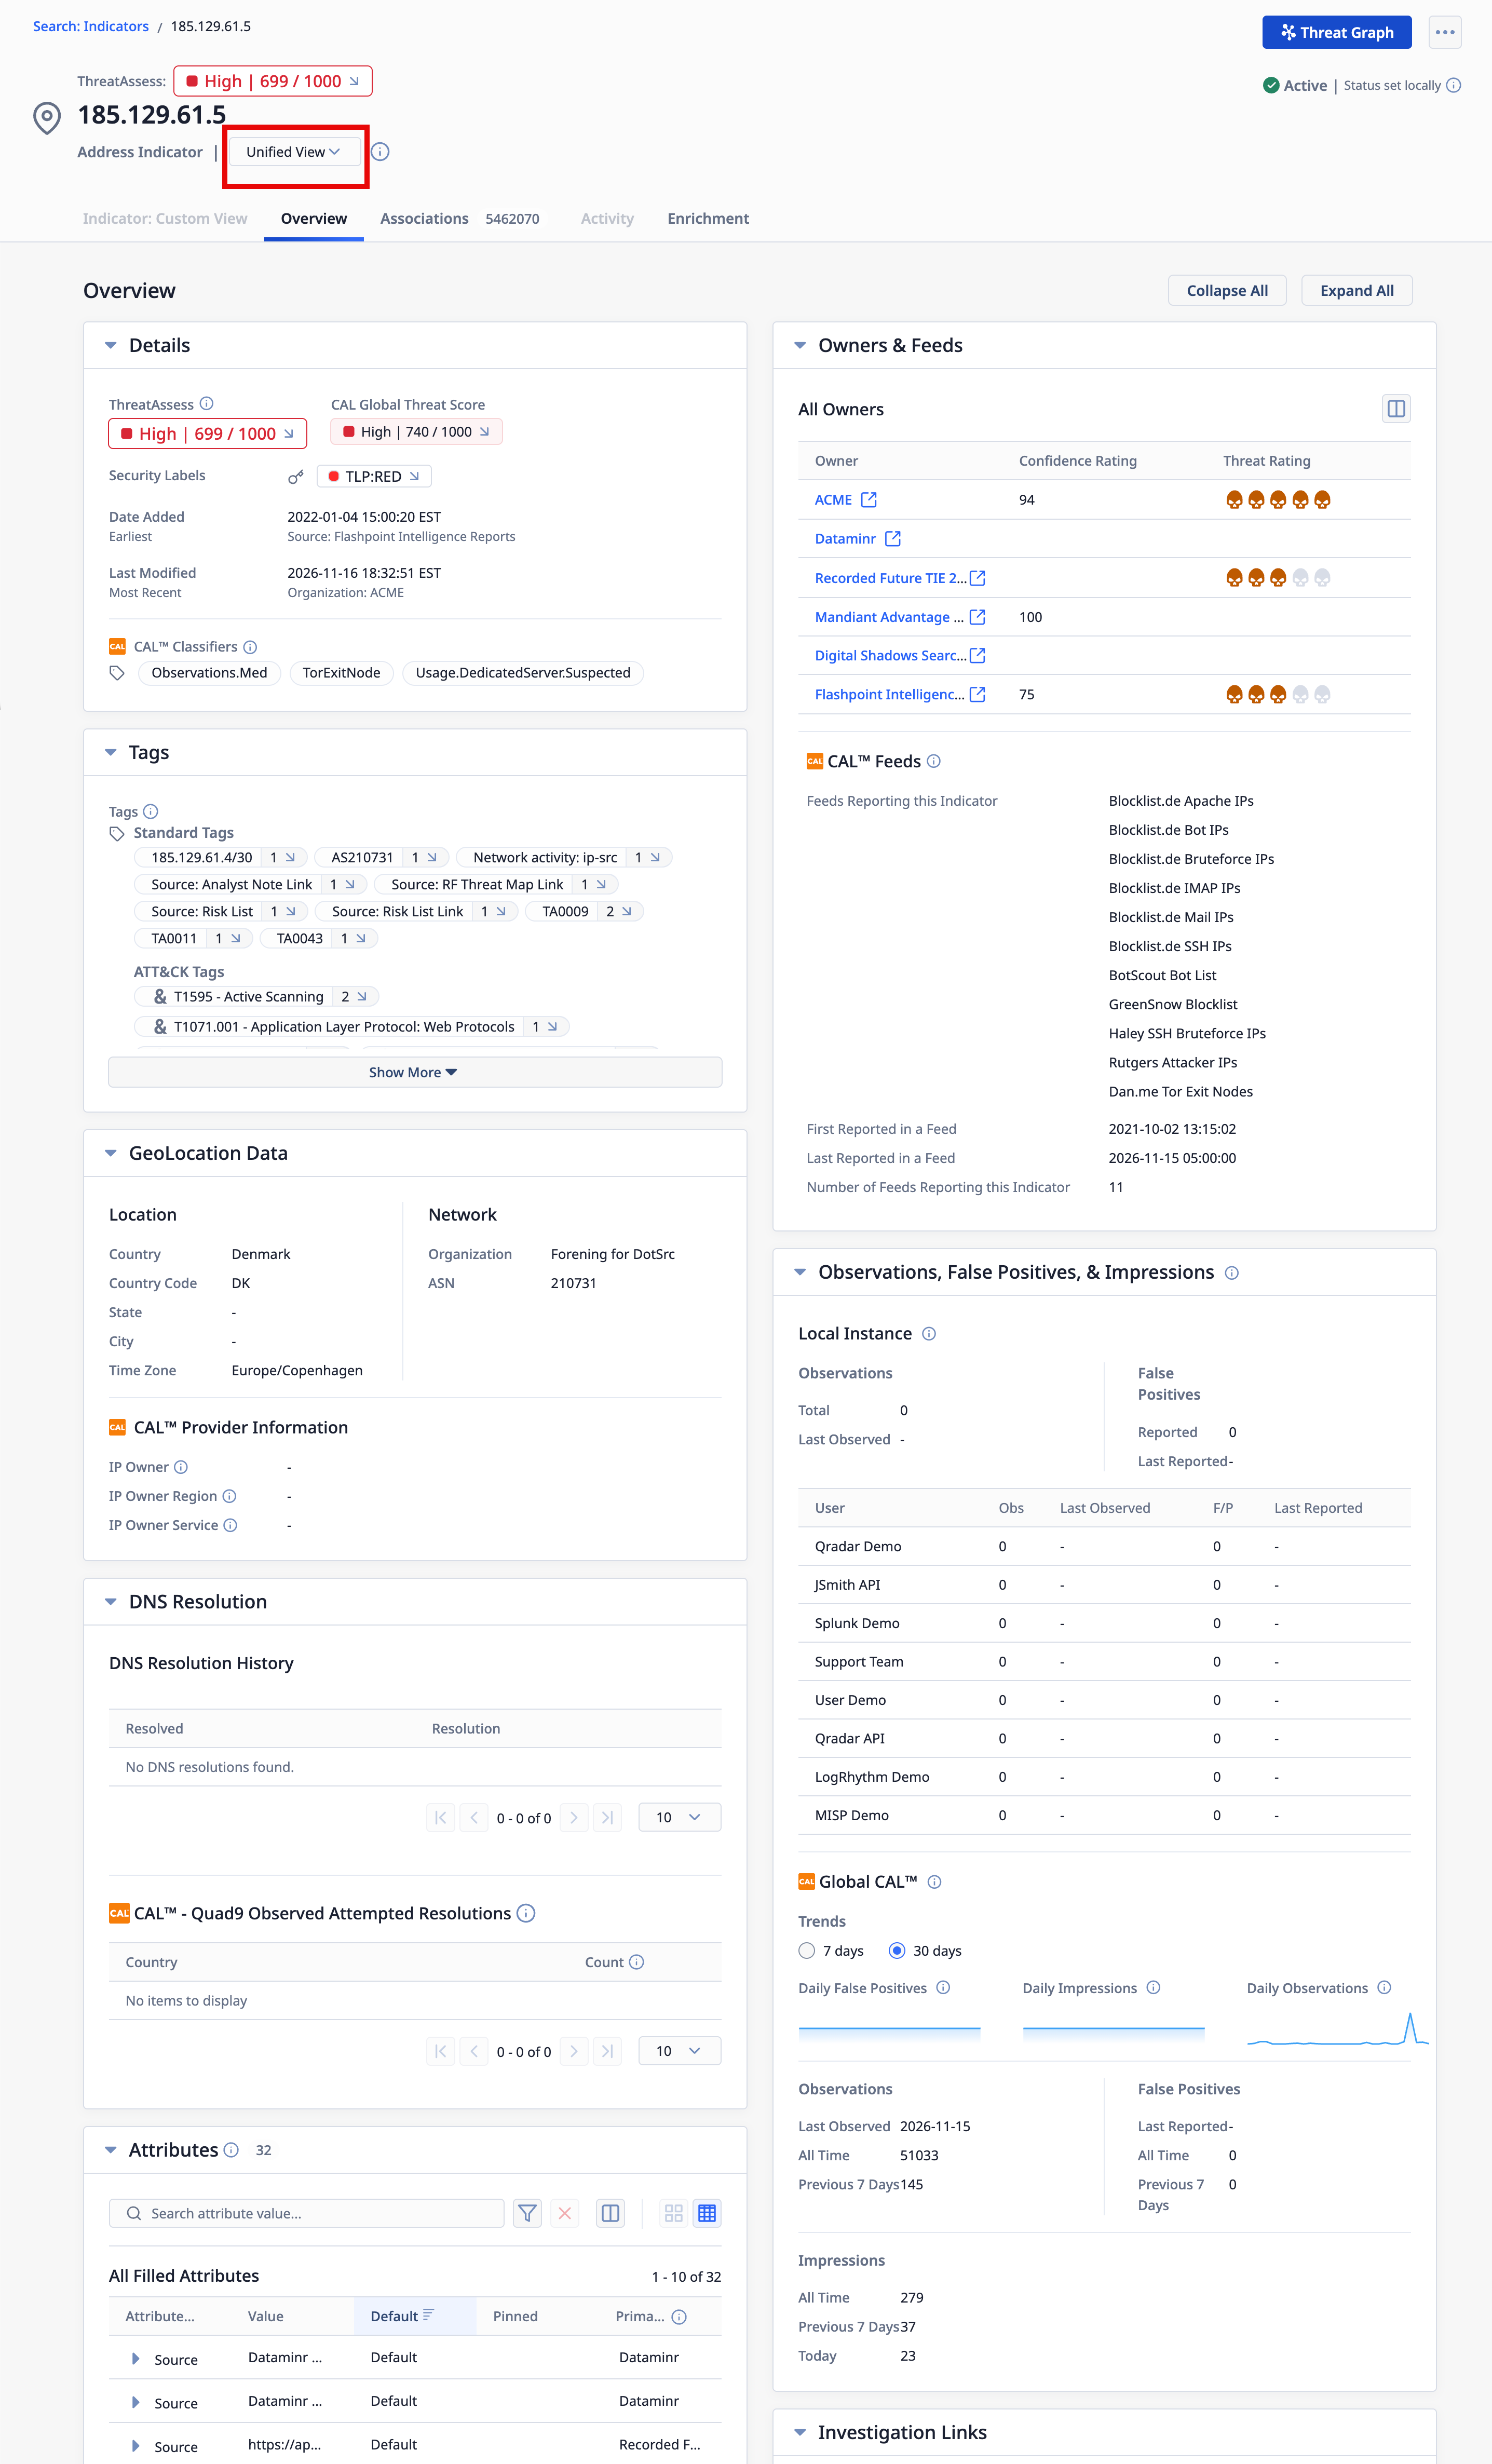
The unified view for the Indicators Details screen shows data across all your owners
Your System Administrator must turn on the multiSourceViewEnabled system setting for the Indicator Details unified view to be available on an instance. Indicators that have only one owner do not have a unified view. You can enable or disable the unified view as your default view when viewing an Indicator with more than one owner from the options ⋯ menu at the upper right of an Indicator’s Details screen. This setting applies to all Indicators of all types that have more than one owner.
Common Indicators Endpoint in the v3 API
Previously, when using the v3 API to retrieve Indicators across multiple owners, you would end up with a dataset that included a separate copy of each Indicator for every owner in which it exists. You would then have to deduplicate the dataset with a playbook or other tool before sending the Indicators to your security technologies for further analysis or action. There was also no easy way to tell which fields held data common to every copy of an Indicator and which held owner-specific information.
To consolidate Indicator data across your owners, ThreatConnect 8.2 adds a new /api/v3/commonIndicators endpoint that returns one result per unique Indicator. Each result is a single object containing the common Indicator version of that Indicator’s data. This “unified view” contains the information that applies to the Indicator as a whole rather than to one owner’s copy of it.
Each common Indicator object includes the following data:
- The owners that hold a copy of the Indicator (limited to owners you have permission to view)
- The earliest date added and the latest last modified date across those copies
- The Indicator’s ThreatAssess score and some of the components used in its calculation
- The Indicator’s CAL™ score
- Indicator status
- Built-in enrichment data for the Indicator, such as DomainTools® and AbuseIPDB scores
In addition, the following data can be returned from queries using the fields parameter:
- Tags applied to the Indicator in its owners
- Associated Groups in the Indicator’s owners
- Associated common Indicators
- WHOIS records (Hosts only)
- Geolocation data (Addresses only)
The endpoint is designed for retrieving a deduplicated list of Indicators that meet criteria you specify by using the tql parameter with a corresponding query. To filter by owner-level criteria such as threat rating or Tags, use the hasIndicator() nested query—for example, hasIndicator(rating > 3 AND hasTag(summary = "apt")).
Each result also includes an ID for the common Indicator. This ID is different from the IDs of the Indicator’s owner-level copies and is not shown in the ThreatConnect UI. You can use it to retrieve a single common Indicator (/api/v3/commonIndicators/{commonIndicatorId}), but in most cases, filtering the list with TQL is the more practical approach.
GET /api/v3/commonIndicators?tql=hasIndicator(id IN ({indicatorID1},{indicatorID2})).The common Indicators endpoint is read only. To create, update, or delete Indicators, use the /api/v3/indicators endpoint for individual Indicator copies.
Custom View: Case Details Screen
You can now build your own layout for the Case Details screen on a new Custom View tab, allowing you to arrange cards from across all of the tabs on a single screen in the format that best suits your needs. The custom view for Cases works just as it does for Groups and Indicators, and your arrangement applies to the Custom View tab for all Cases you view.
Build Your View
To build a custom view for Cases, open the Details screen for a Case and select the Case: Custom View tab Then click Manage View, choose a layout, add the cards you want, drag and drop them in your desired configuration, and save your selections. Alternatively, you can import a .tccv file for a Case to load a custom view from your local drive or use the Organization-level default view your Organization Administrator has configured. Once you have set up your view, you can make it your default view for all Cases, as well as export it as a .tccv file to your local drive.
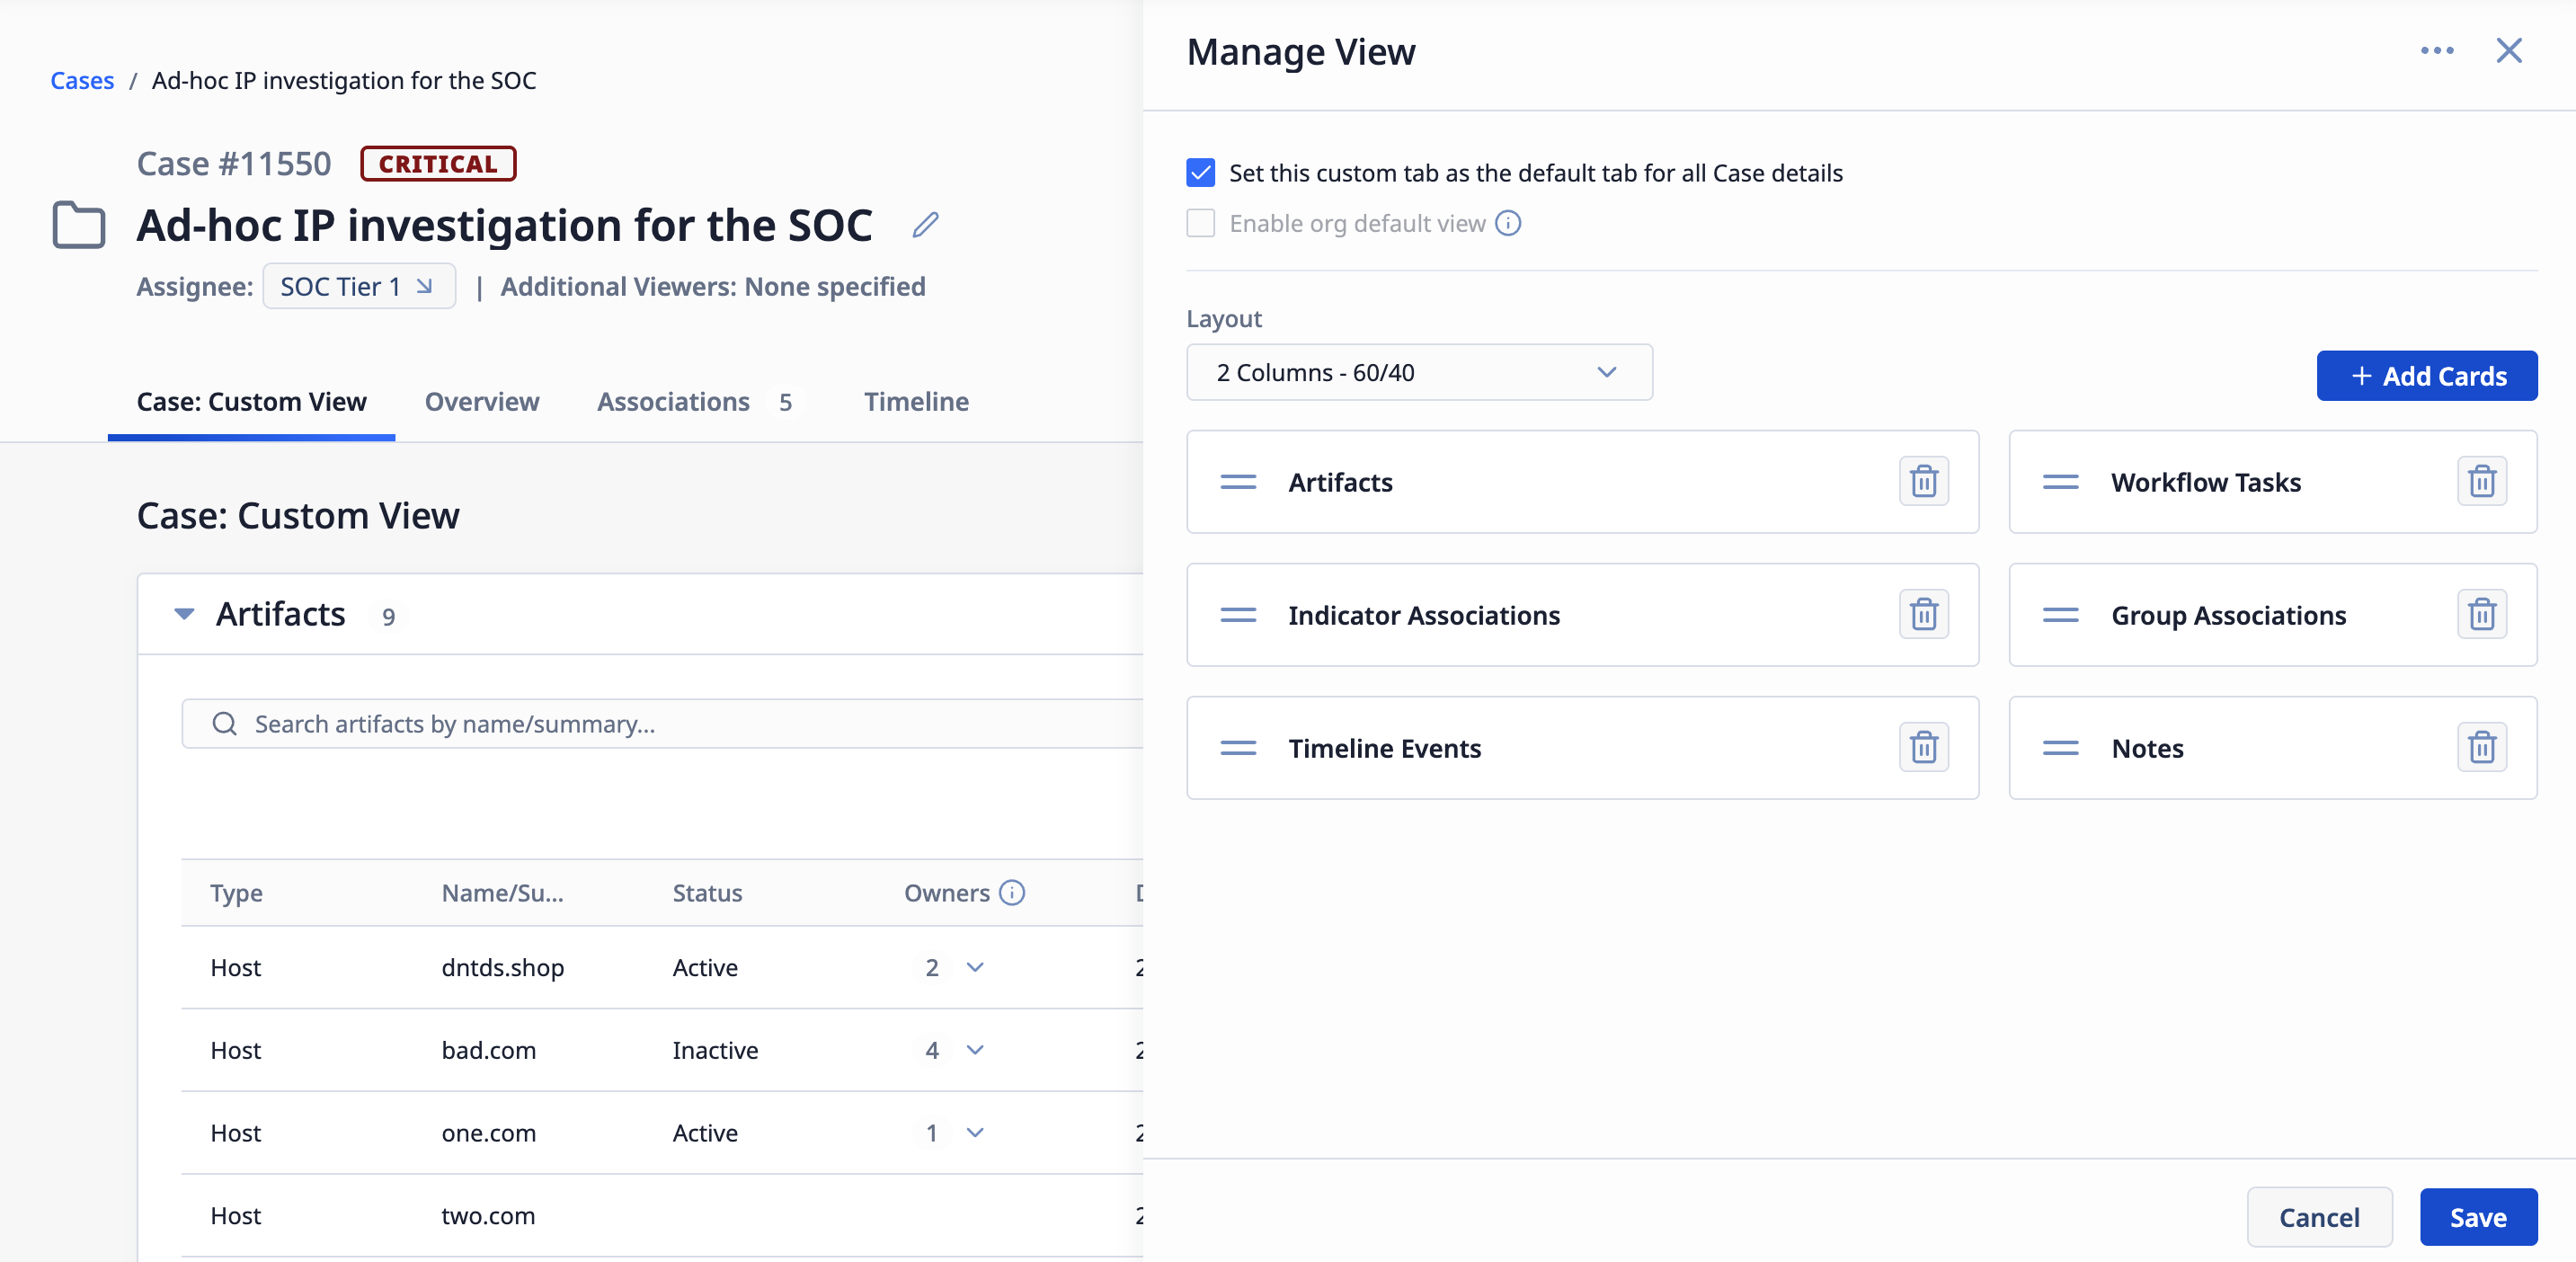
Arrange cards across all tabs of the Case Details screen in the new custom view
Share a View With Your Organization
Organization Administrators can set an Organization-level default view for Cases from Organization Configuration > Default Custom Views or by selecting Set View as Org Default from the options ⋯ menu on the Manage View drawer. You can remove an Organization-level default view by deleting it from Organization Configuration > Default Custom Views or by replacing it with a different view. An Organization-level default view is provided as an option to users, but is not mandatory.
Indicator Confidence Deprecation Enhancements
ThreatConnect 8.2 delivers enhancements that make Indicator confidence deprecation more performant, more targeted, and easier to manage across owners. A new sidebar layout for the Deprecation Rules tab in Account Settings and on owner-level configuration screens provides a more functional interface, as well as access to features that allow you to use TQL to define a set of Indicators for a one-time deprecation, manage all deprecation rules across all owners on an instance from a single screen, and view diagnostics on individual rules. In addition, you can use the v3 API, including in playbooks, to select sets of Indicators for bulk confidence deprecation.
Deprecation Rules Tab Updates
The Deprecation Rules tab has been revamped to provide greater transparency and to accommodate the new TQL deprecation and rule diagnostic features.
The most significant changes are in Account Settings, where the Deprecation Rules tab has a new sidebar with three options:
- Templates: This view provides the table that was previously the only view of the Deprecation Rules tab. It shows all deprecation templates available when creating a new deprecation rule in an owner or for automatic application in a newly created owner of a selected type. System and Operations Administrators can create new templates and edit and delete existing templates in this view.
- TQL deprecation: This view shows a table with all submitted TQL-defined deprecation requests. System and Operations Administrators can write, validate, and submit TQL queries to define a set of Indicators for deprecation. If the TQL Generator is enabled, they can enter a natural-language description of what they want to deprecate instead of piecing together the query manually.
- All rules: This view shows a table with all deprecation rules in all owners across the ThreatConnect instance, eliminating the need for administrators to jump from owner configuration screen to owner configuration screen to view the rules in each owner. System and Operations Administrators can create, edit, or delete a rule in any owner from this screen, as well as view diagnostics and other metrics for each rule.
The tables in these views offer a redesigned look and column filtering, sorting, resizing, and selection, allowing you to find the information you need as quickly as possible. In addition, the Deprecation Rules tab of the individual owner configuration screens (Organization Configuration, Community Configuration, and Source Configuration) includes the same look-and-feel modifications and provides a read-only version of the TQL deprecation view for the specific owner.
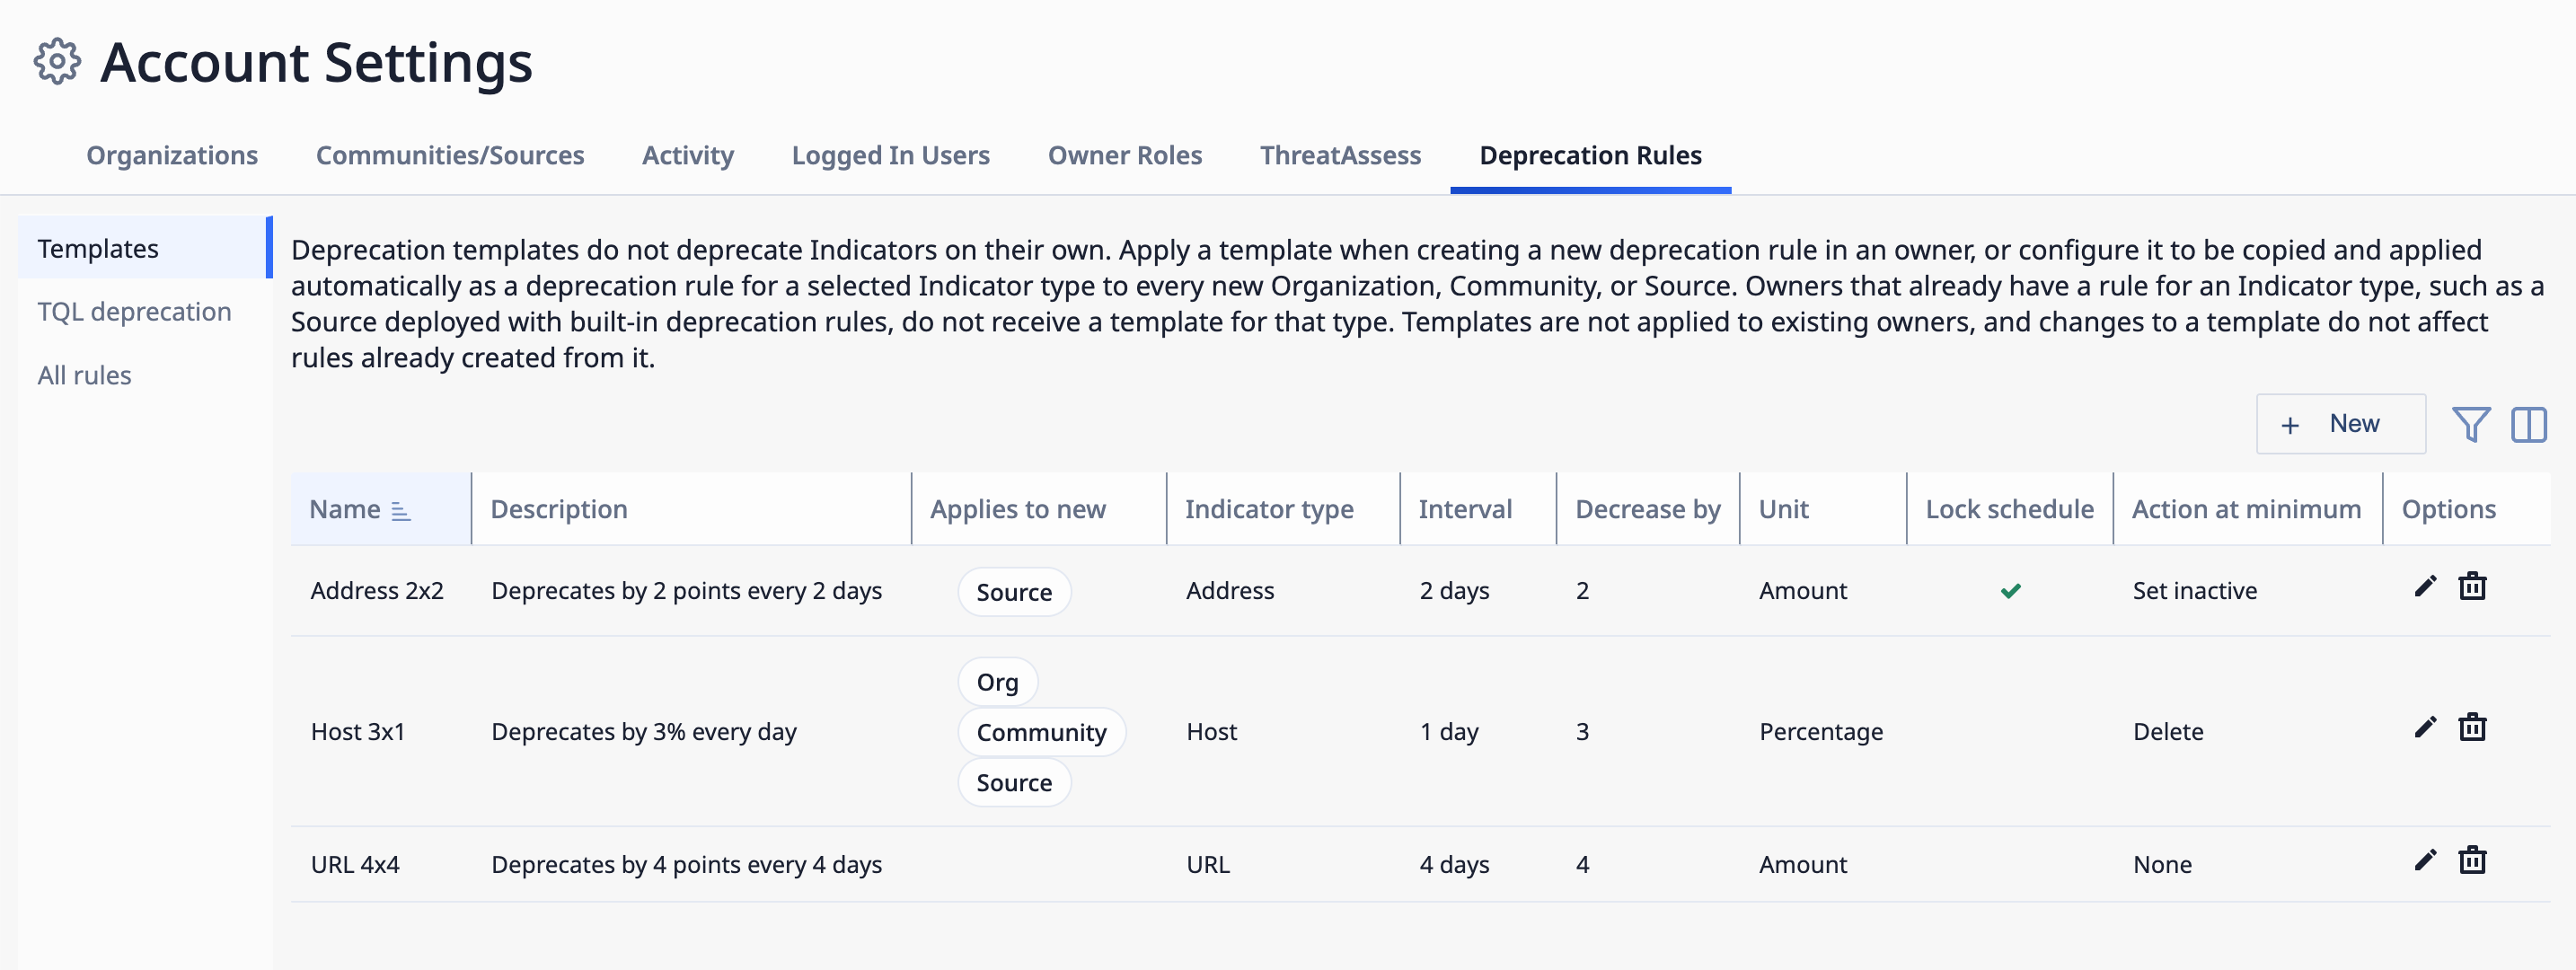
The Deprecation Rules tab in Account Settings has three views and a redesigned interface
TQL-Defined Deprecation Requests
Not every Indicator of the same type in the same owner should age out on the same clock. Deprecation rules are useful, but they apply to all Indicators of a given type in an owner, which doesn’t always fit your data’s needs. For example, a rule that decays confidence on one noisy bulk feed also decays the high-fidelity Indicators of the same type your own analysts manually curate in that owner. Without a way to more specifically target Indicator sets for deprecation, teams are left choosing between deprecating the entire set too aggressively, which risks losing Indicators they vetted, and deprecating the entire set too conservatively, which lets stale feed data pile up. Cleaning up the difference requires custom automation or painstaking manual adjustments to individual Indicators.
ThreatConnect 8.2 addresses this problem with the addition of TQL-based deprecation requests that allow System and Operations Administrators to define exactly which Indicators to deprecate, based on features such as Tags, threat rating, confidence rating, or nearly anything else that can be filtered on with TQL. If you have the TQL Generator enabled on your instance, you can even write the query in natural language and then let the TQL Generator do the hard work of writing the query. At the very least, your query must define a single Indicator type and a single owner. But don’t worry: If you forget, you’ll be prompted to select an Indicator type and owner from dropdowns after generating the query, ensuring that the query is properly guardrailed before it’s validated. Your query must also include a condition on confidence rating (for example, confidence > 0). Without one, Indicators already at 0 are included and receive the action at minimum, which could mean deleting them. If you want that, you can waive the requirement and revalidate.
After your query is defined, all you have to do is set how much to reduce confidence rating by and what happens when an Indicator’s confidence rating drops to 0. Everything outside your query is untouched, so you can clear out low-value Indicators without affecting the ones your team has validated. Each request returns a count of matching Indicators up front, runs in the background, and can be tracked through completion, so you decide what gets deprecated and when, rather than waiting on a fixed, systemwide schedule. This feature supports deprecation of up to 1 million Indicators in a single request. All queries must run through a validation check before submission, ensuring that the TQL query is valid, meets the feature’s requirements, and does not target an owner-and-Indicator-type combination that already has a deprecation rule. Note that once a TQL deprecation request is submitted, it cannot be revoked or deleted.
This feature complements standing rules rather than replacing them and can even be leveraged via the v3 API and Playbooks when you want to repeat a targeted cleanup on your own schedule.
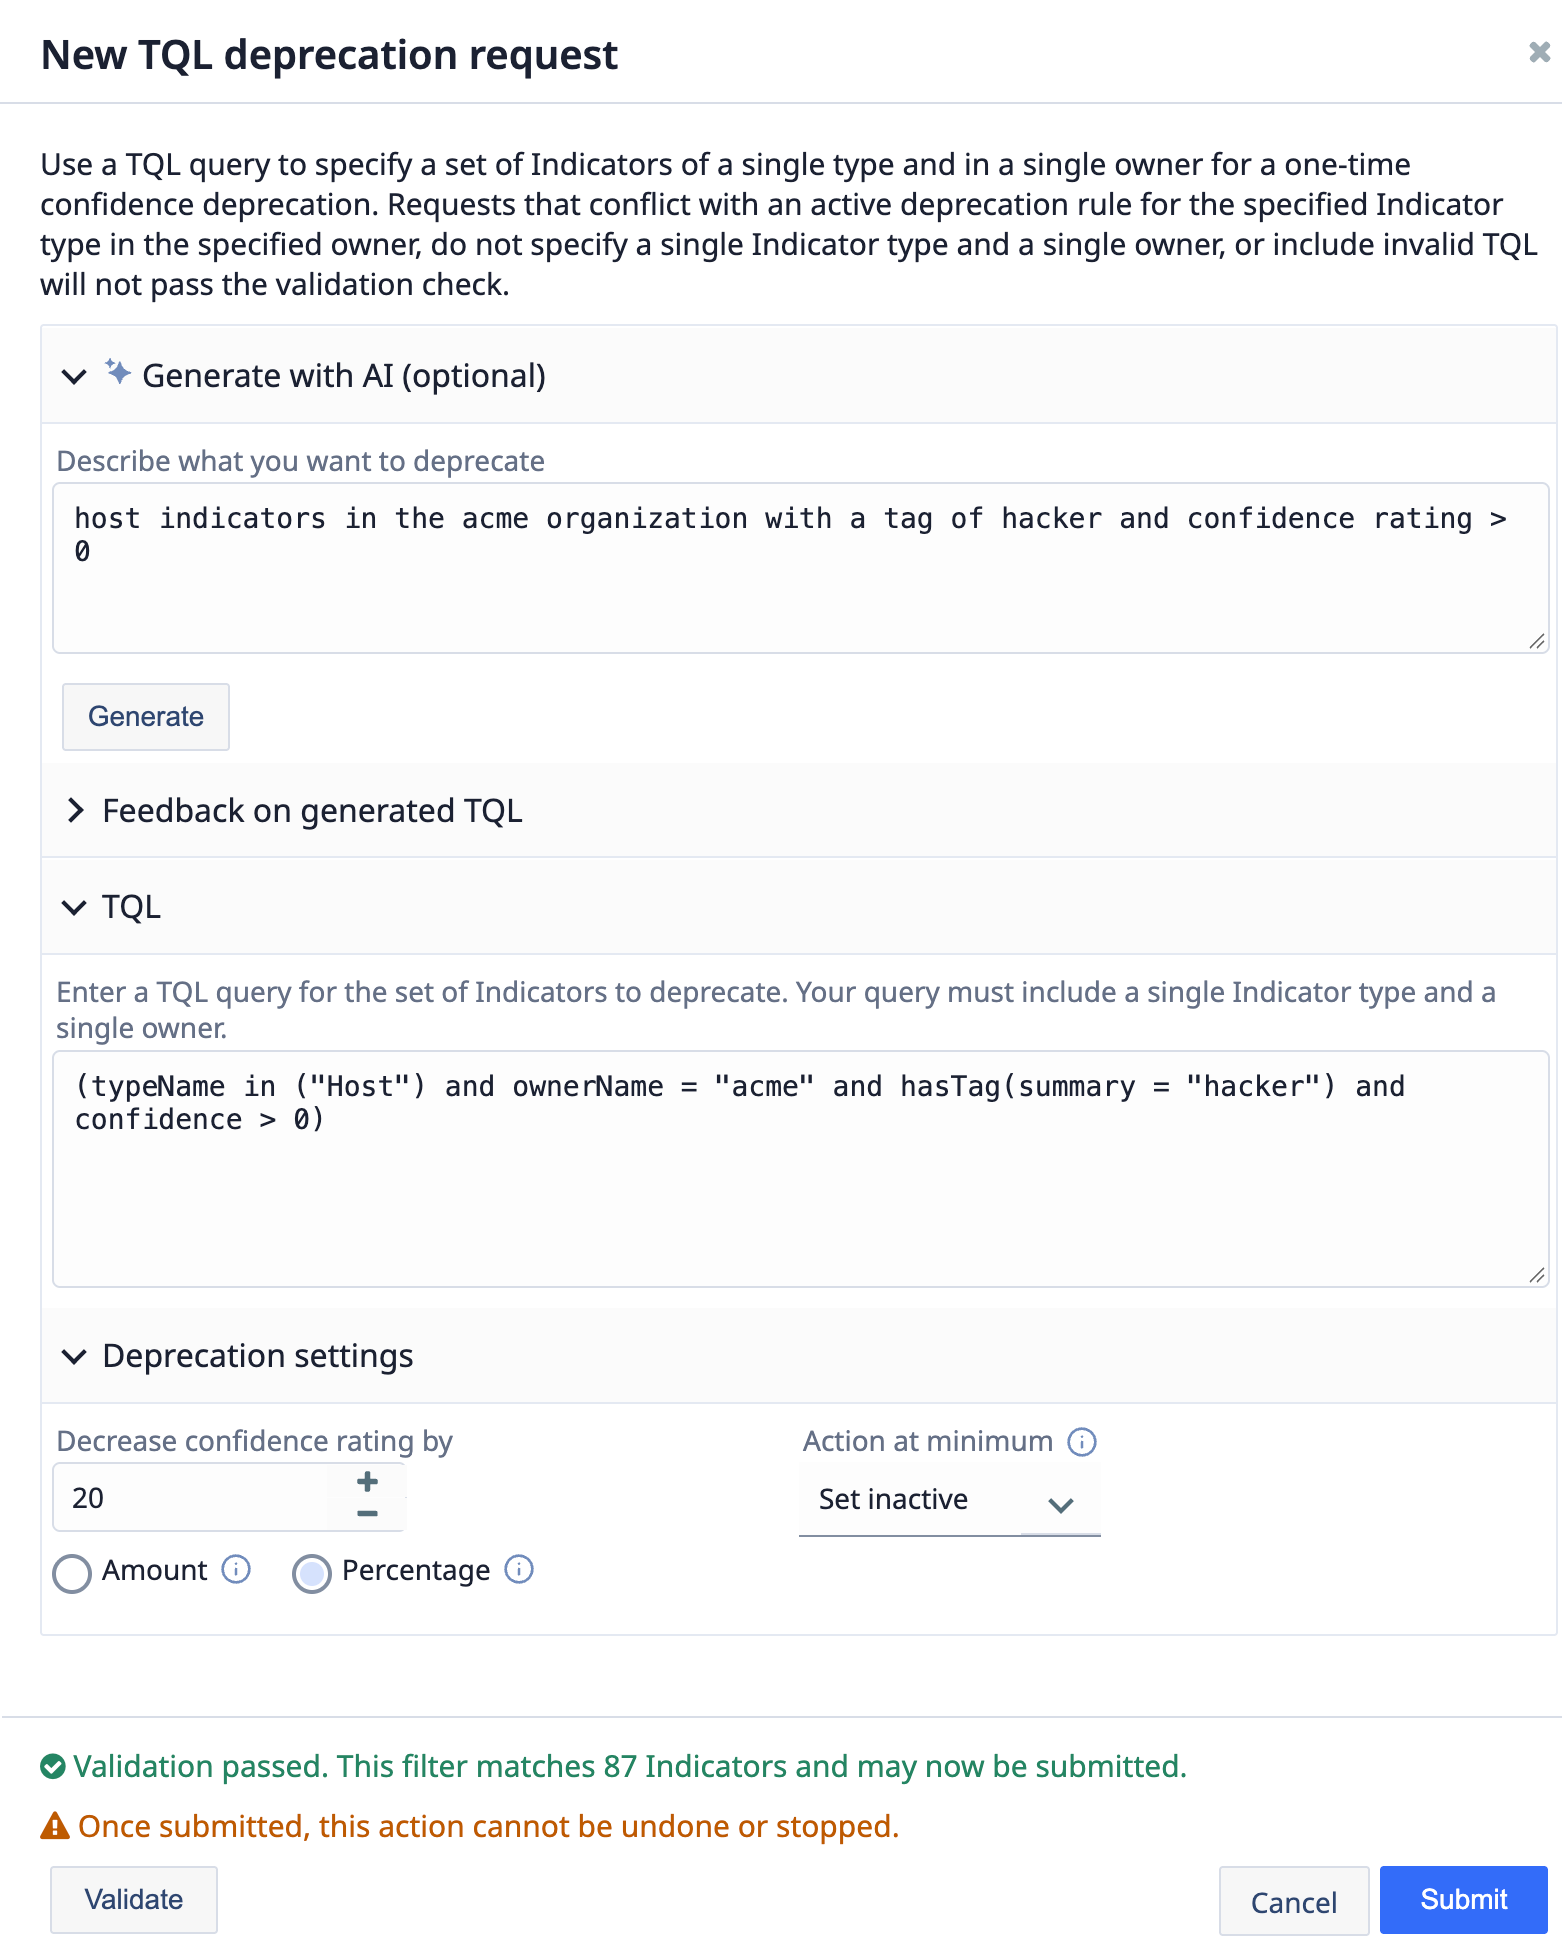
Use TQL to define a set of Indicators for deprecation
System and Operations Administrators can initiate new TQL deprecation requests from the TQL deprecation view of the Account Settings screen, as well as view all TQL deprecation requests in all owners on the ThreatConnect instance. The TQL deprecation view on the Deprecation Rules tab of individual owners’ configuration screens shows a read-only table that allows owner-level administrators to track the status and outcome of TQL deprecation requests for Indicators in that owner. All requests that are not queued or processing are purged after 90 days to keep the table current.
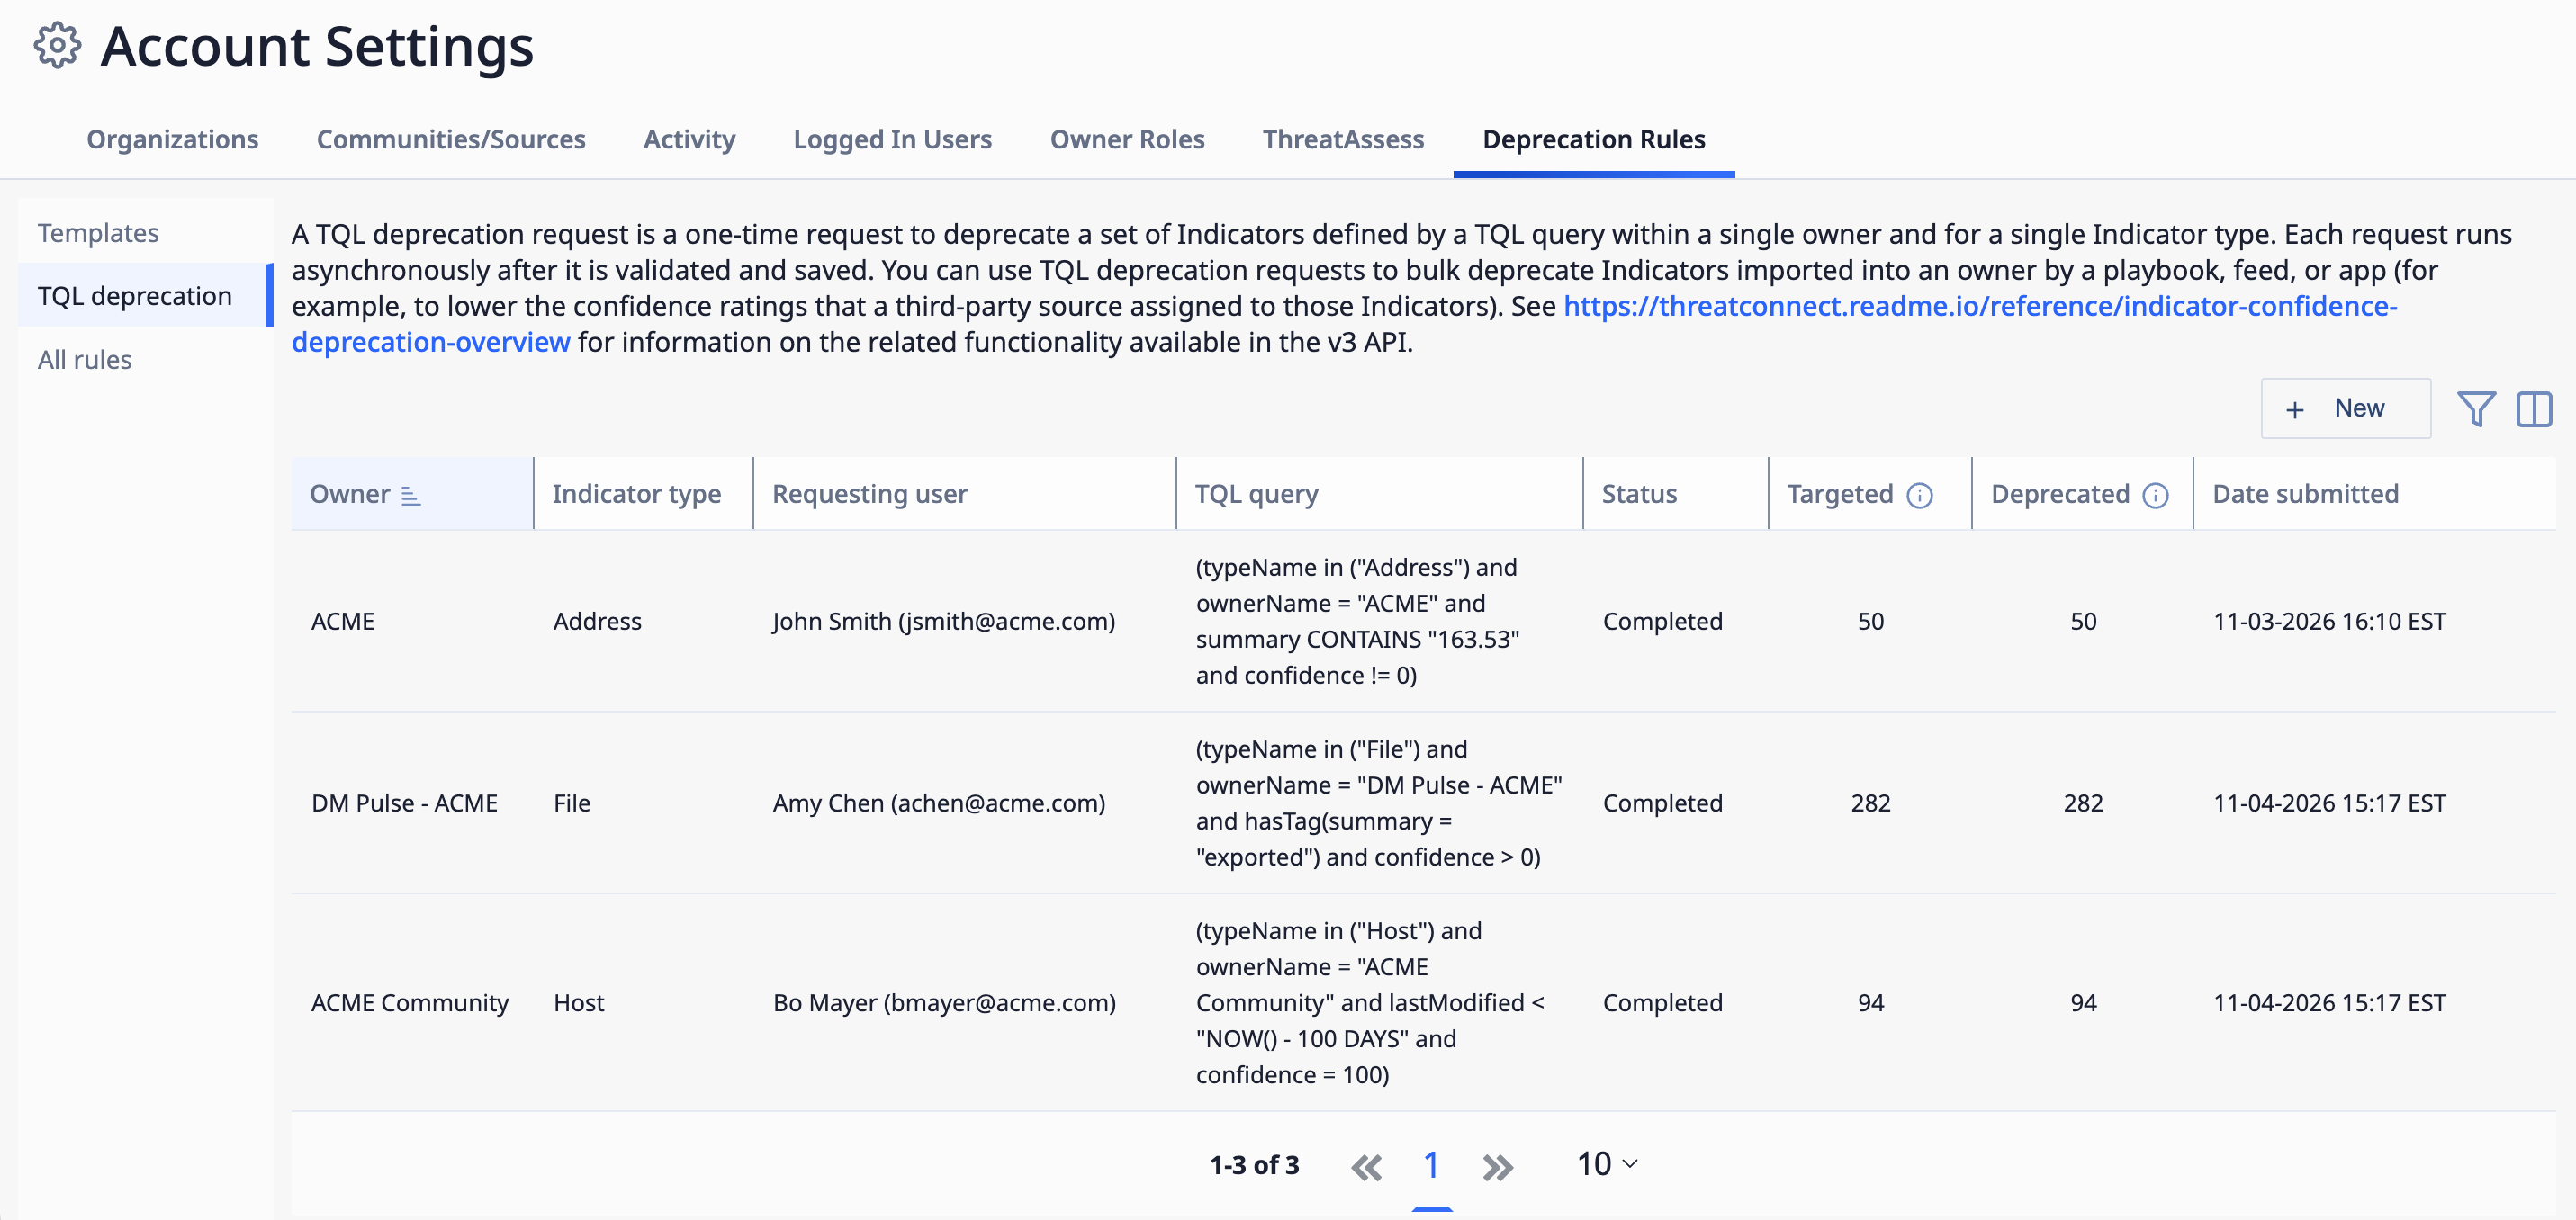
View all TQL deprecation requests in all owners from Account Settings
v3 API and Playbook-Driven Deprecation
The v3 API now supports one-time TQL deprecation requests via a new endpoint: /api/v3/indicators/deprecate. The request functions similarly to how it works on Account Settings > Deprecation Rules in the UI: You supply a set of fields specifying the TQL query that defines the Indicators, the Indicators’ owner and the Indicators’ type (if you did not specify them in the query), the value to reduce the confidence rating by, whether the value is a percentage or not, and the action to take when an Indicator’s confidence rating drops to 0. As with the UI-based TQL deprecation request, your query must also include a condition on confidence rating (for example, confidence > 0) or waive the requirement via a designated field.
API users can create and retrieve information on TQL deprecation requests only in their Organization (as long as they have a non-read-only Organization role) and in Communities and Sources in which they have a Community role of Editor or Director. Each request has an ID you can use to track it from the API. All requests configured via API are shown in Account Settings > Deprecation Rules (and, for requests in a particular owner, on the Deprecation Rules tab of the owner’s configuration screen), making it easy for administrators to see what was deprecated, by whom, and with what outcome, regardless of how the request was initiated.
You can also use the ThreatConnect API playbook app to call the new endpoint from a playbook, allowing you to automate TQL deprecation requests to make them repeatable. For example, you could build a playbook that targets Indicators carrying a particular Tag and deprecates them. TQL-defined deprecation requests are one time, so if you want a targeted cleanup to repeat, have your playbook submit a new request on whatever schedule or trigger suits you.
View All Rules and Rule Diagnostics
The new All rules view lists the deprecation rules in every owner on your instance in a single table, allowing System and Operations Administrators to view and manage rules from one place rather than navigating to individual owners’ configuration screens. This table includes new information such as the monitor (standard or overflow) a rule last ran on and diagnostics for each rule, as well as an icon that opens a Rule diagnostics window containing run metrics and a health chart that indicates the extent to which the rule is running according to schedule.
For recurring rules, the diagnostics window also reports any “orphaned” Indicators: Indicators with a confidence rating above 0 that fall under an active recurring rule, but were never scheduled for deprecation, so they won’t deprecate on their own. Orphaned Indicators are not expected in normal operation, but if they are found, you can use the repair option to initialize them so they begin deprecating on the rule’s schedule.
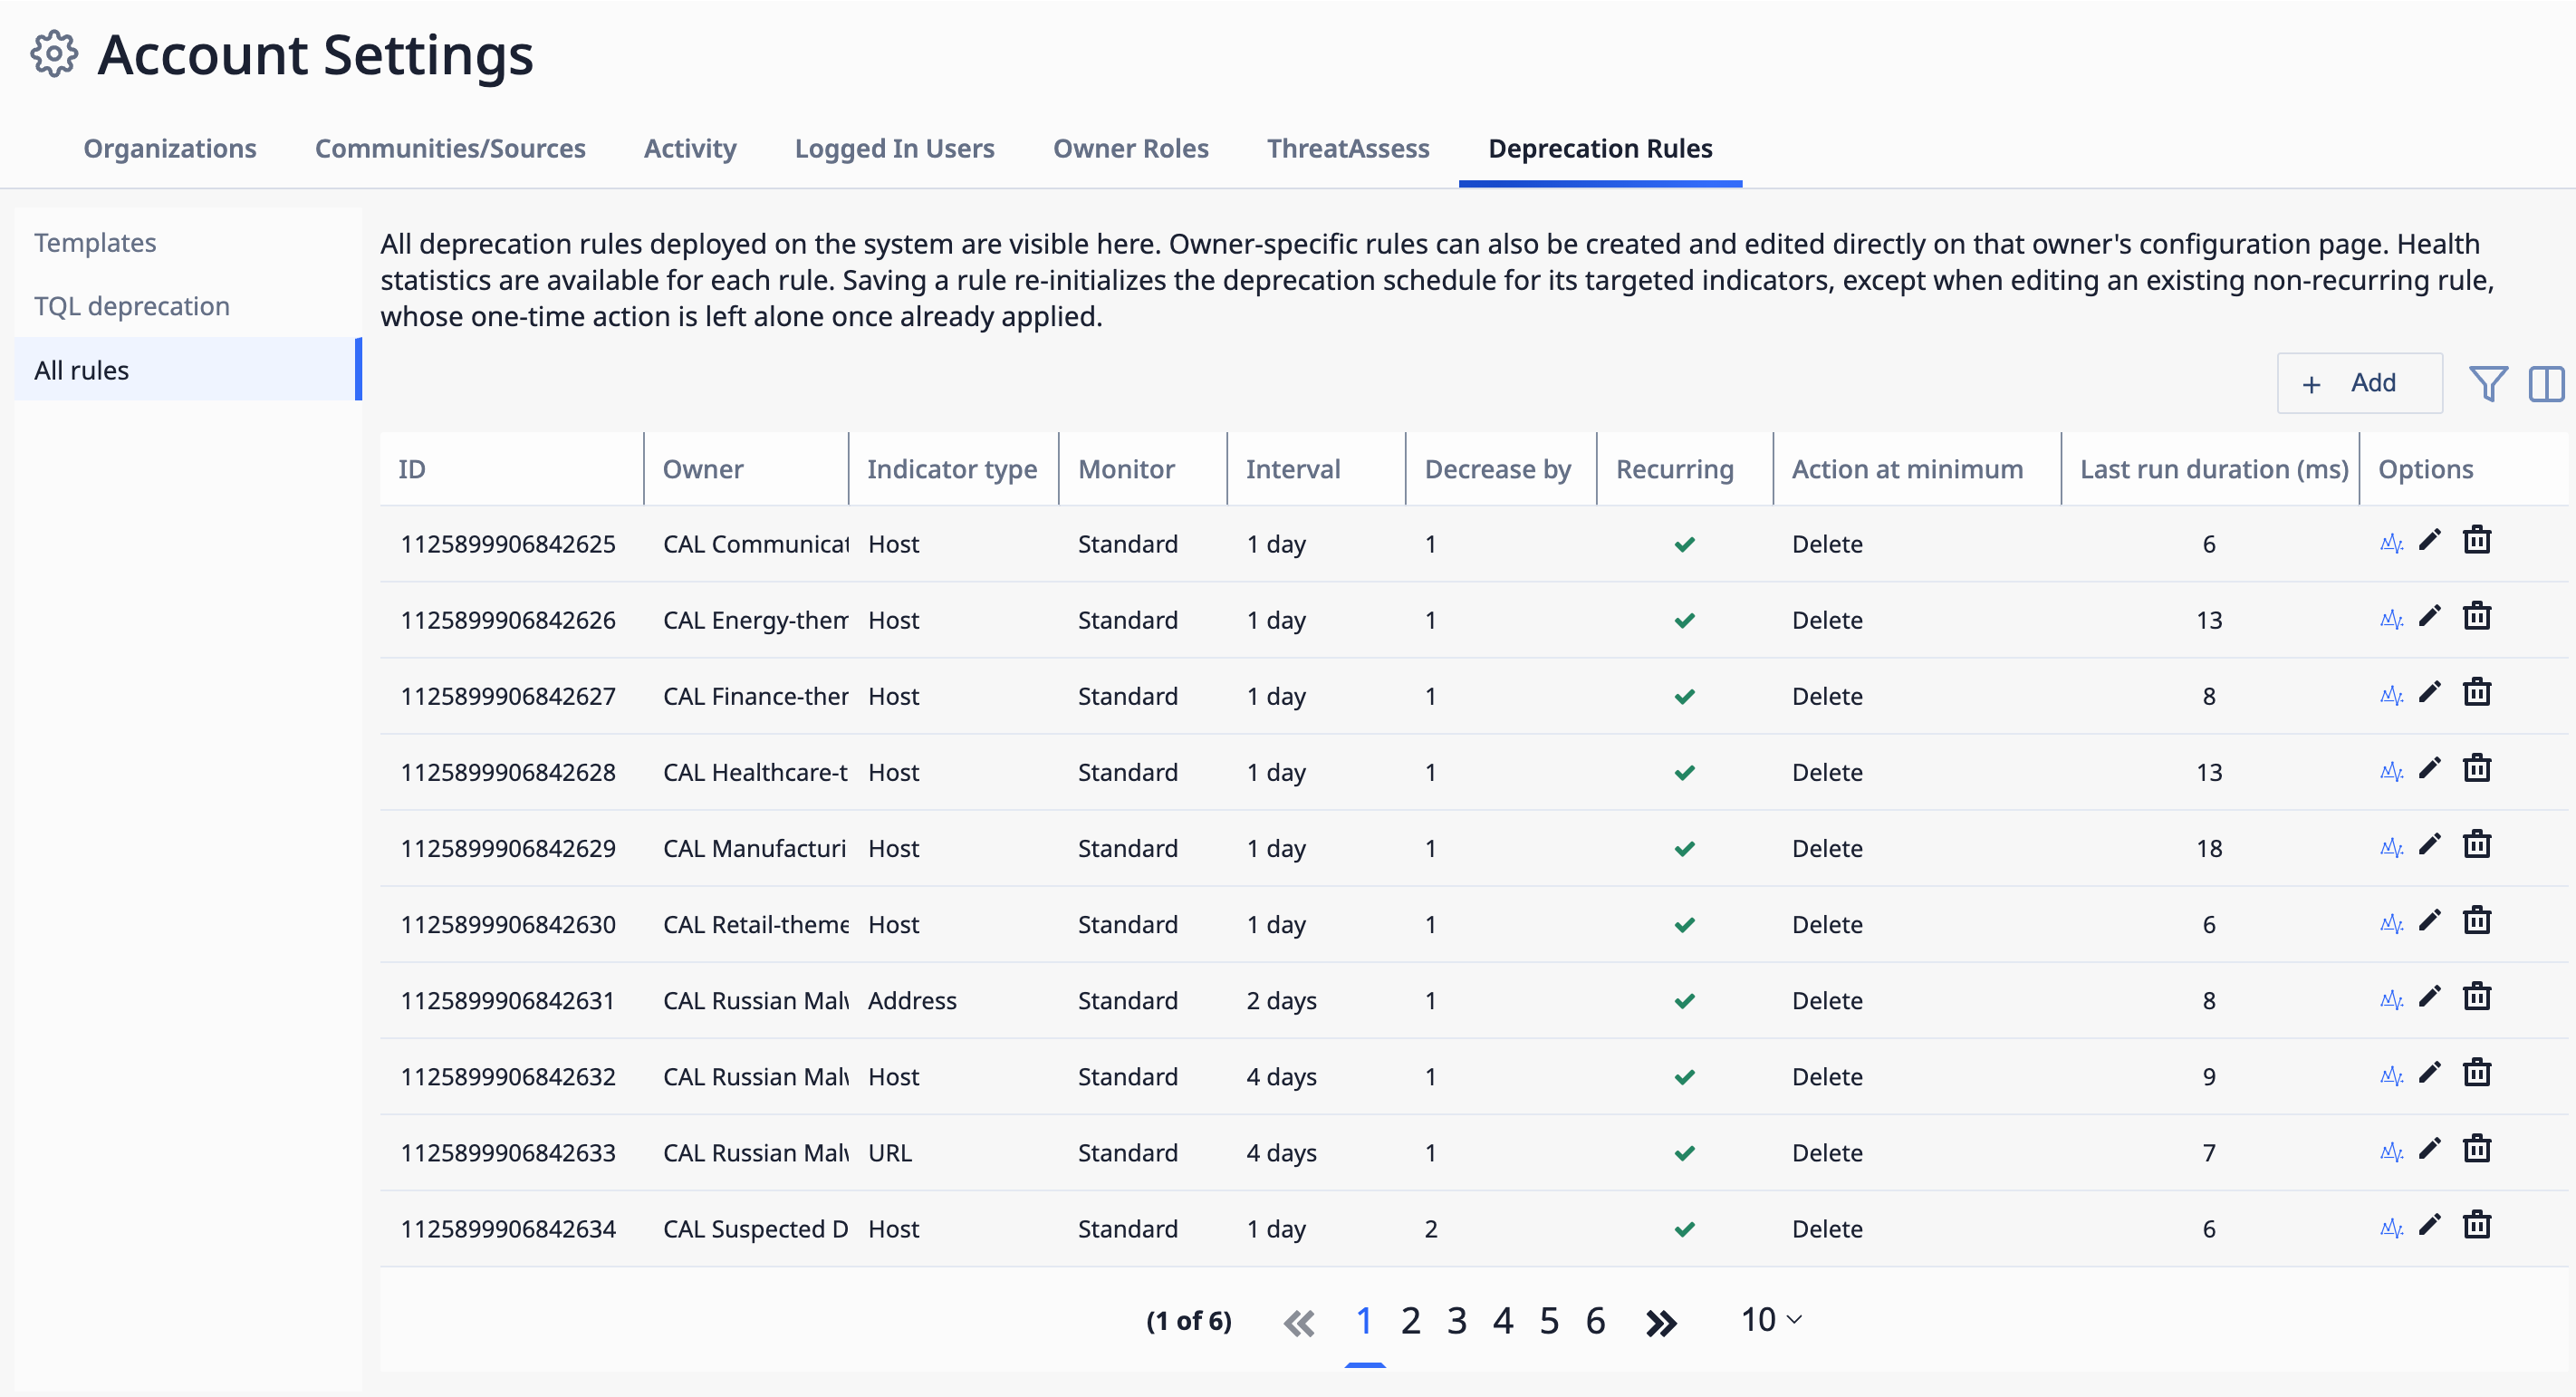
View all deprecation rules in all owners from Account Settings
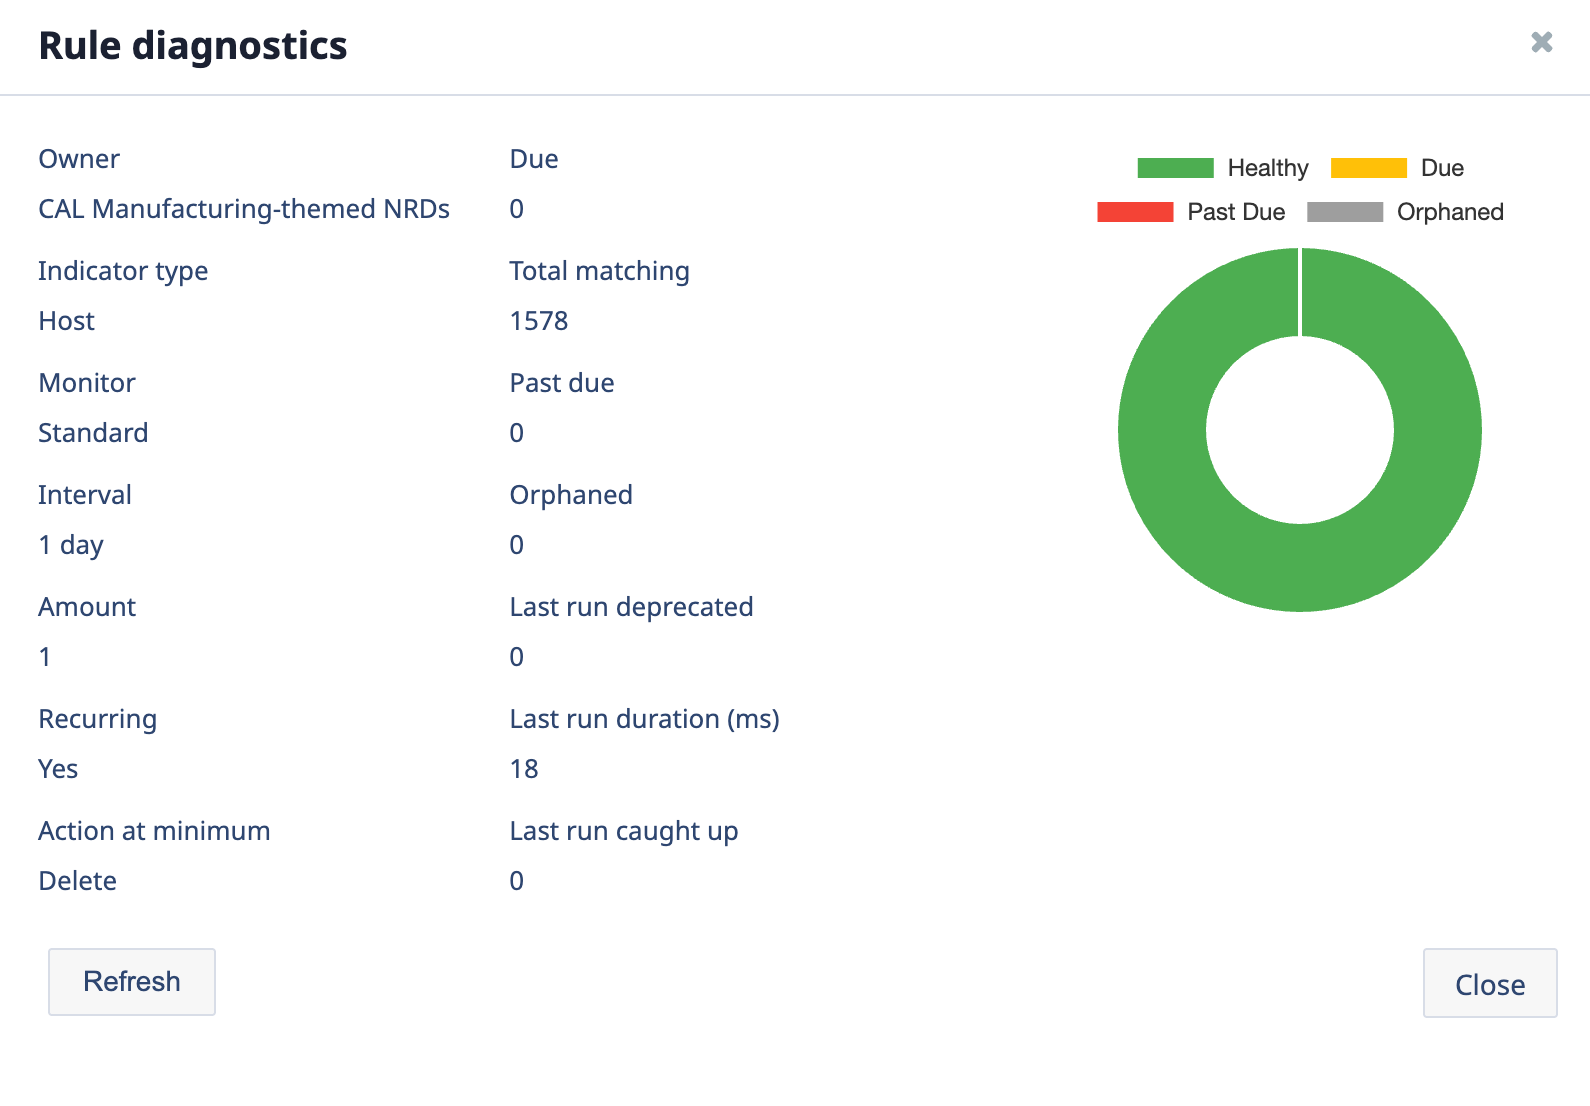
The Rule diagnostics window, accessed from the Options column, shows metrics and a health chart for a rule
Deprecation Overflow Monitor
Deprecation rules that run for more than 30 minutes are now moved to a new overflow monitor, allowing the standard monitor to move on to the remaining rules instead of being held up by a single rule that is working through a large number of Indicators. Once a rule catches up, it returns to the standard monitor. The monitor running a rule can be viewed on Account Settings > Deprecation Rules > All rules.
AI-Generated Reports: Configurations, Scheduling, and Distribution
Analysts often spend hours pulling data together, writing reports for different audiences, and sending them out by hand. That is time they are not spending on analysis. Building on the AI-generated reporting introduced in version 8.1, ThreatConnect 8.2 lets you save a report configuration once, run it on demand or on a schedule, and deliver it to the people who need it.
New Reporting Landing Pages
For users with agentic AI enabled on their ThreatConnect instance (that is, the aiAgentUiEnabled system setting is turned on), the Reporting screen now opens to a revamped landing page that lists all reports, including whether they are AI generated or custom, in a single table, as well as provides options to navigate to separate landing pages for AI-generated reports and custom reports. Click at the upper right to configure report branding. The landing page for custom reports has not changed and is accessed by clicking the Custom reports card. The landing page for AI-generated reports is new and is accessed by clicking the Ai-generated reports card. From this page, you can view and edit saved reports created by the generative report agent, create and manage the configurations from which the reports are generated, and create and manage distribution lists for the reports. If you do not have agentic AI enabled on your ThreatConnect instance, the Reporting screen remains unchanged.
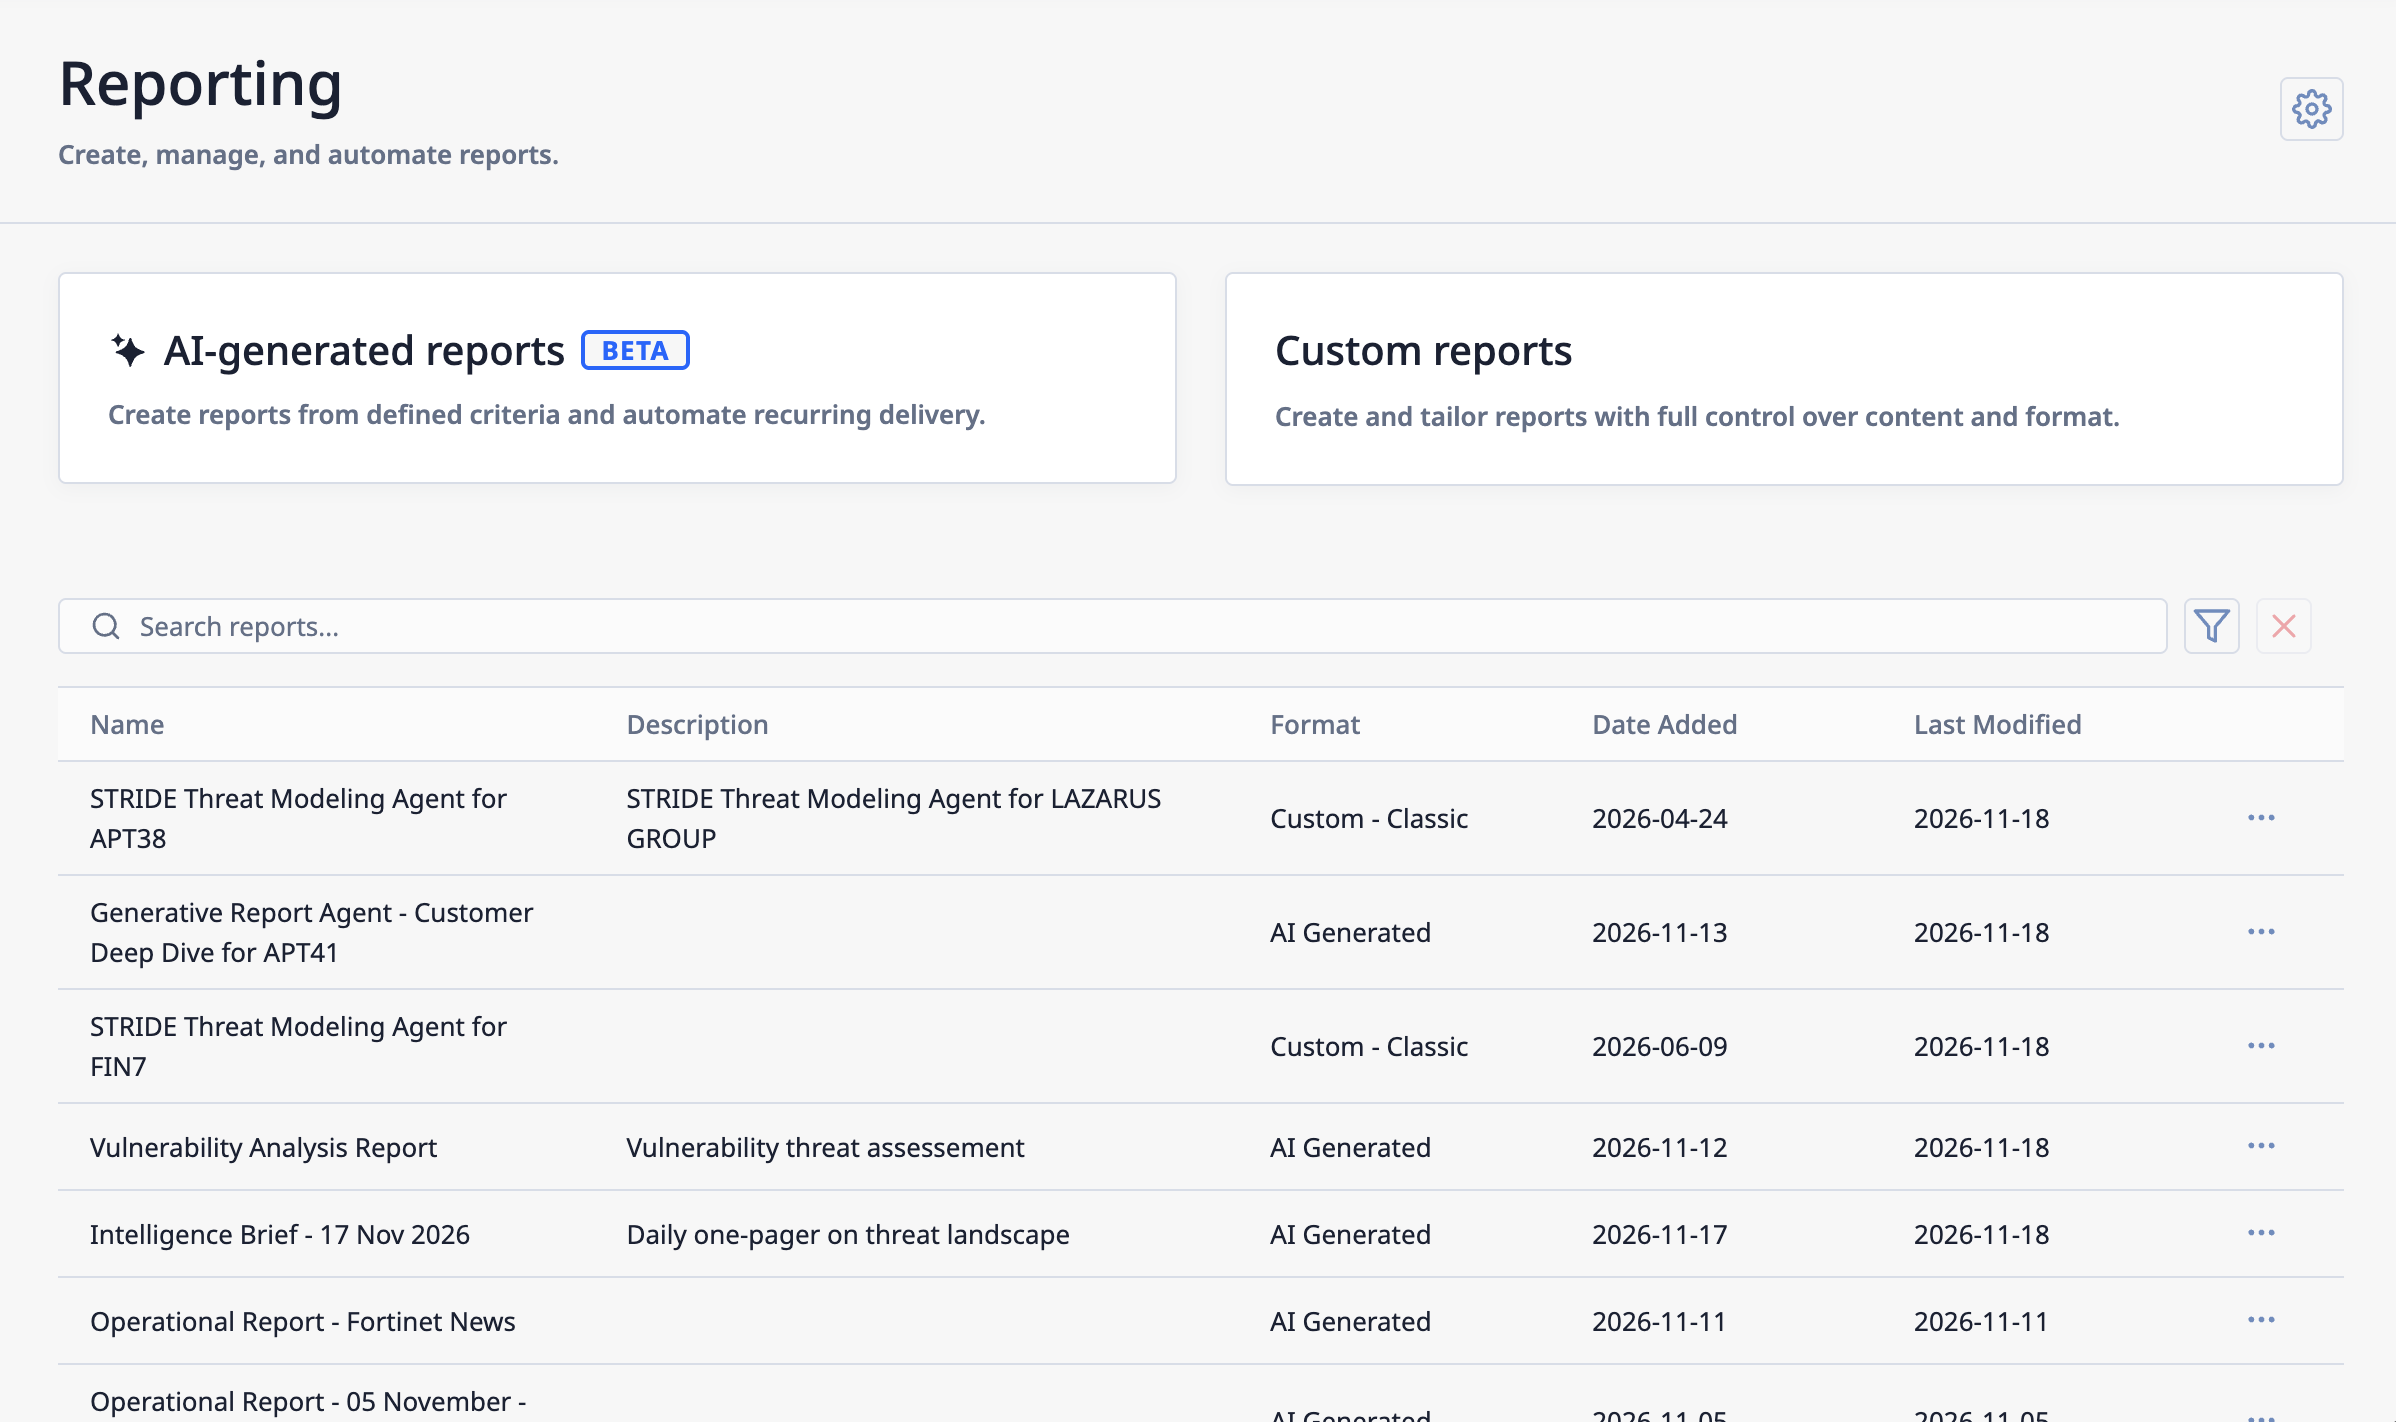
The new Reporting landing page aggregates all reports and links to designated screens for managing custom and AI-generated reports
View AI-Generated Reports
The Reports tab of the new AI-generated reports screen lists all reports created by the generative report agent in your Organization. From here, you can select a report to open it in the report editor, edit a report’s metadata, save a copy of a report, and delete a report.
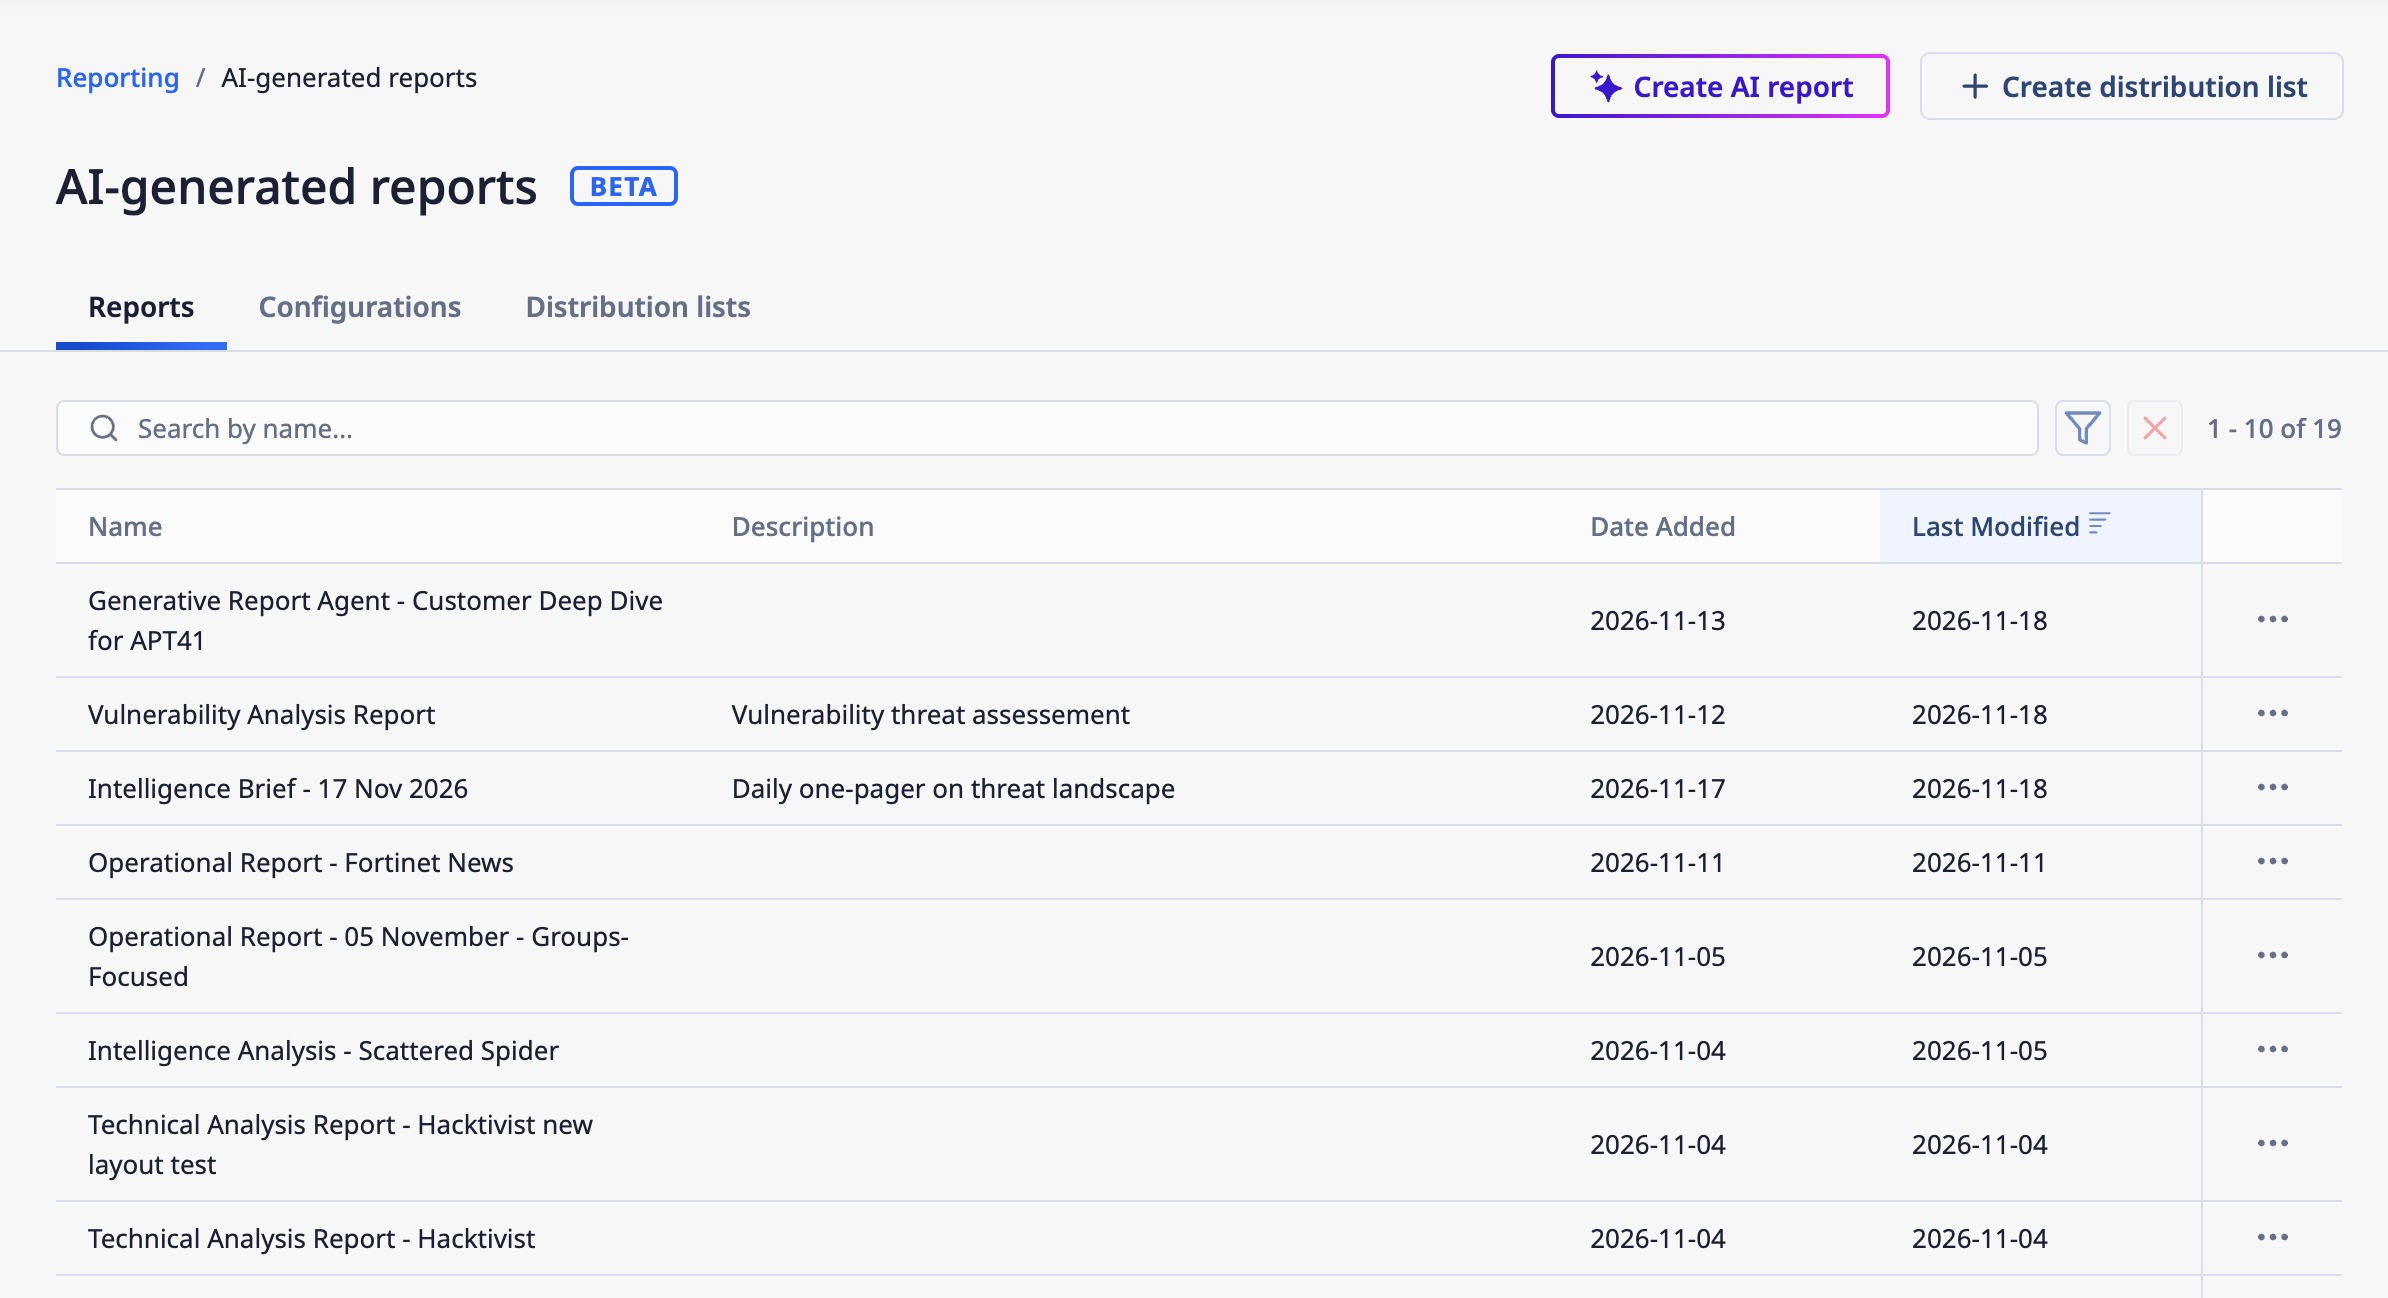
View and edit saved AI-generated reports on the Reports tab
Report Configurations
A report configuration is the set of instructions for creating a report with the generative report agent. It determines the information that is gathered and analyzed and how the results are presented. The Configurations tab of the new AI-generated reports screen lists all the configurations for AI-generated reports in your Organization. From here, you can select a configuration to view and edit its details and delivery schedule and history, edit a configuration’s metadata, save a copy of a configuration, and delete a configuration.
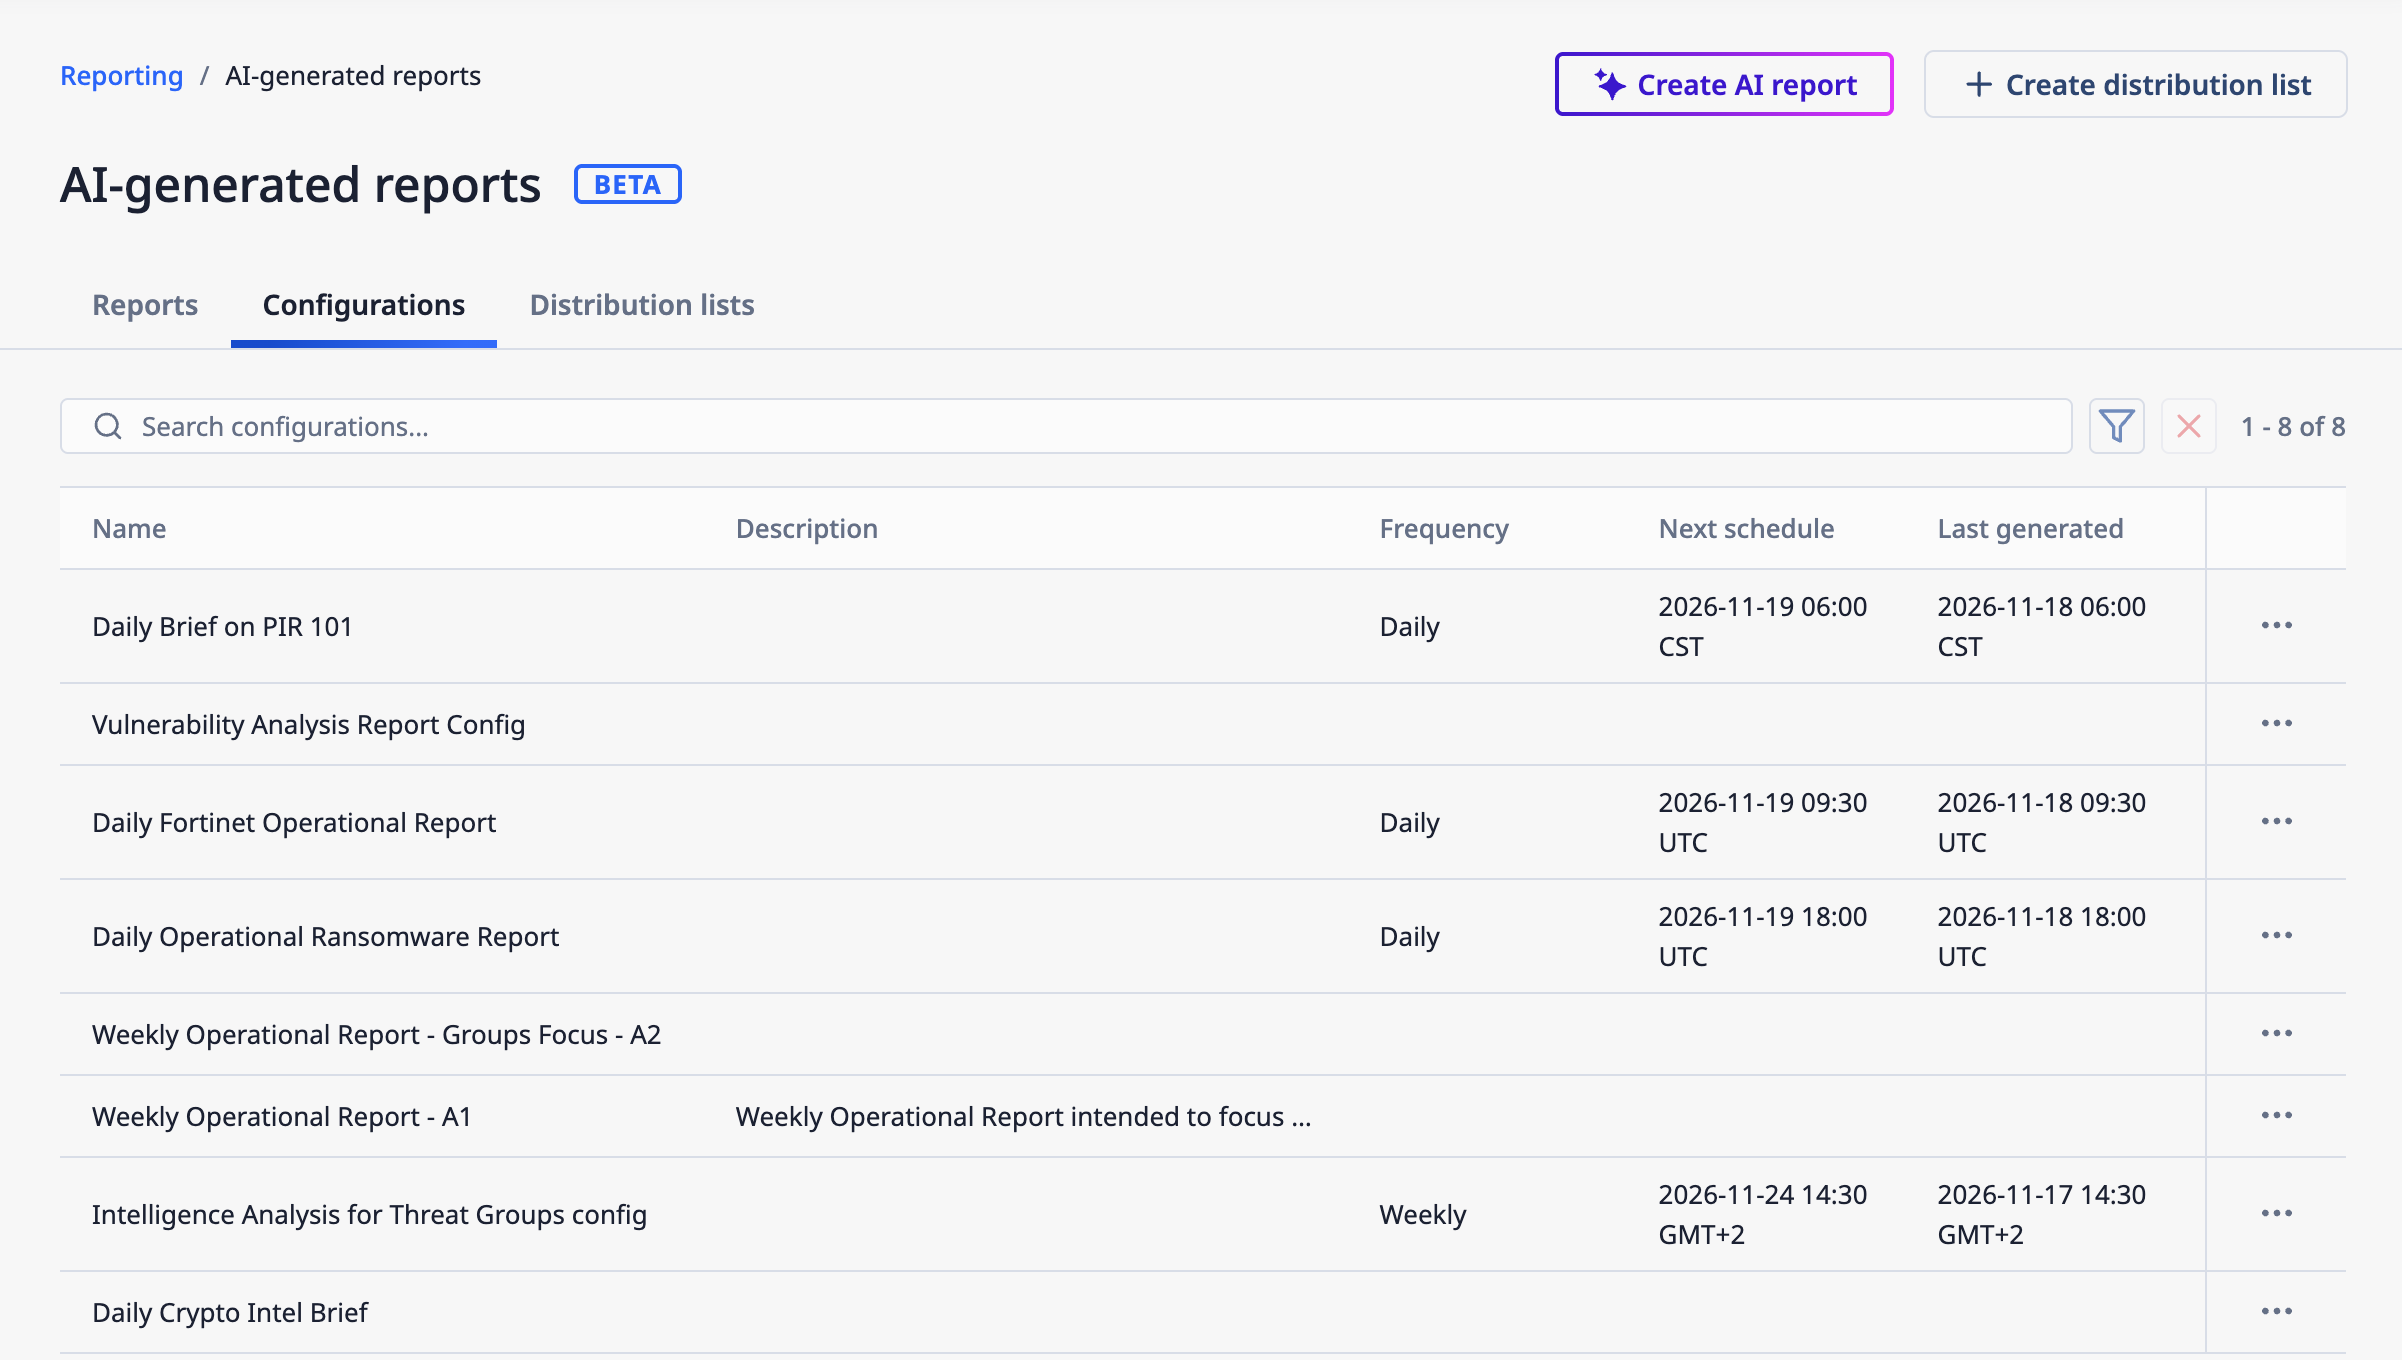
View and edit saved configurations for AI-generated reports on the Configurations tab
To create a report configuration with the generative report agent, click Create AI report from any tab on the AI-generated reports screen and fill out the fields on the Create AI report drawer as follows:
- Step 1 (Scope): In this part, you define the dataset that reports created from this configuration will cover. First, select an object type (Groups, Indicators, or Intelligence Requirements), and then provide the criteria that determine the set of objects to include. You can use filters (for example, Group type, Tags, or Name/Summary), write your own TQL query, or select a saved TQL query. When using filters, you must define a time scope for the Date Added, Last Modified, or (for Indicators only) Observed Since field and then select a range of Past 24 hours, Past 7 days, or Past 30 days. Because these ranges are relative, fresh data are pulled each time the report runs. Similarly, if you use TQL, you should include a date condition with a range using a relative date. Finally, select the types of associated objects to include in the report’s analysis and, for Groups and Indicators, the owners whose data are to be included in the report.Important
- If you configure filters and then switch to TQL, the filter conditions are converted to TQL, but the time scope is not.
- If you write a TQL query and then switch to filters, the TQL is not converted to filter conditions.
- Step 2 (Configure): This is where you pick the format that applies to the report’s intended audience, select the report’s look and feel, and provide a description to help the AI generate optimal results. First, for the format, you can choose Executive Brief, Deep Dive Intelligence Analysis, Technical Analysis, Operational, and Intelligence Brief. Then, for the style, you can select the custom branding your Organization Administrator has configured (if available) or one of the other preconfigured options. Next, add a natural-language description of the report’s focus, audience, and level of detail. The more specific the description, the more relevant the report’s output is likely to be. Finally, generate the report and, if desired, save the report and/or its configuration.
- Click Generate Report, and choose whether to save the report and the configuration.
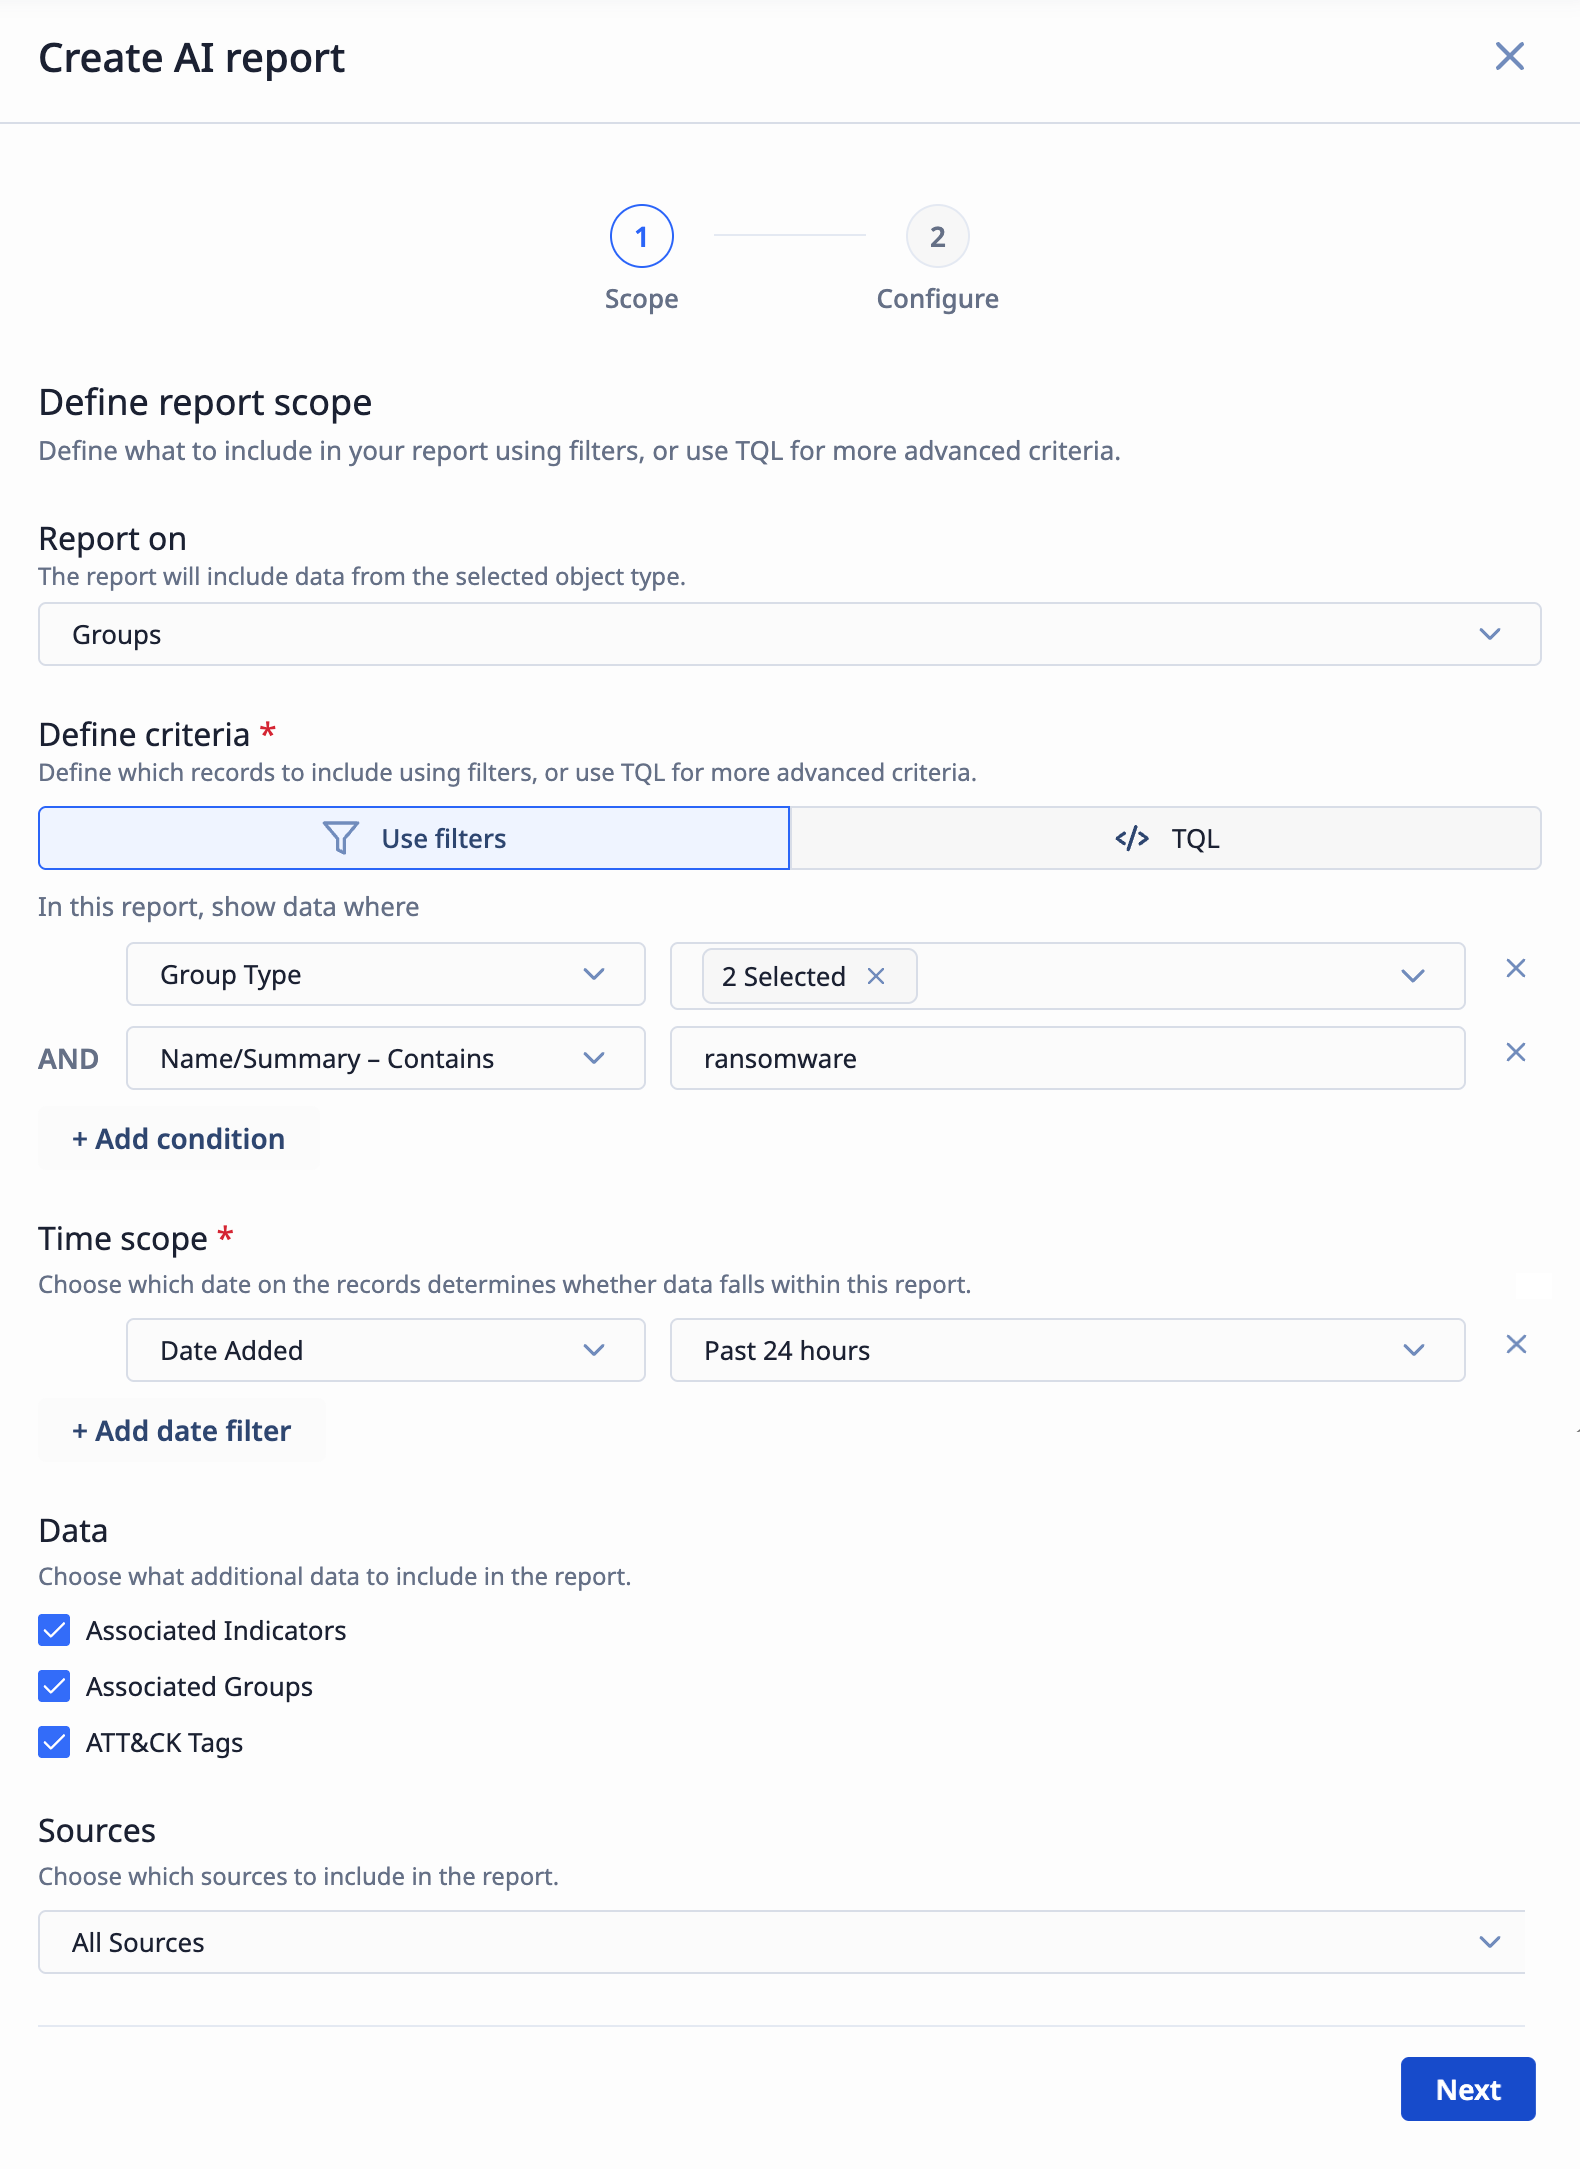
Use filter options or TQL to define the dataset for an AI-generated report
Report Distribution and Delivery
Distribution lists ensure your reports get to the right people and keep a record of those deliveries. The Distribution lists tab of the new AI-generated reports screen provides all the distribution lists for AI-generated reports in your Organization. From here, you can view, edit, and delete distribution lists.
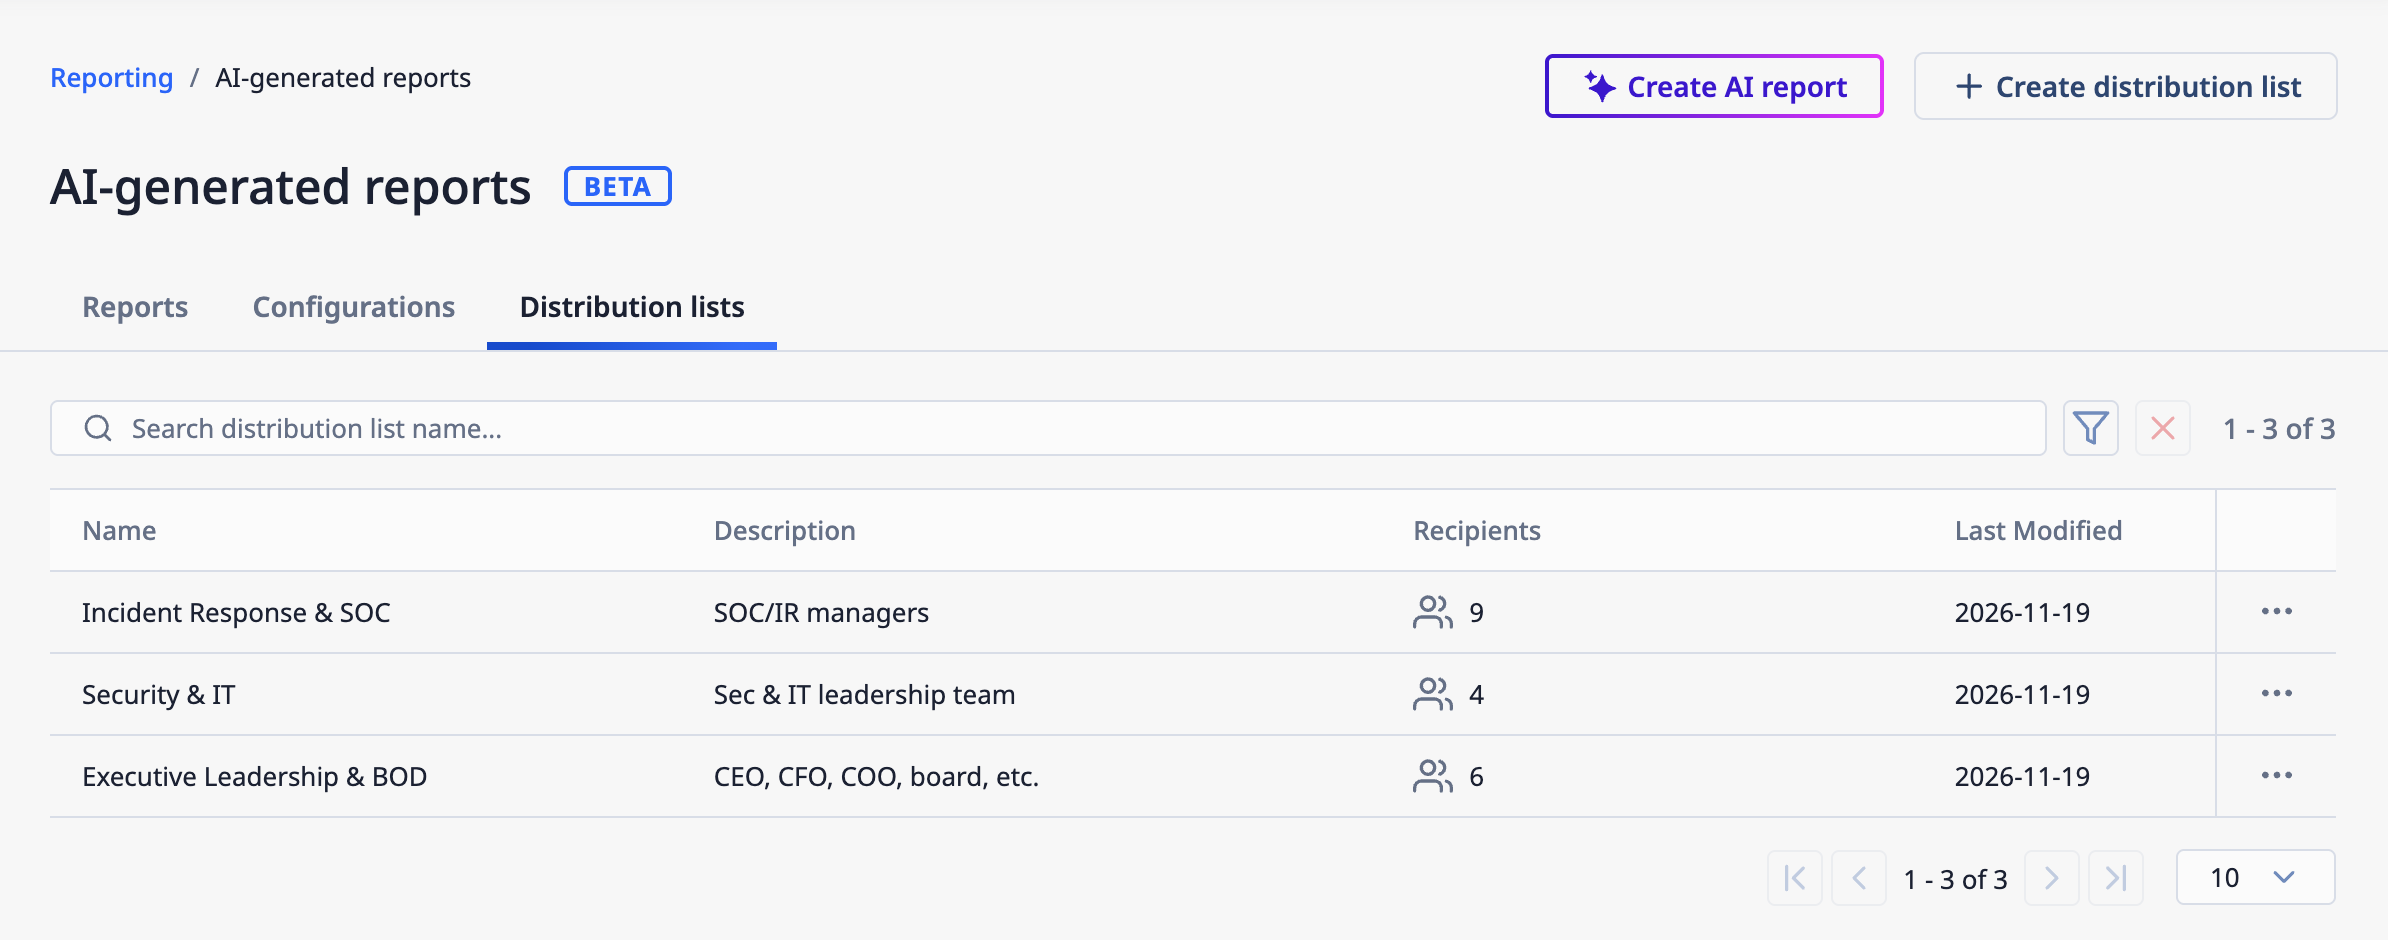
View and edit distribution lists for AI-generated reports on the Distribution lists tab
To create a distribution list, click Create distribution list from any tab on the AI-generated reports screen and enter a name, a description, and the recipients’ email addresses.
To schedule delivery for reports generated from a configuration, open the configuration and select the Delivery tab. From there, you can set the report to be sent daily, weekly, or monthly at a specific time and in a specific time zone, select one or more distribution lists as recipients, and see when the next delivery will occur. You can also edit the schedule or pause it to stop deliveries without deleting it. The Delivery tab also provides the delivery history for the configuration, including the time and status (fully delivered, partially delivered, or failed) of each delivery.
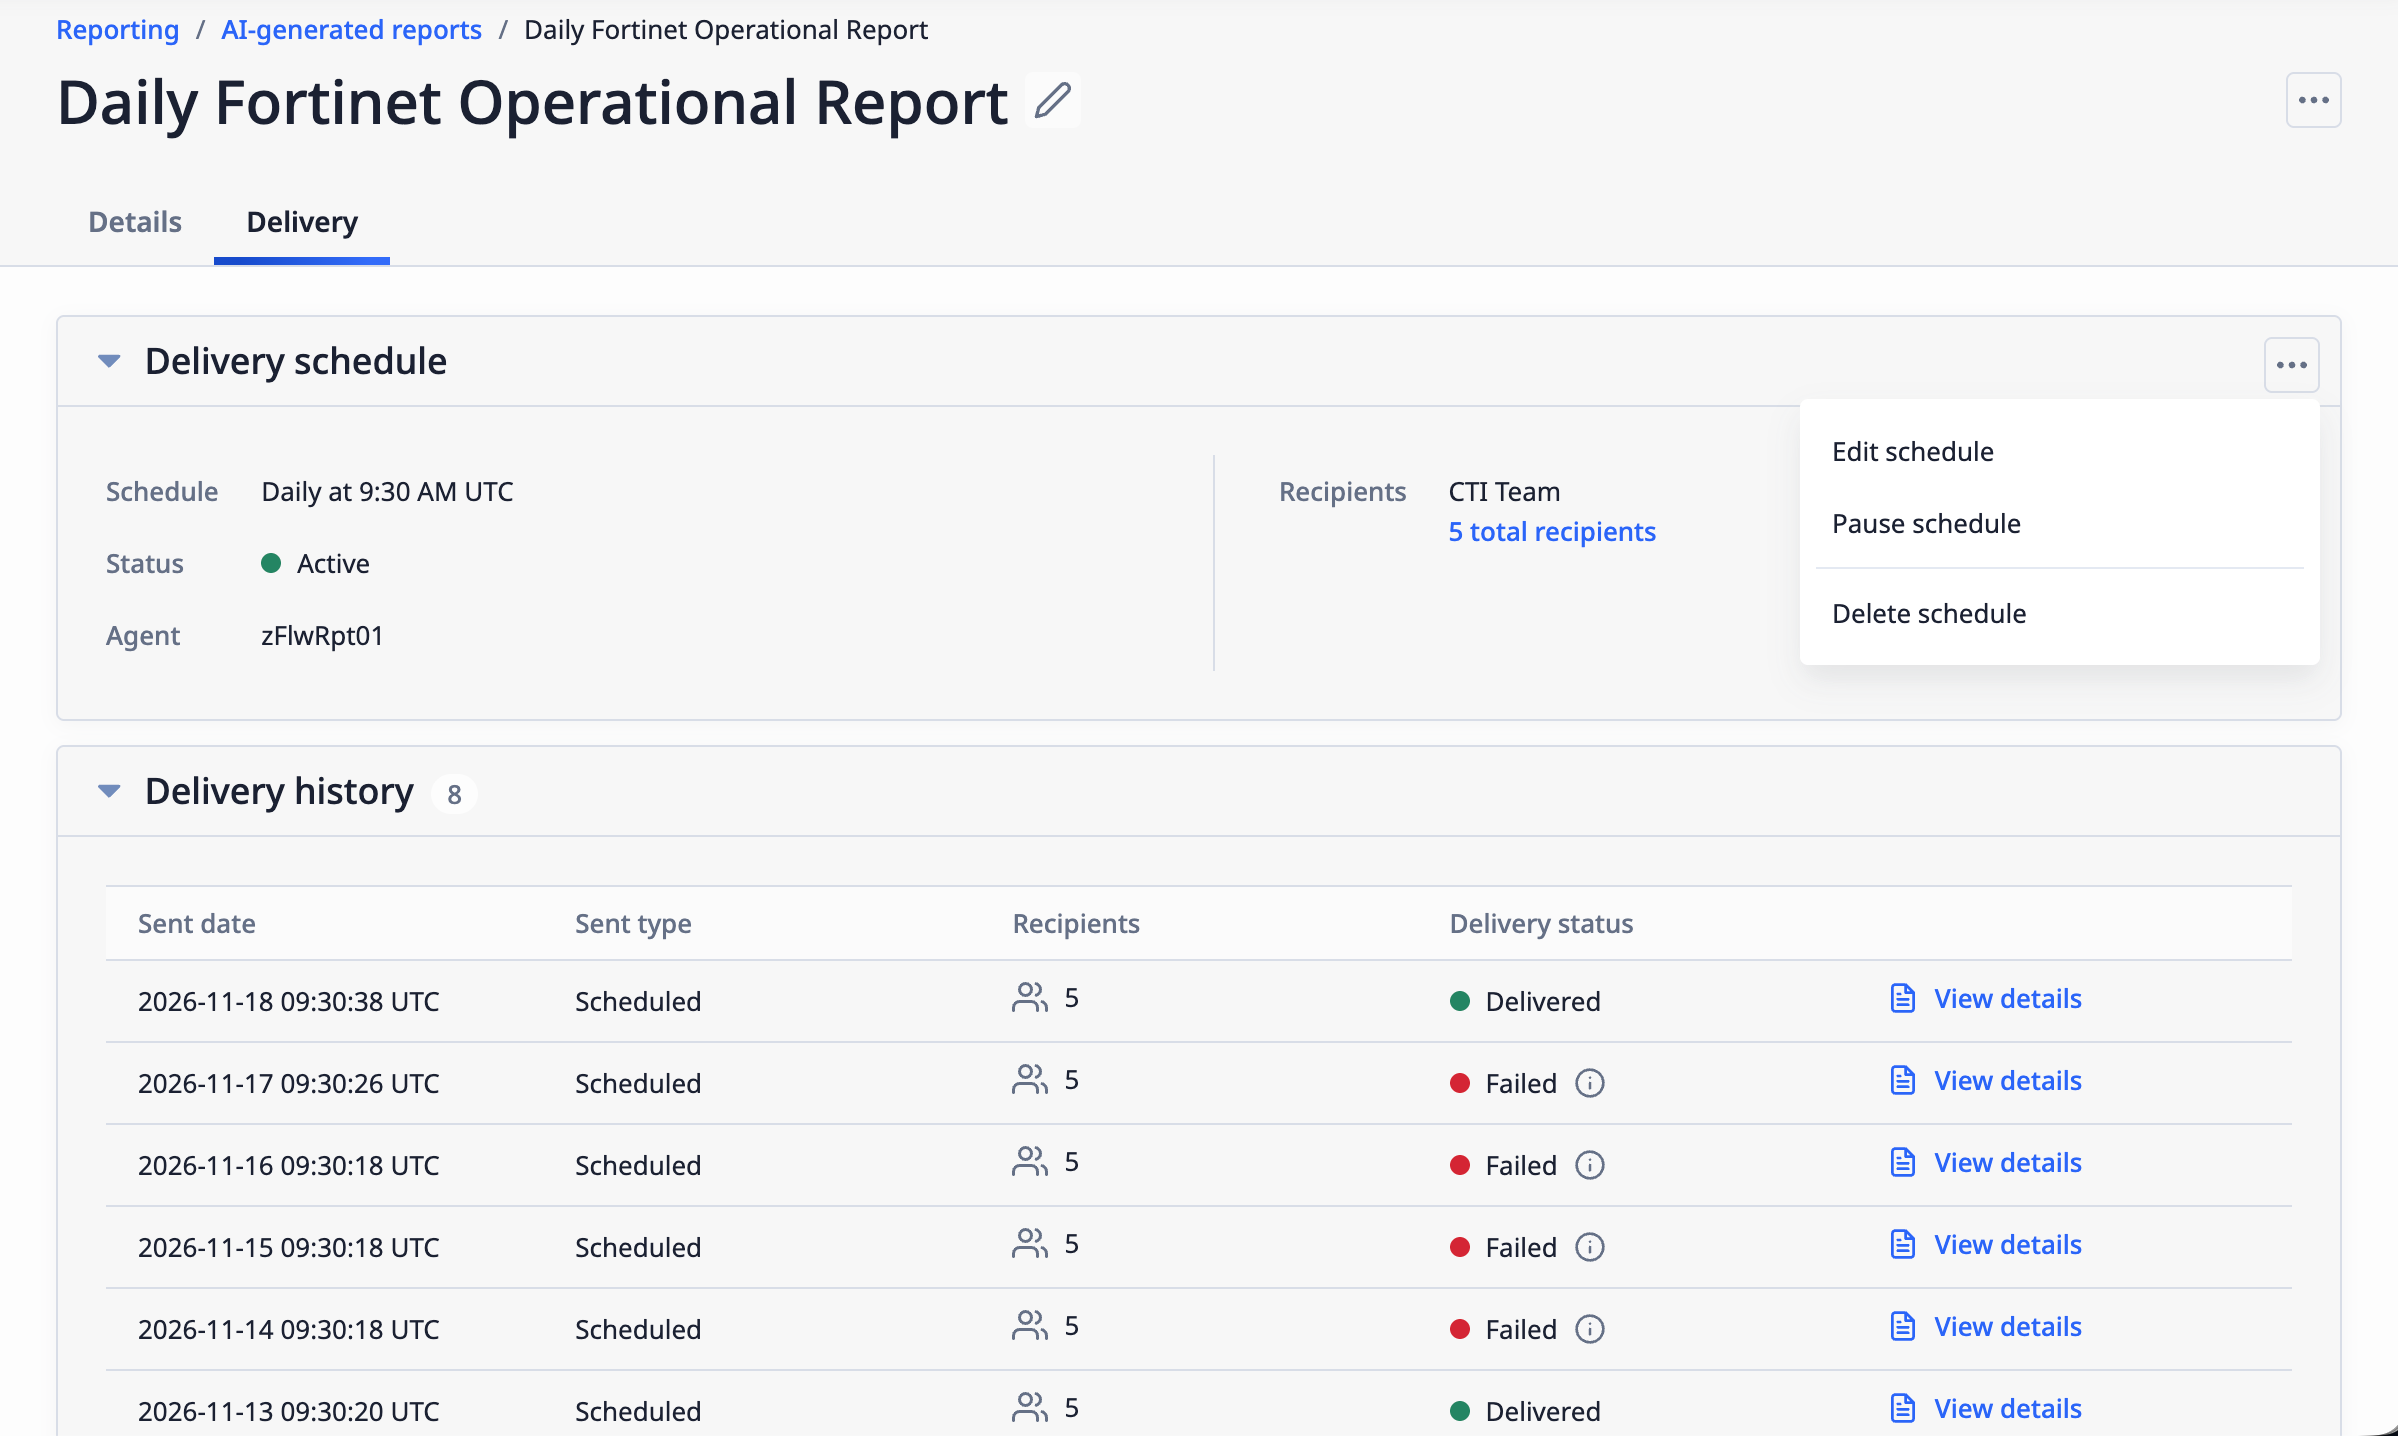
Manage a report configuration’s delivery schedule and view its delivery history
MITRE ATLAS Integration
Adversaries are increasingly targeting AI and machine learning systems, and many teams are now expected to track and report on those techniques the same way they do for MITRE ATT&CK®. Until now, the only way to do that in ThreatConnect was to build a custom playbook that imported MITRE ATLAS data.
In ThreatConnect 8.2, MITRE ATLAS has a Visualizer feature that works like the Enterprise ATT&CK Visualizer. The data are kept current by CAL, so you do not have to maintain anything yourself. Like ATT&CK Tags, ATLAS techniques (including sub-techniques) are available as a designated Tag type, and you can use TQL to search and filter on them.
ATLAS Tags
An ATLAS Tag is a system-level Tag that represents a technique or sub-technique in the MITRE ATLAS matrix. ATLAS Tags are tied directly to the ATLAS Visualizer, as they must be applied to a Group in order to view the Group’s techniques and sub-techniques in the ATLAS Visualizer.
Everywhere in the platform that you can view and manage Tags, you’ll now see three sections: standard Tags, ATLAS Tags, and ATT&CK Tags. Filter the list to find the Tags you want, apply any combination of the three types, and save. The applied Tags are listed under the same three sections, so ATLAS Tags are always clearly distinguishable from ATT&CK Tags. Like ATT&CK Tags, ATLAS Tags are available for use in all owners on an instance and do not have an owner themselves.
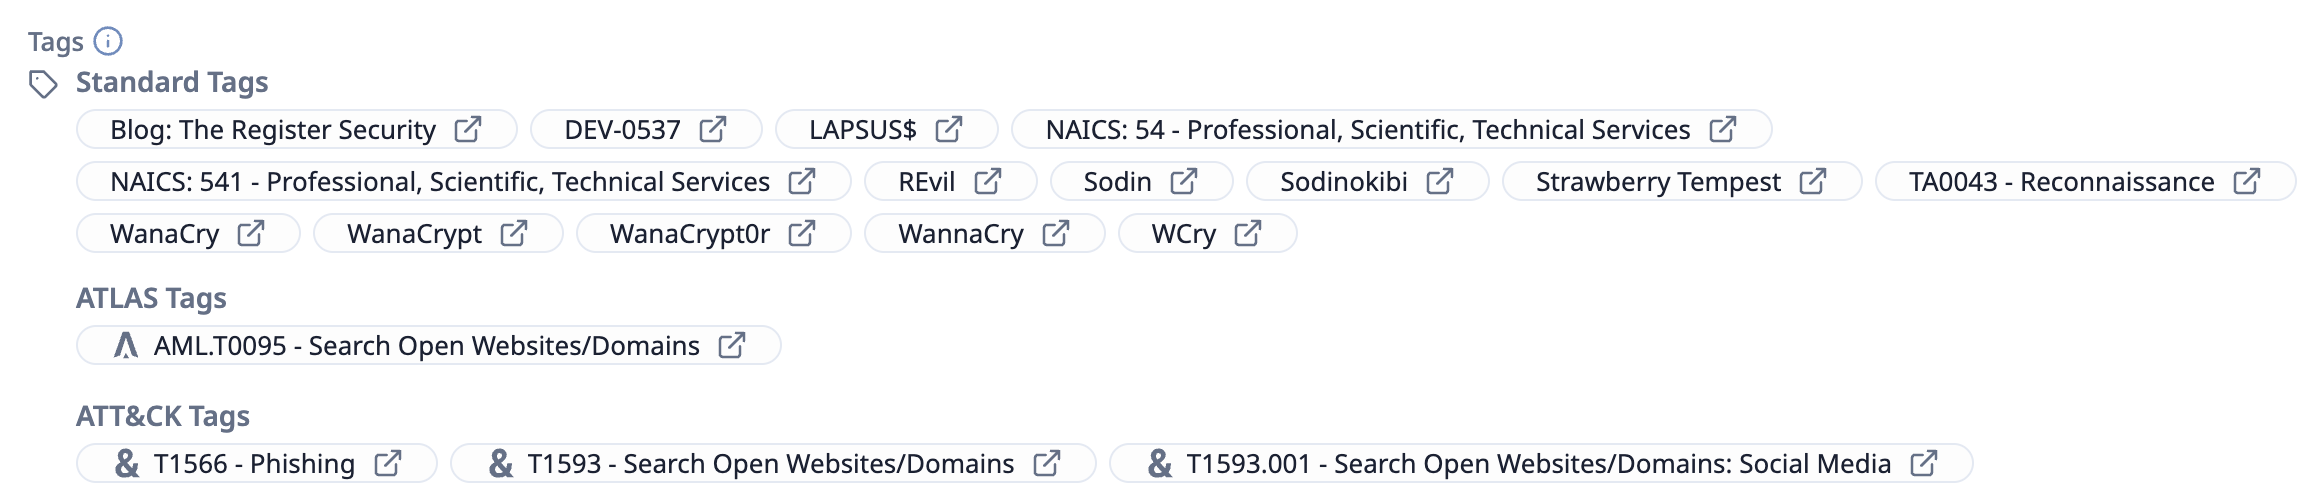
The Tags section on an object’s Details screen shows a new section for ATLAS Tags
ATLAS Visualizer
The new ATLAS Visualizer feature is available in the Tools menu and as an option in all Visual Analysis menus for Group objects. Just like in the ATT&CK Visualizer, you can create a view, import a view from the MITRE ATLAS Navigator, and export a view as a JSON or PNG file. Within a view, you can select a technique to view its description and sub-techniques and see which Groups in your ThreatConnect owners are associated with it. In addition, you can add Groups as analysis layers and select an overlay: Use Threat Group Comparison to discover shared tactics, techniques, and procedures (TTPs); Technique Prevalence to identify the most prevalent techniques amongst the set; or Security Coverage to evaluate your organization’s security posture across the techniques to uncover coverage gaps. You can filter the view by traits specific to ATLAS: platform (the system an adversary operates within: Agentic AI, Enterprise, Generative AI, or Predictive AI) and maturity (an authored assessment of the evidence supporting a technique: Feasible, Demonstrated, or Realized).
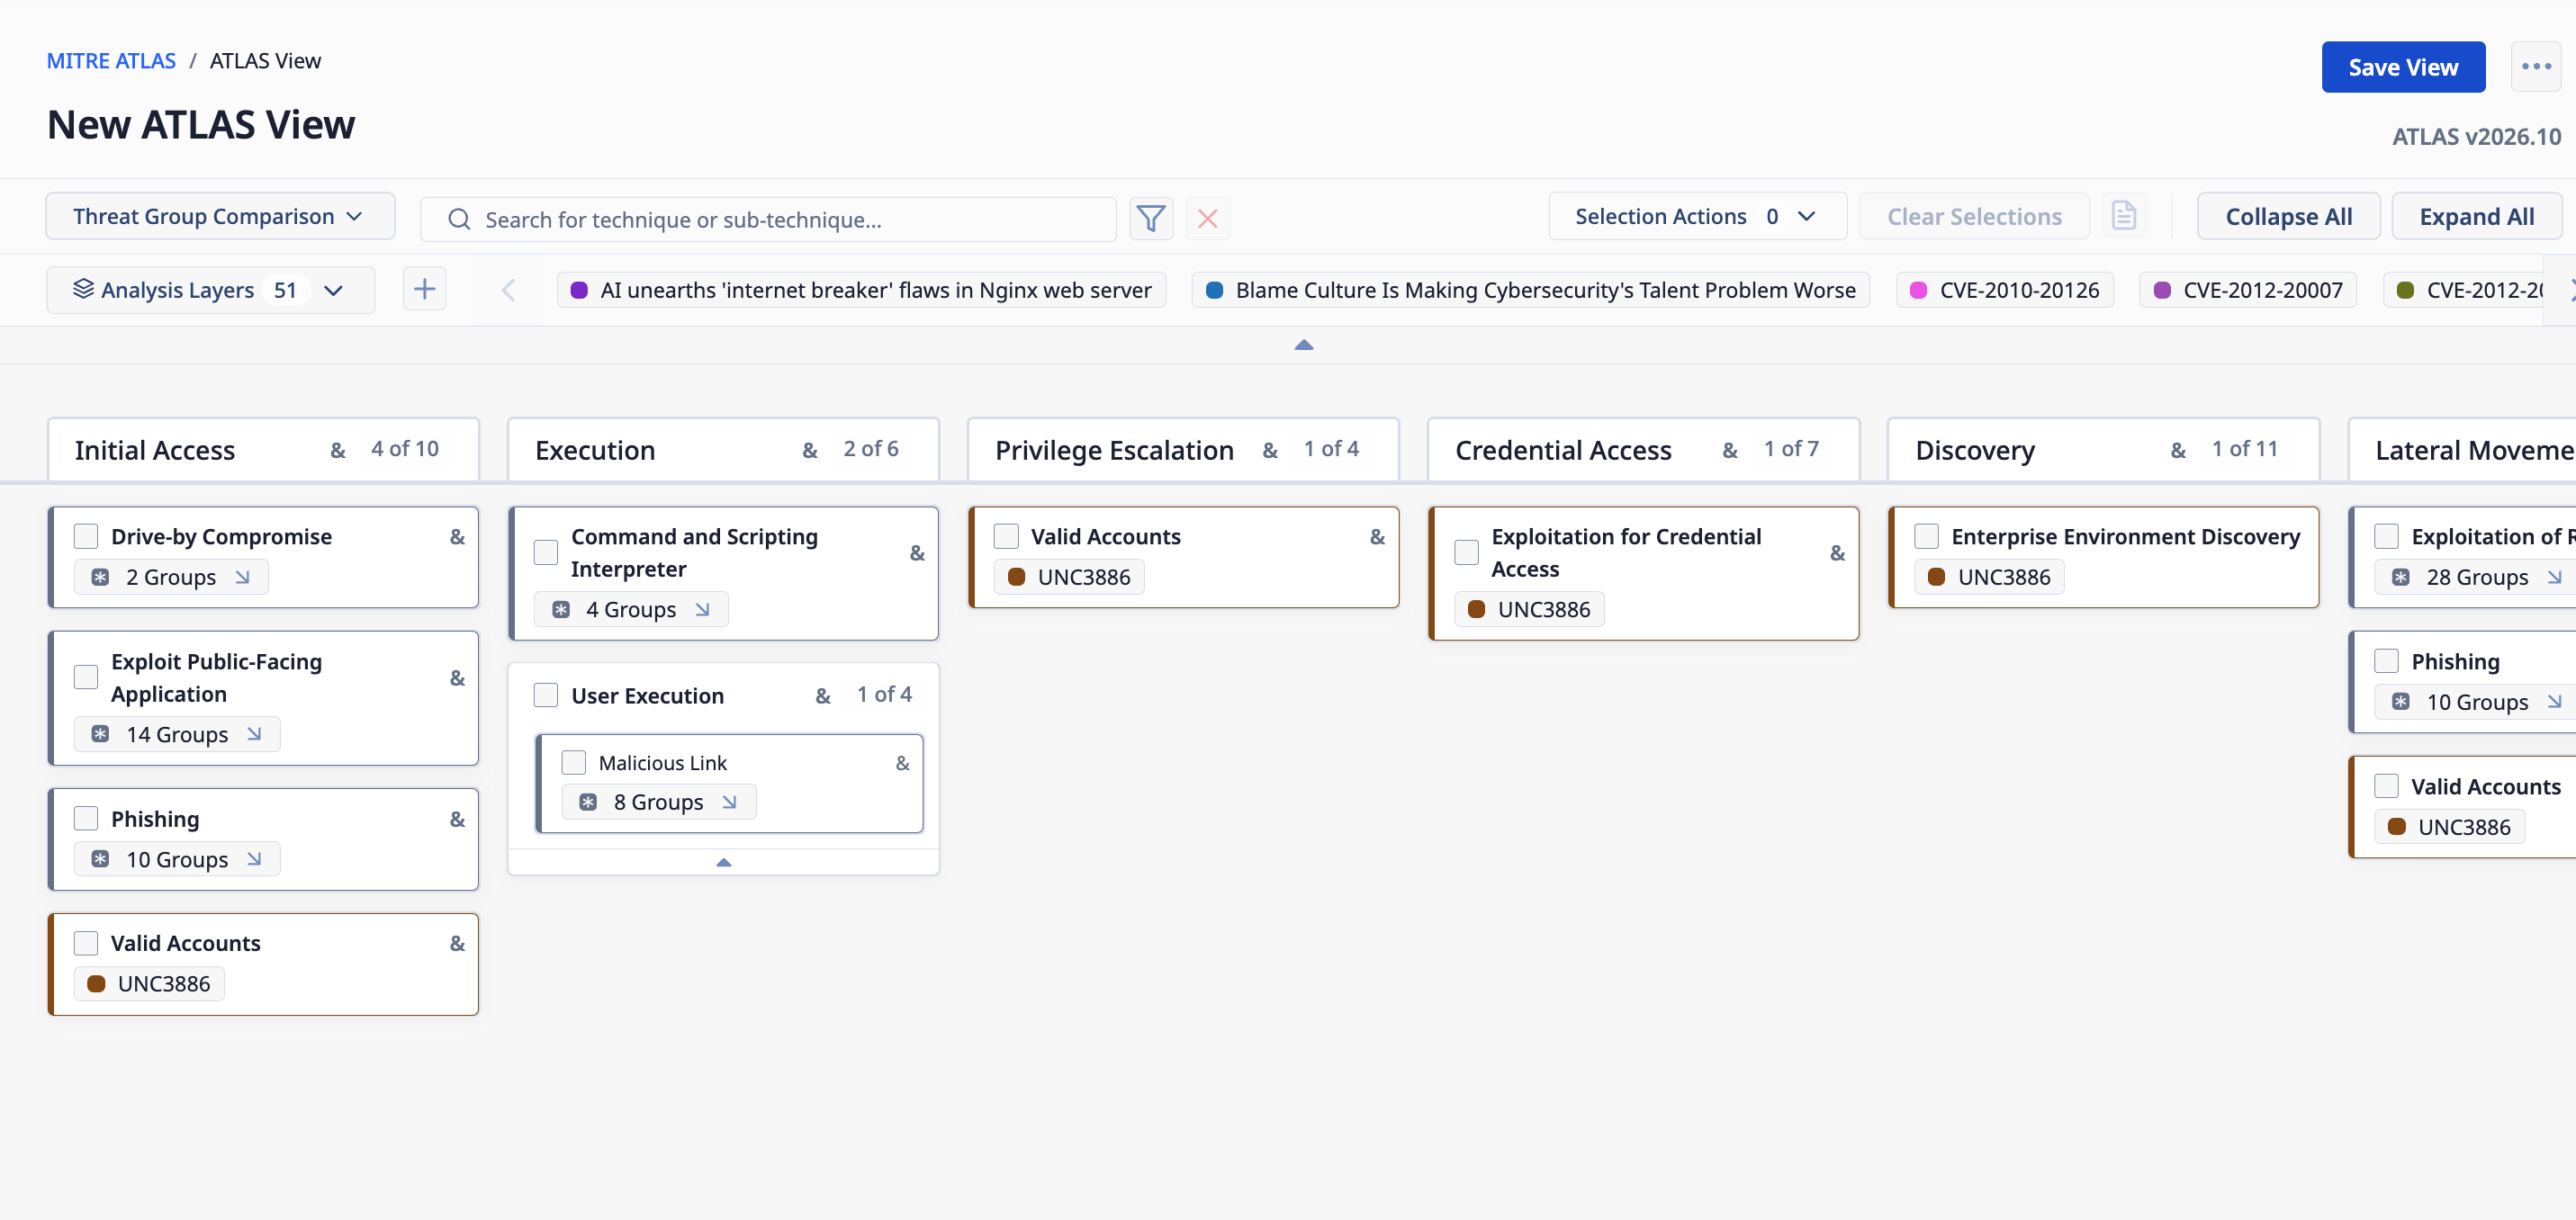
Use the ATLAS Visualizer to track and analyze adversary tactics and techniques involving AI
[Beta] AI Hybrid Search: Behind the Scenes
AI hybrid search is a new feature, currently in beta, that combines keyword search with semantic search. Instead of matching only the words you type, it also finds objects whose meaning is close to your query. For example, a search for “ransomware healthcare VPN” could surface content about compromised hospital appliances even though the exact wording differs. The Agentic TIP’s AI hybrid search capability ranks the initial set of results, re-scores the strongest ones (based on how relevant the result is to the query), and returns no results when it is not confident in any of the results, rather than showing weak, potential matches.
In version 8.2, AI hybrid search is available through the Ask AI query agent (which has been improved for this release), the Data Model Knowledge option in an Agent node’s configuration in agentic playbooks, and the new AI Hybrid Search playbook app.
Use AI Hybrid Search in Agentic Playbooks
In agentic playbooks, you can leverage AI hybrid search when configuring Data Model Knowledge for an Agent node:
- When editing the agent, select the Knowledge tab.
- Select Data Model Knowledge from the Add Knowledge dropdown.
- On the Add Data Model Knowledge window, select All Objects from the Search Sets section of the Model Type dropdown.
- In the Search Type field, select AI Hybrid Search.
- Use the remaining fields to customize the way the agent matches results to queried terms to align the results with your needs.
This configuration tells the agent to search all of the object types that support AI hybrid search. Currently, the following object types support AI hybrid search:
- Groups: Adversary, Attack Pattern, Campaign, Course of Action, Document, Email, Event, Incident, Intrusion Set, Malware, Report, Signature, Tactic, Task, Threat, Tool, Vulnerability
- Indicators: Address, ASN, CIDR, Email Address, File, Host, Mutex, URL, and User Agent
- Tags
- Cases
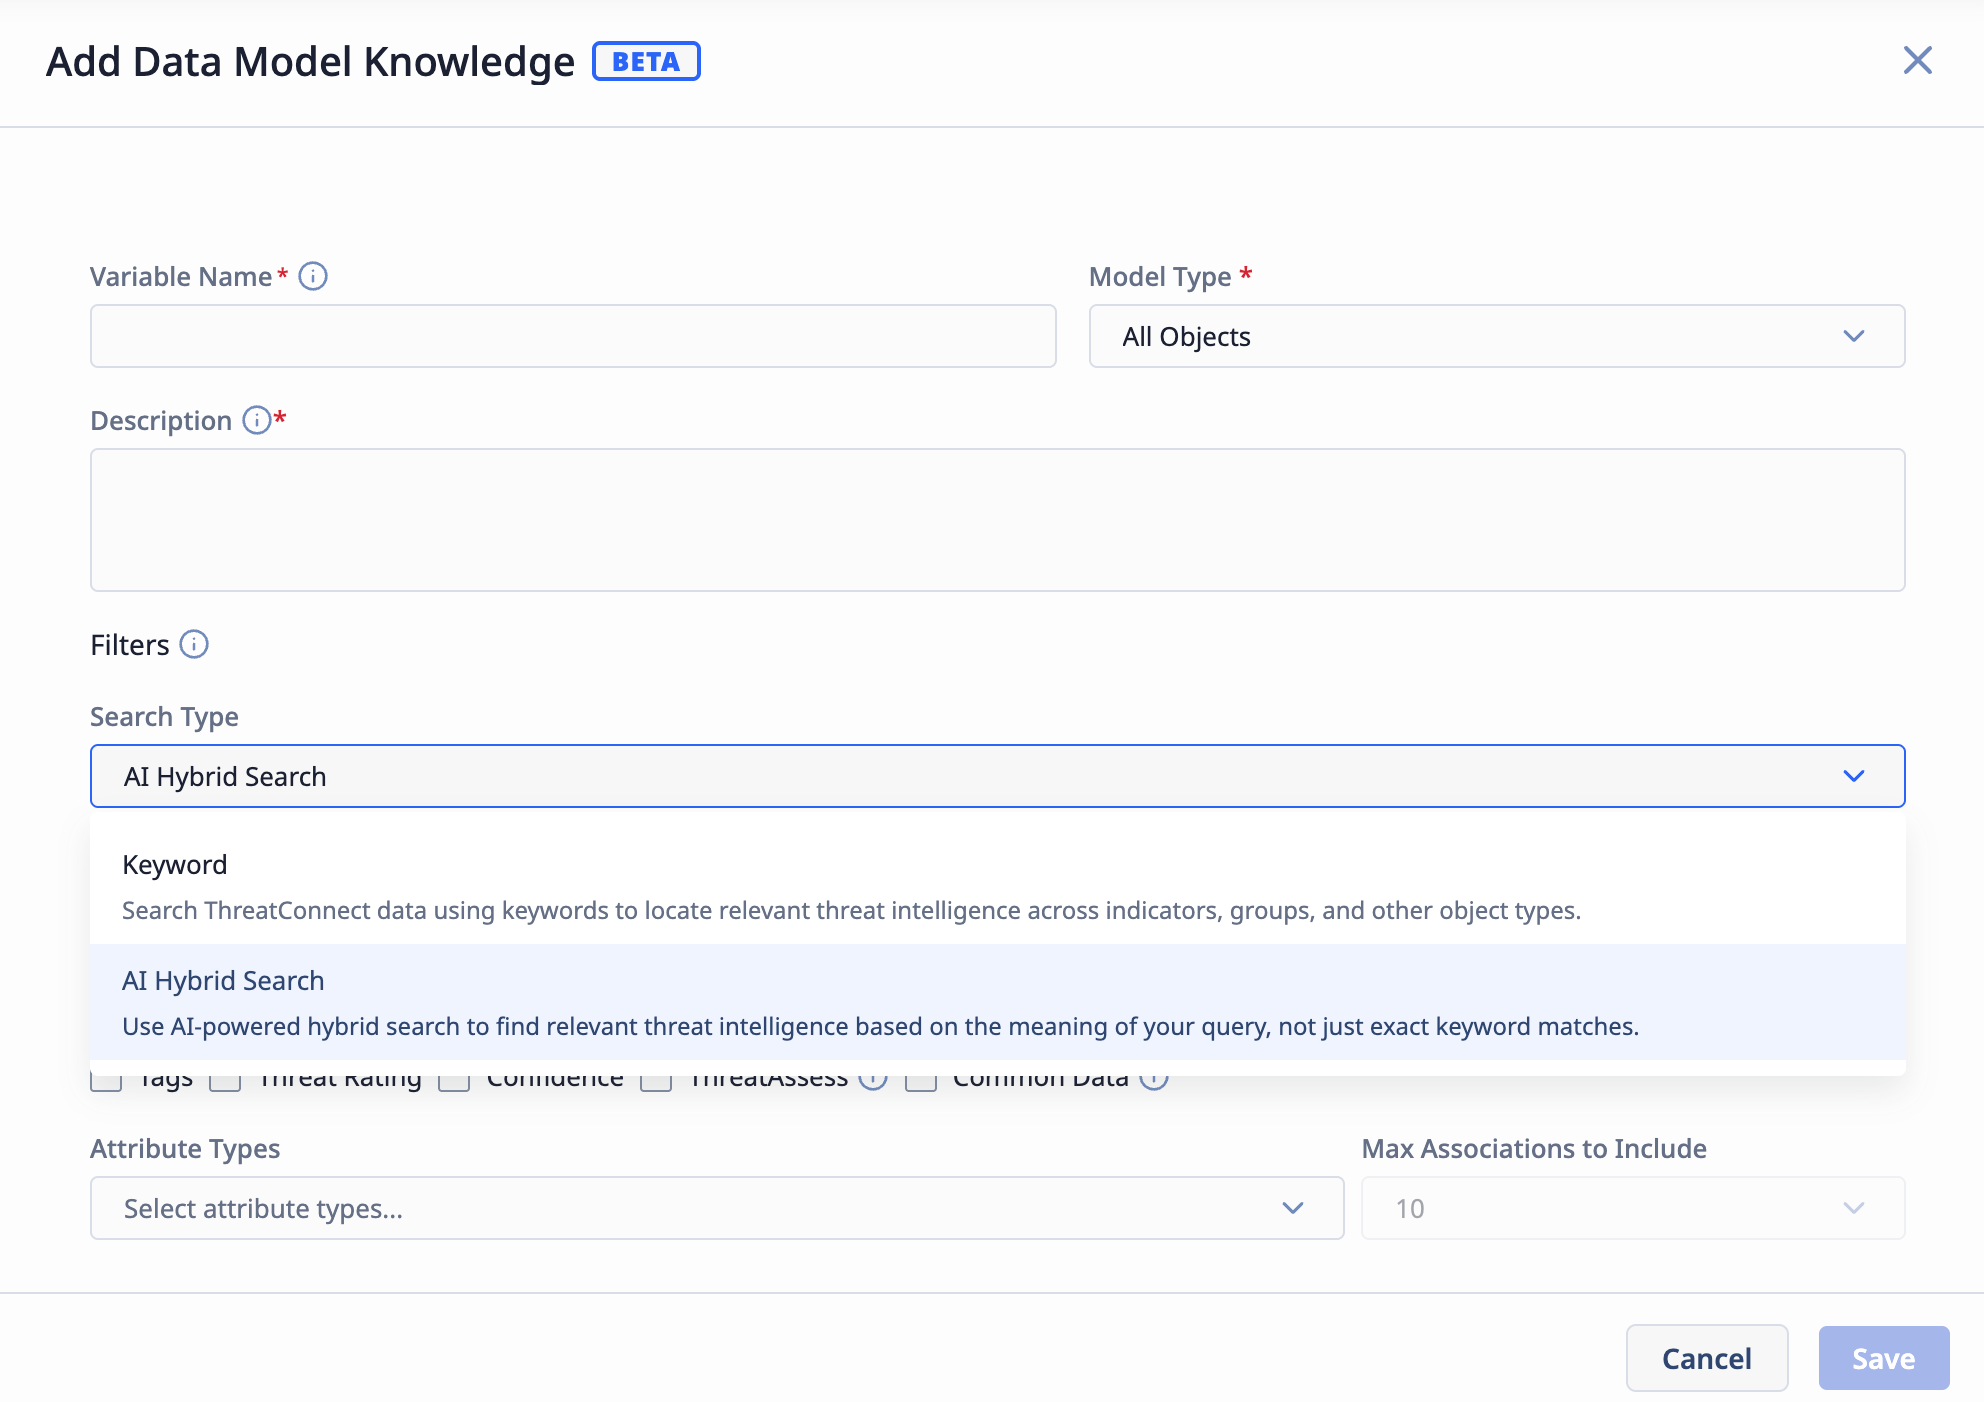
AI hybrid search is available when configuring Data Model Knowledge for an agent node in playbooks
In addition, the new AI Hybrid Search playbook app has an AiSearch option under the Search Type field in its configuration that allows you to run an AI hybrid search query on Groups, Indicators, Cases, Tags, Victims, or all object types. This app returns search results along with a status of results, no_results, or abstained. A status of abstained means that AI hybrid search found no match that it was confident enough to return.
Improvements
Coming soon!
Bug Fixes
Coming soon!
Dependencies & Library Changes
Coming soon!
Maintenance Releases Changelog
Coming soon!
ThreatConnect® is a registered trademark, and CAL™ is a trademark, of ThreatConnect, Inc.
DomainTools® is a registered trademark of DomainTools, LLC.
MITRE ATT&CK® and ATT&CK® are registered trademarks, and MITRE ATLAS™ is a trademark, of The MITRE Corporation.