Overview
The Threat Graph feature in ThreatConnect® provides a graph-based interface that you can use to discover, visualize, and contextualize associations and relationships between Indicators, Groups, Cases, and Tags. The Pivot in ThreatConnect option in Threat Graph lets you explore the following types of associations that exist in ThreatConnect:
- Custom, direct Indicator to Indicator
- Indicator to Group
- Indicator to Case
- Indicator to Tag
- Group to Indicator
- Group to Group
- Group to Case
- Group to Tag
- Case to Indicator
- Case to Group
- Case to Case
- Case to Tag
- Tag to Indicator
- Tag to Group
- Tag to Case
Before You Start
User Roles
- To pivot on associations for Indicators, Groups, and Tags in an Organization in Threat Graph, your user account can have any Organization role.
- To pivot on associations for Indicators, Groups, and Tags in a Community or Source in Threat Graph, your user account can have any Community role except Banned for that Community or Source.
- To pivot on associations for Cases in an Organization in Threat Graph, your user account can have any Organization Role except App Developer.
Prerequisites
- To pivot on Case associations in Threat Graph, turn on Workflow for your Organization on the Account Settings screen (must be an Accounts Administrator, Operations Administrator, or System Administrator to perform this action).
Performing a Pivot
Follow these steps to pivot on associations in ThreatConnect from an Indicator, Group, Case, or Tag in Threat Graph:
- Open Threat Graph.
- Select an Indicator, Group, Case, or Tag node on the graph.
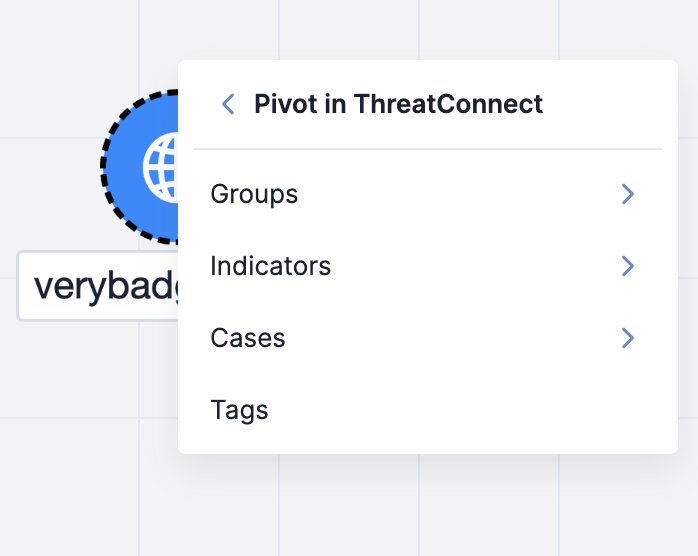
- Select Pivot in ThreatConnect in the node’s menu, and then select the type of object to pivot on in the Pivot in ThreatConnect submenu (Figure 1). Available options include Groups, Indicators, Cases, and Tags.
Groups
Follow these steps to pivot on Group associations from an Indicator, Group, Case, or Tag in Threat Graph:
- Select an Indicator, Group, Case, or Tag node on the graph.
- Select Pivot in ThreatConnect in the node’s menu, and then select Groups.
- Select a Group type to pivot on, or select All Groups to pivot on all Group types. If Groups of the selected type(s) are associated to the object you are pivoting from, the following items will be added to the graph:
- One or more associated Group nodes, each with a node label that displays the corresponding Group’s summary.
- One or more orange arrows, each connecting an associated Group node to the node from which you pivoted.
Figure 2 shows two pivots on Group associations in Threat Graph:
- The first pivot is on associations to the Threat Group type from the verybadguy.com Host Indicator. This pivot returns one Group that is associated to verybadguy.com—the Menace Initiative Threat Group—and adds it to the graph.
- The second pivot is on associations to all Group types from the Menace Initiative Threat Group. This pivot returns four Groups of varying types that are associated to Menace Initiative and adds them to the graph.
Indicators
Pivoting on Indicators From an Indicator
Follow these steps to pivot on Indicator associations from an Indicator in Threat Graph:
- Select an Indicator node on the graph.
- Select Pivot in ThreatConnect in the node’s menu, and then select Indicators.
- Select a custom Indicator-to-Indicator association type to pivot on, or select All to pivot on all available association types. (The list of association types includes all custom Indicator-to-Indicator association types on your ThreatConnect instance that are available for the type of Indicator from which you are pivoting.) If associations of the selected type(s) exist for the Indicator you are pivoting from, the following items will be added to the graph:
- One or more associated Indicator nodes, each with a node label that displays the corresponding Indicator’s summary.
- One or more orange arrows, each connecting an associated Indicator node to the Indicator node from which you pivoted.
Figure 3 shows a pivot on the Domain Registrant Email Indicator association type from the verybadguy.com Host Indicator in Threat Graph. This pivot returns four Email Address Indicators that are associated to verybadguy.com and adds them to the graph..
Pivoting on Indicators From a Group, Case, or Tag
Follow these steps to pivot on Indicator associations from a Group, Case, or Tag in Threat Graph:
- Select a Group, Case, or Tag node on the graph.
- Select Pivot in ThreatConnect in the node’s menu, and then select Indicators.
- Select an Indicator type to pivot on, or select All Indicators to pivot on all Indicator types. If Indicators of the selected type(s) are associated to the object you are pivoting from, the following items will be added to the graph:
- One or more associated Indicator nodes, each with a node label that displays the corresponding Indicator’s summary.
- One or more orange arrows, each connecting an associated Indicator node to the node from which you pivoted.
Figure 4 shows a pivot on associations to all Indicator types from the Menace Initiative Threat Group in Threat Graph. This pivot returns three new Indicators of varying types that are associated to Menace Initiative and adds them to the graph. It also returns an association back to the verybadguy.com Host Indicator, resulting in the arrow between Menace Initiative and verybadguy.com changing to a bidirectional arrow.
Cases
Follow these steps to pivot on Case associations from an Indicator, Group, Case, or Tag in Threat Graph:
- Select an Indicator, Group, Case, or Tag node on the graph.
- Select Pivot in ThreatConnect in the node’s menu, and then select Cases.
- Select the owner of the object in which you want to pivot. If Cases are associated to the object in the selected owner, the following items will be added to the graph:
- One or more associated Case nodes, each with a node label that displays the corresponding Case’s name.ImportantIf you do not have viewing access to an associated Case, it will not be added to the graph.
- One or more orange arrows, each connecting an associated Case node to the node from which you pivoted.
- One or more associated Case nodes, each with a node label that displays the corresponding Case’s name.
Figure 5 shows two pivots on Case associations in Threat Graph:
- The first pivot is from the copy of the verybadguy.com Host Indicator that exists in the Documentation Team owner. This pivot returns four Cases that are associated to verybadguy.com and adds them to the graph.
- The second pivot is from the Analyze Suspicious Email and Report Findings Case that exists in the Documentation Team owner. This pivot does not add new Cases to the graph. However, it returns associations between Analyze Suspicious Email and Report Findings and two Cases already on the graph (Phishing Investigation and Spearphishing Case).
Tags
Follow these steps to pivot on Tag associations from an Indicator, Group, or Case in Threat Graph:
- Select an Indicator, Group, or Case node on the graph.
- Select Pivot in ThreatConnect in the node’s menu, and then select Tags. If Tags are applied to the object you pivoted from, the following items will be added to the graph:
- One or more associated Tag nodes, each with a node label that displays the corresponding Tag’s name.
- One or more orange arrows, each connecting an associated Tag node to the node from which you pivoted.
Figure 6 shows two pivots on Tag associations in Threat Graph:
- The first pivot is on Tag associations from the verybadguy.com Host Indicator. This pivot returns four Tags associated to verybadguy.com and adds them to the graph.
- The second pivot is on associations to all Indicator types from the Malicious Host Tag. This pivot returns two new Indicators that have the Malicious Host Tag applied to them and adds to the graph. It also returns an association back to the verybadguy.com Host Indicator, resulting in the arrow between Malicious Host and verybadguy.com changing to a bidirectional arrow.
Pivoting Behaviors
When using the Pivot in ThreatConnect option in Threat Graph, you may observe the following behaviors as you interact with and add nodes to the graph:
- If an Indicator, Group, or Tag has multiple owners, a dashed, black border will be applied to its node when you select it, as in Figure 1.
- If you select Pivot in ThreatConnect for an Indicator or Group does not exist in one of your ThreatConnect owners (e.g., you selected Pivot in ThreatConnect for an Indicator or Group added to the graph via the Pivot with CAL option), the Pivot in ThreatConnect submenu will display a message stating the object does not exist in ThreatConnect.
- Pivoting on Indicator, Group, and Tag associations in ThreatConnect will return all associated objects of the selected type in all of your owners. For example, pivoting on associations to all Group types from a Host Indicator associated to a Threat Group in your Organization and an Adversary Group in one of your Communities will return both Groups.
- Pivoting from an object that belongs to multiple owners will return associated Indicators, Groups, or Tags across all of your owners. For example, pivoting on associations to the Threat Group type from an Indicator that exists in your Organization and one of your Sources will return Threat Groups associated to each copy of the Indicator. To determine the owner(s) of an associated Indicator, Group, or Tag, select View Details in the corresponding node’s menu.
- If you pivot from a Group in a given owner and there are multiple copies of the Group in the owner (that is, there is more than one Group with the same name and type in the owner), the pivot will return all objects associated to all copies of the Group in the owner.
- If you pivot from one node to a second node and then pivot from the second node back to the first node, the arrow connecting the two nodes will change to a bidirectional arrow. For example, the pivot in Figure 2 returned an association from the verybadguy.com Host Indicator to the Menace Initiative Threat Group. In Figure 4, the pivot from Menace Initiative to all Indicator types returned an association from Menace Initiative back to verybadguy.com, resulting in the arrow between Menace Initiative and verybadguy.com changing to a bidirectional arrow.
- If a pivot returns more than 500 associated objects, only the first 500 associated nodes and their respective connections will be added to the graph.
- If a pivot returns an associated object that belongs to multiple owners, a single node for the associated object will be added to the graph. To view details for the object in each of its owners, select View Details in the node menu for the associated object. Note that you can use the Owners dropdown in the Details drawer to switch between the object’s Details drawer in each of its owners.
ThreatConnect® is a registered trademark, and CAL™ is a trademark, of ThreatConnect, Inc.
20117-12 v.02.A