The Feed Explorer
- 16 Feb 2026
- 5 Minutes to read
-
Print
-
DarkLight
-
PDF
The Feed Explorer
- Updated on 16 Feb 2026
- 5 Minutes to read
-
Print
-
DarkLight
-
PDF
Article summary
Did you find this summary helpful?
Thank you for your feedback!
Overview
Intelligence feeds are structured data pipelines for ingesting Indicators (e.g., IP addresses, domains, file hashes, URLs) and Groups that help users evaluate the distinct value and quality of various intelligence sources.
The Feed Explorer screen displays active and inactive feeds on your ThreatConnect® instance, along with CAL™-derived metrics and a report card for each feed that compares its performance to aggregated data. System Administrators can use these metrics to determine which feeds they want to activate on their ThreatConnect instance.
Before You Start
User roles
- To view the Feed Explorer screen, your user account can have any Organization role.
- To view and activate feeds on the TC Exchange™ Settings screen, your user account must have a System role of Administrator.
Prerequisites
- System settings configured to populate the Feeds tab of the TC Exchange™ Settings screen (see the “Feeds” section of ThreatConnect System Administration Guide for more information).
- To calculate feed metrics, enable CAL for your ThreatConnect instance and in your Organization:
- To enable CAL for your ThreatConnect instance, select the CALEnabled checkbox on the Settings tab of the System Settings screen (must be a System Administrator to perform this action).
- To enable CAL in your Organization, edit your Organization on the Organizations tab of the Account Settings screen and select the Enable CAL Data checkbox on the Permissions tab of the Organization Information window (must be a System Administrator, Operations Administrator, or Accounts Administrator to perform this action).
Accessing the Feed Explorer
To access the Feed Explorer screen, do one of the following:
- From the Automation & Feeds dropdown on the top navigation bar, select Feed Explorer.
- (System Administrator only) From the Settings
 menu on the top navigation bar, select TC Exchange Settings, and then select the Feeds tab.
 - While viewing a dashboard, click the Owners dropdown and then click Feed Explorer.
Viewing Feeds
The Feed Explorer screen (Figure 1) displays all active open-source and CAL feeds on your ThreatConnect instance by default. To display both active and inactive feeds, turn off the Display Active Only toggle.
Note
If no feeds have been activated, the Feed Explorer screen will display all inactive feeds by default.
.png)
The Feed Explorer screen displays the following information for each feed:
- Name: The name of the feed. The color-coded dot next to the feed’s name indicates its reliability and uniqueness, where a green dot indicates high reliability and uniqueness and a red dot indicates low reliability and uniqueness.
- Description: The description of the feed.
- Unique Indicators: The percentage of Indicators unique to the feed across all CAL-monitored sources. The Unique Indicators percentage uses the following color coding:
- Green: The percentage is greater than or equal to 77%.
- Gray: The percentage is less than 77% and greater than 21%.
- Red: The percentage is less than or equal to 21%.ExampleA Unique Indicators value of 28% means that 28% of the Indicators in the feed are not in other CAL-monitored feeds.
- Daily Indicators: The number of Indicators, in thousands, that the feed ingests every 24 hours.
- Report Card: Click the
 icon to display the feed’s report card.
 - Active: If the feed is active, this column will display a checkmark
 icon.
icon.
Activating Feeds
Follow these steps to active a feed in ThreatConnect:
- From the Settingsmenu on the top navigation bar, select TC Exchange Settings.
- Select the Feeds tab and then locate the desired feed.HintYou can review each feed’s report card to assess which feeds provide the most relevant data for your requirements.
- Turn on the toggle in the Active column.
Feed Report Cards
While viewing the Feed Explorer screen, you can click the icon in the Report Card column to display a feed's report card (Figure 2).
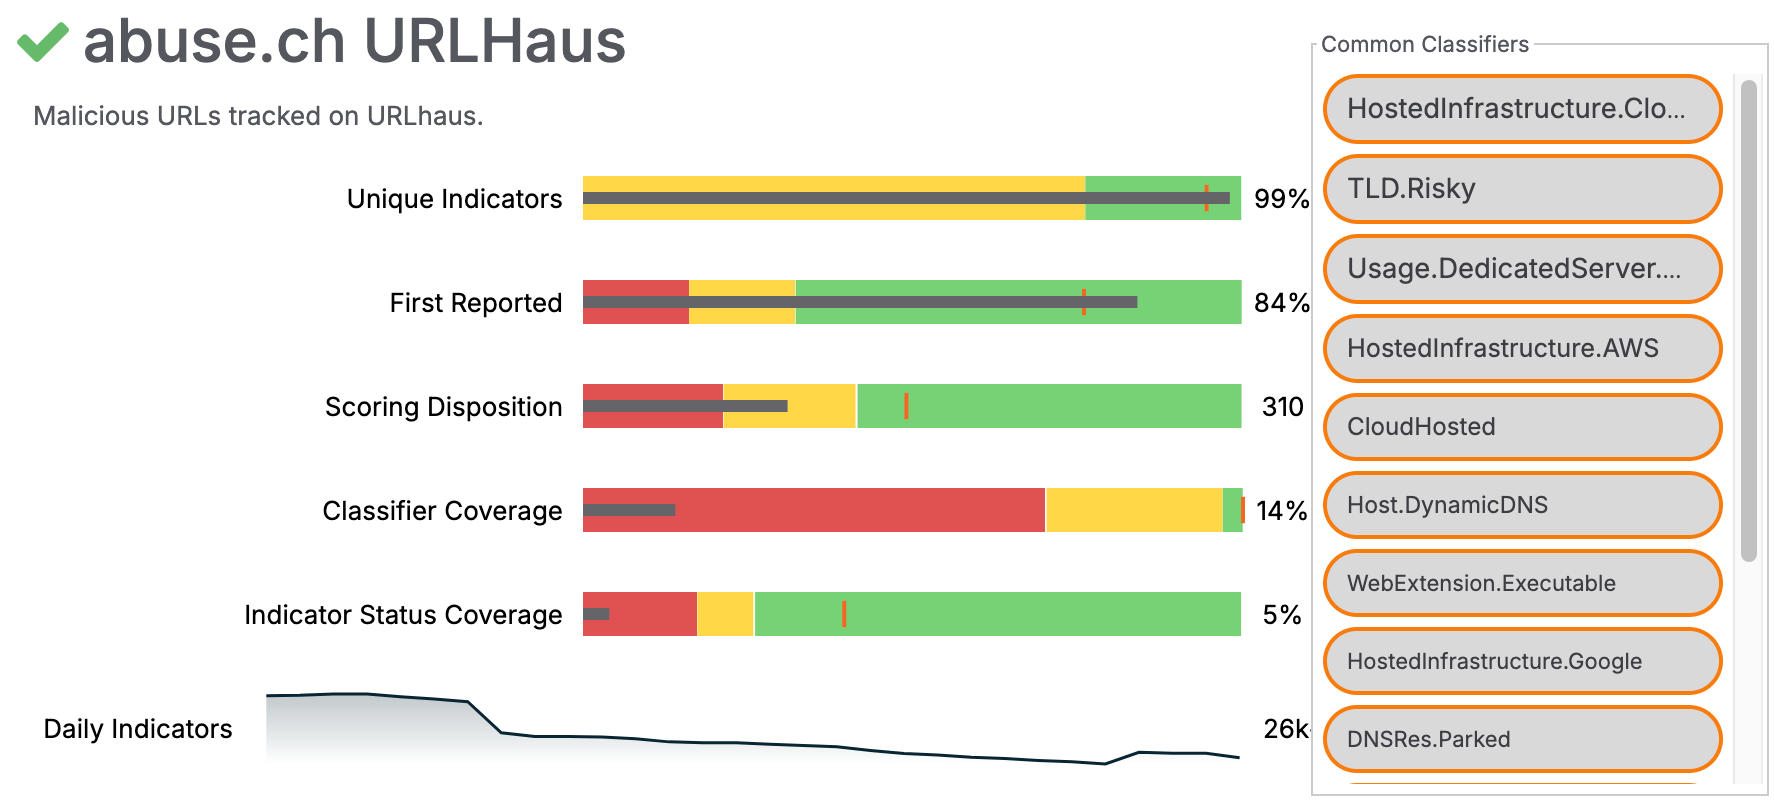
A feed’s report card displays the following information:
- Common Classifiers: A list of CAL Classifiers that apply to the feed.
- Unique Indicators: This metric indicates the percentage of Indicators unique to the feed across all CAL-monitored sources. This metric helps determine which feeds have unique data and reduces the chance of enabling feeds with duplicate data.
- First Reported: This metric is a measure of how often the feed is the first one to report a particular Indicator when that Indicator is observed in other feeds as well. This is important when determining which feeds are appropriate for your cyber threat intelligence (CTI) collections.
- Scoring Disposition: This metric is a weighted average of the CAL Global Threat Score for Indicators in the feed. Each Indicator’s CAL Global Threat Score measures how important the Indicator is for triage prioritization on a scale of 0 (low) to 1000 (critical).
- Classifier Coverage: This metric indicates the percentage of Indicators in the feed that have at least one CAL Classifier. It is a measure of how well existing analytics can qualitatively interpret the data from the feed.HintUsing CAL Classifiers in triage automation with Playbooks is helpful for specific CTI workflows.
- Indicator Status Coverage: This metric indicates the percentage of Indicators in the feed that have a definitive Indicator Status set by CAL. It is a measure of how conclusively CAL’s analytics can provide quantitative statements of the data from the feed.
- Daily Indicators: This metric is a sparkline depiction of the number of Indicators the feed brought in daily over the last 30 days.
The Unique Indicators, First Reported, Scoring Disposition, Classifier Coverage, and Indicator Status Coverage metrics use the following visual elements to put the feed’s data in context with other feeds:
Important
Each metric’s value displays to the right of its respective bullet graph.
- Horizontal Black Line: The horizontal black line represents the metric value for the feed.ExampleIn Figure 2, the black line for the Unique Indicators metric represents a value of 99%, where the left side of the chart is a value of 0% and the right side of the chart is a value of 100%.
- Vertical Orange Line: The vertical orange line represents the target value of the metric across all feeds. The target value is calculated by CAL for each specific metric.ExampleIn Figure 2, the Unique Indicators value of 99% for abuse.ch URL Haus is more than the target value of this metric across all feeds. This indicates that, on average, abuse.ch URL Haus provides a larger number of unique Indicators than other feeds do.
- Colored Bands: The red, yellow, and green bands represent algorithmically-derived segments of each quality compared across all open-source intelligence (OSINT) feeds. Red signifies a bad performance range, yellow a medium range, and green a good range.ExampleIn Figure 2, the Unique Indicators value of 99% falls in the good range, while the Classifier Coverage value of 14% falls in the bad range.
ThreatConnect® is a registered trademark, and TC Exchange™ and CAL™ are trademarks, of ThreatConnect, Inc.
20104-01 v.04.B
Was this article helpful?