Overview
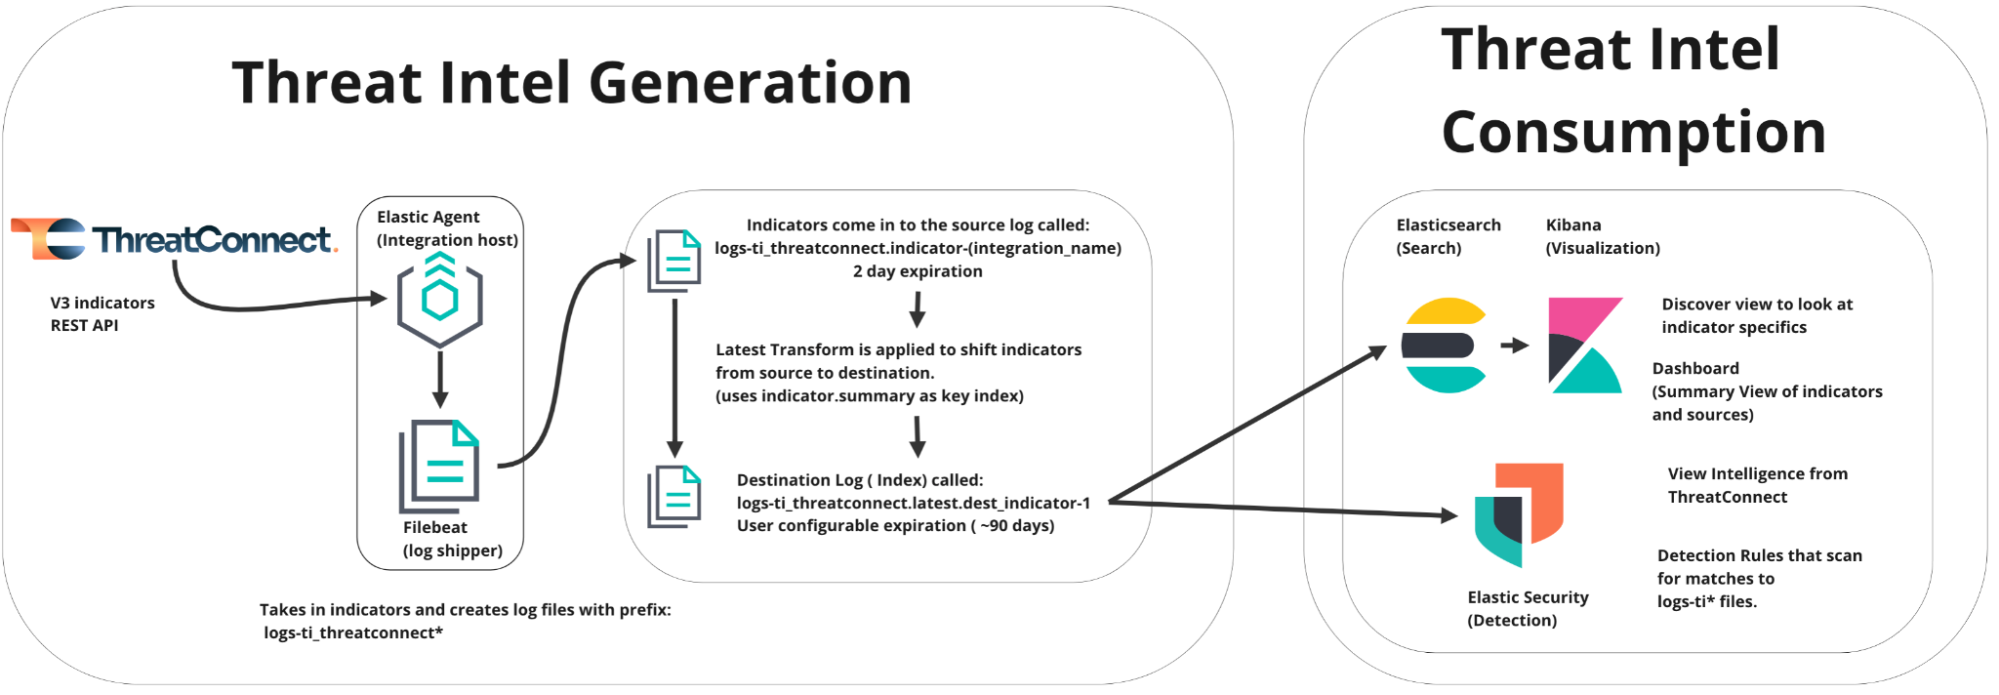
The ThreatConnect® integration with Elastic® Security brings ThreatConnect Indicators and their Attributes and associations into Elastic Security. To accomplish this, the integration uses the Filebeat® module to pull data from ThreatConnect via the ThreatConnect v3 API and store the data in Elastic Security as log files. The ThreatConnect log files can then be parsed and visualized using Kibana® Discover, a built-in Kibana dashboard, and the Indicators page in Elastic Security. You may also define detection rules that can activate on the threat intelligence data ingested by Elastic Security.
Dependencies
ThreatConnect Dependencies
- Active ThreatConnect Application Programming Interface (API) user account
- ThreatConnect instance with version 7.3.1 or newer installed
Elastic Security Dependencies
- Elastic Stack version 8.13.0 or newer
- Elastic Agent version 8.13.0 or newer
Install the Integration
Follow these steps to install the Elastic Security ThreatConnect integration in Kibana:
- In Kibana, open the main menu and navigate to Management > Integrations. Alternatively, click Add integrations at the bottom of the main menu or on the Home page.
- On the Browse integrations tab, search for “threatconnect” (without quotation marks). Then click the ThreatConnect card in the search results (Figure 1).
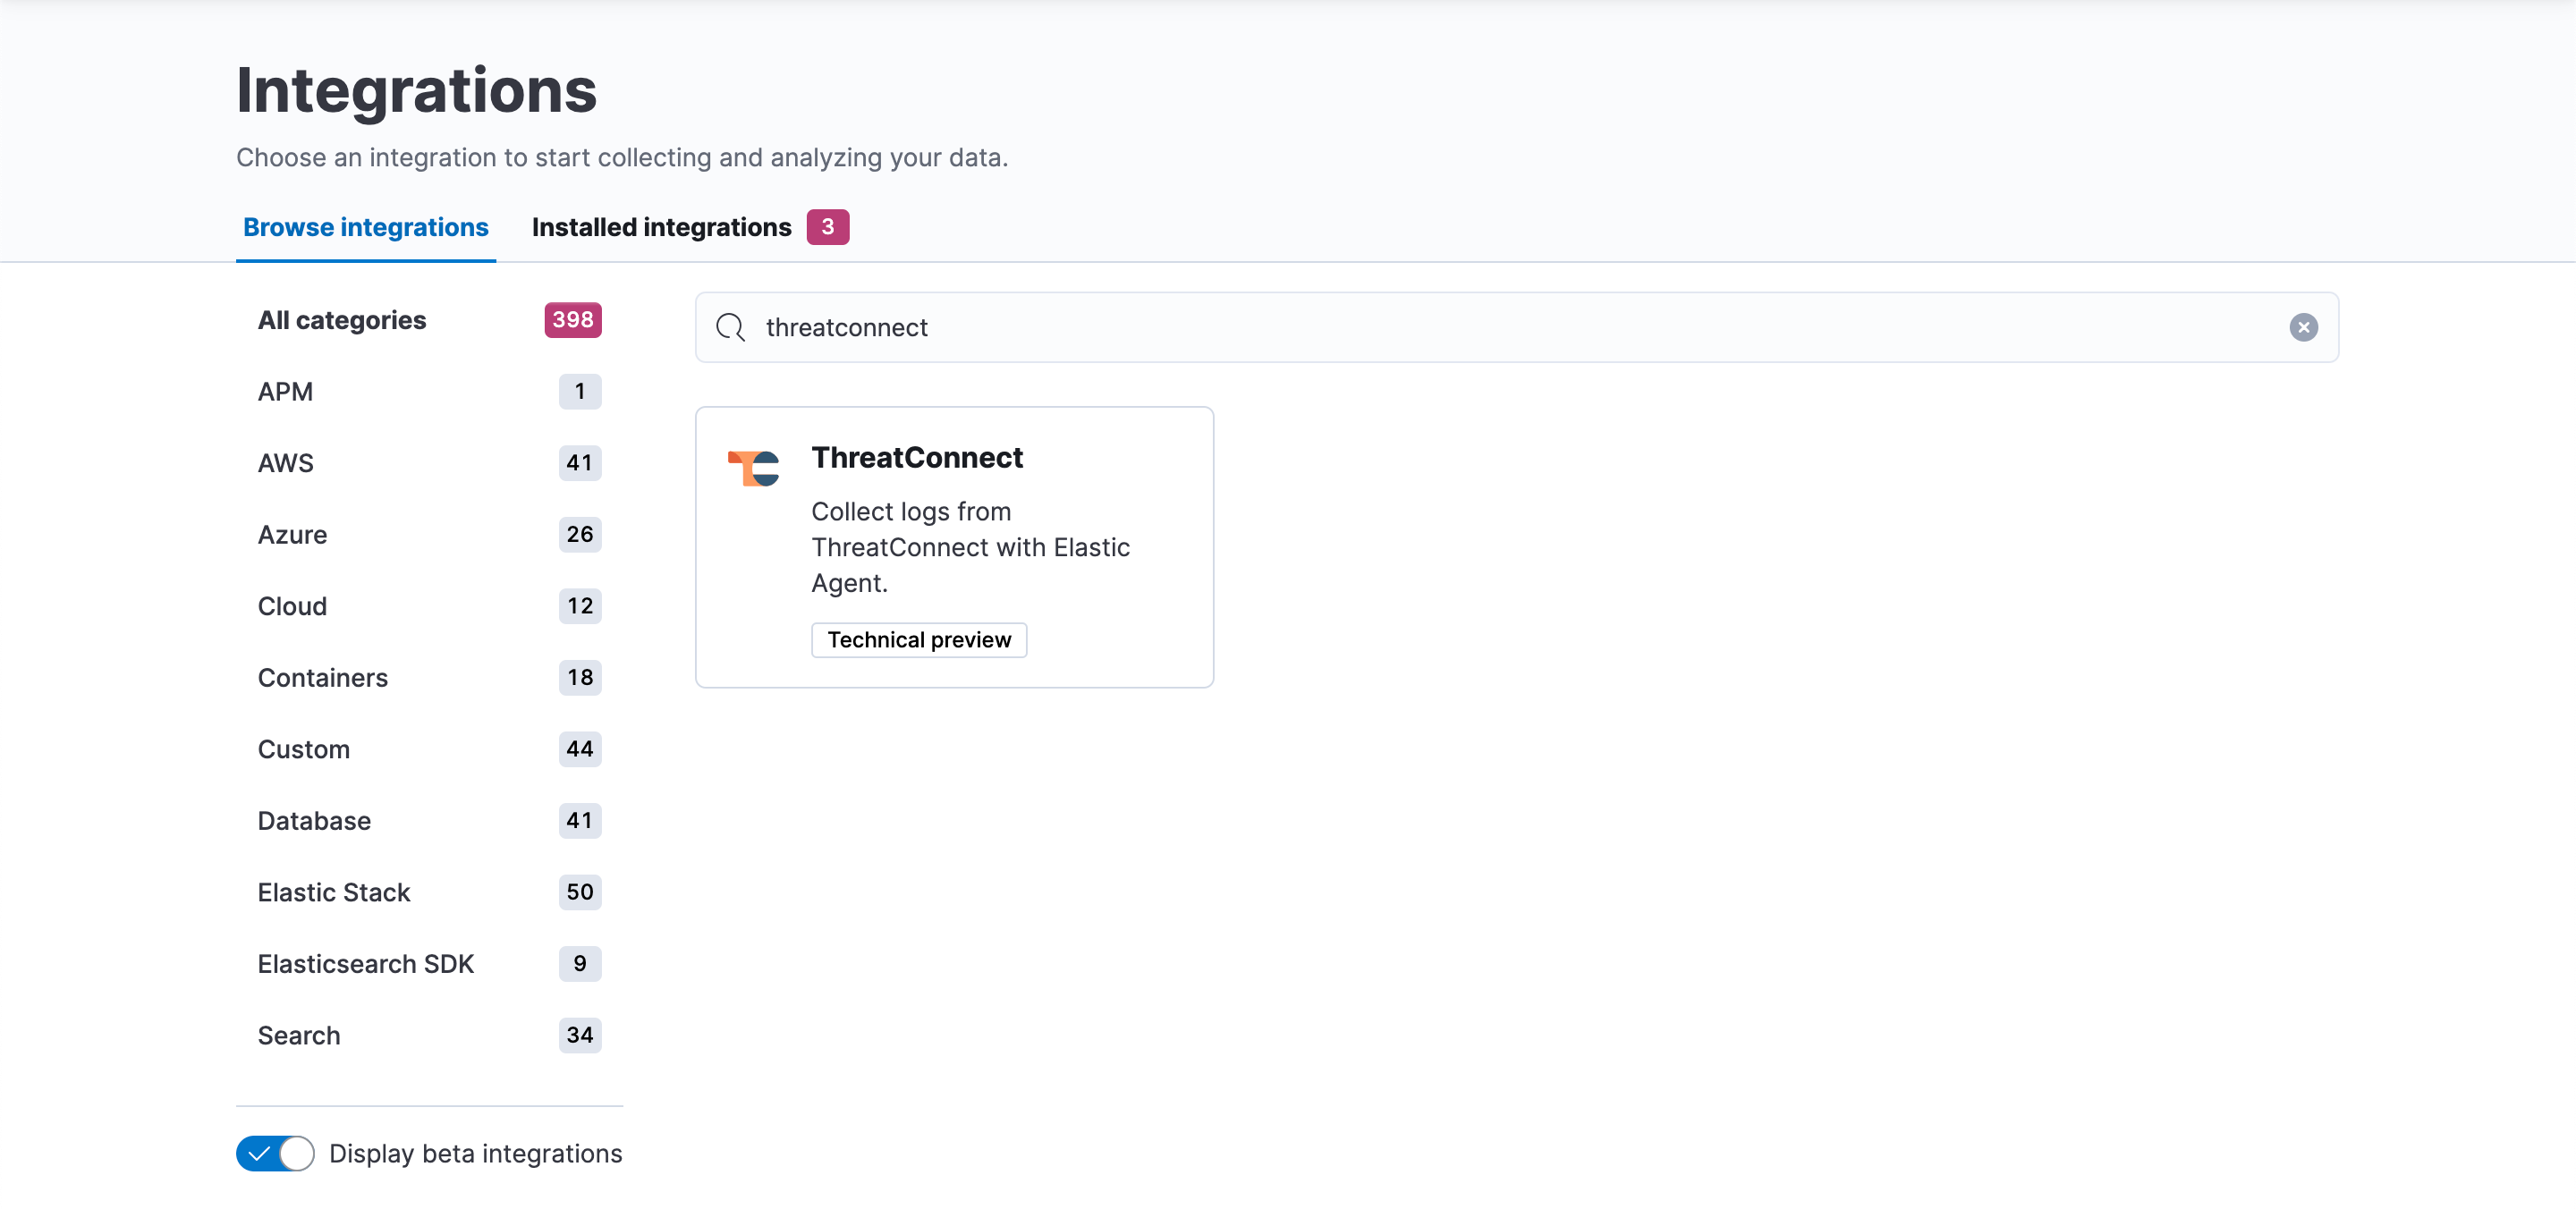 NoteIf the ThreatConnect integration does not show up in Kibana, turn on the Display beta integrations toggle under the All Categories section on the left side of the Integrations page, as the integration may still be in technical preview.
 - On the ThreatConnect integration page, click Add ThreatConnect to install the ThreatConnect integration (Figure 2).
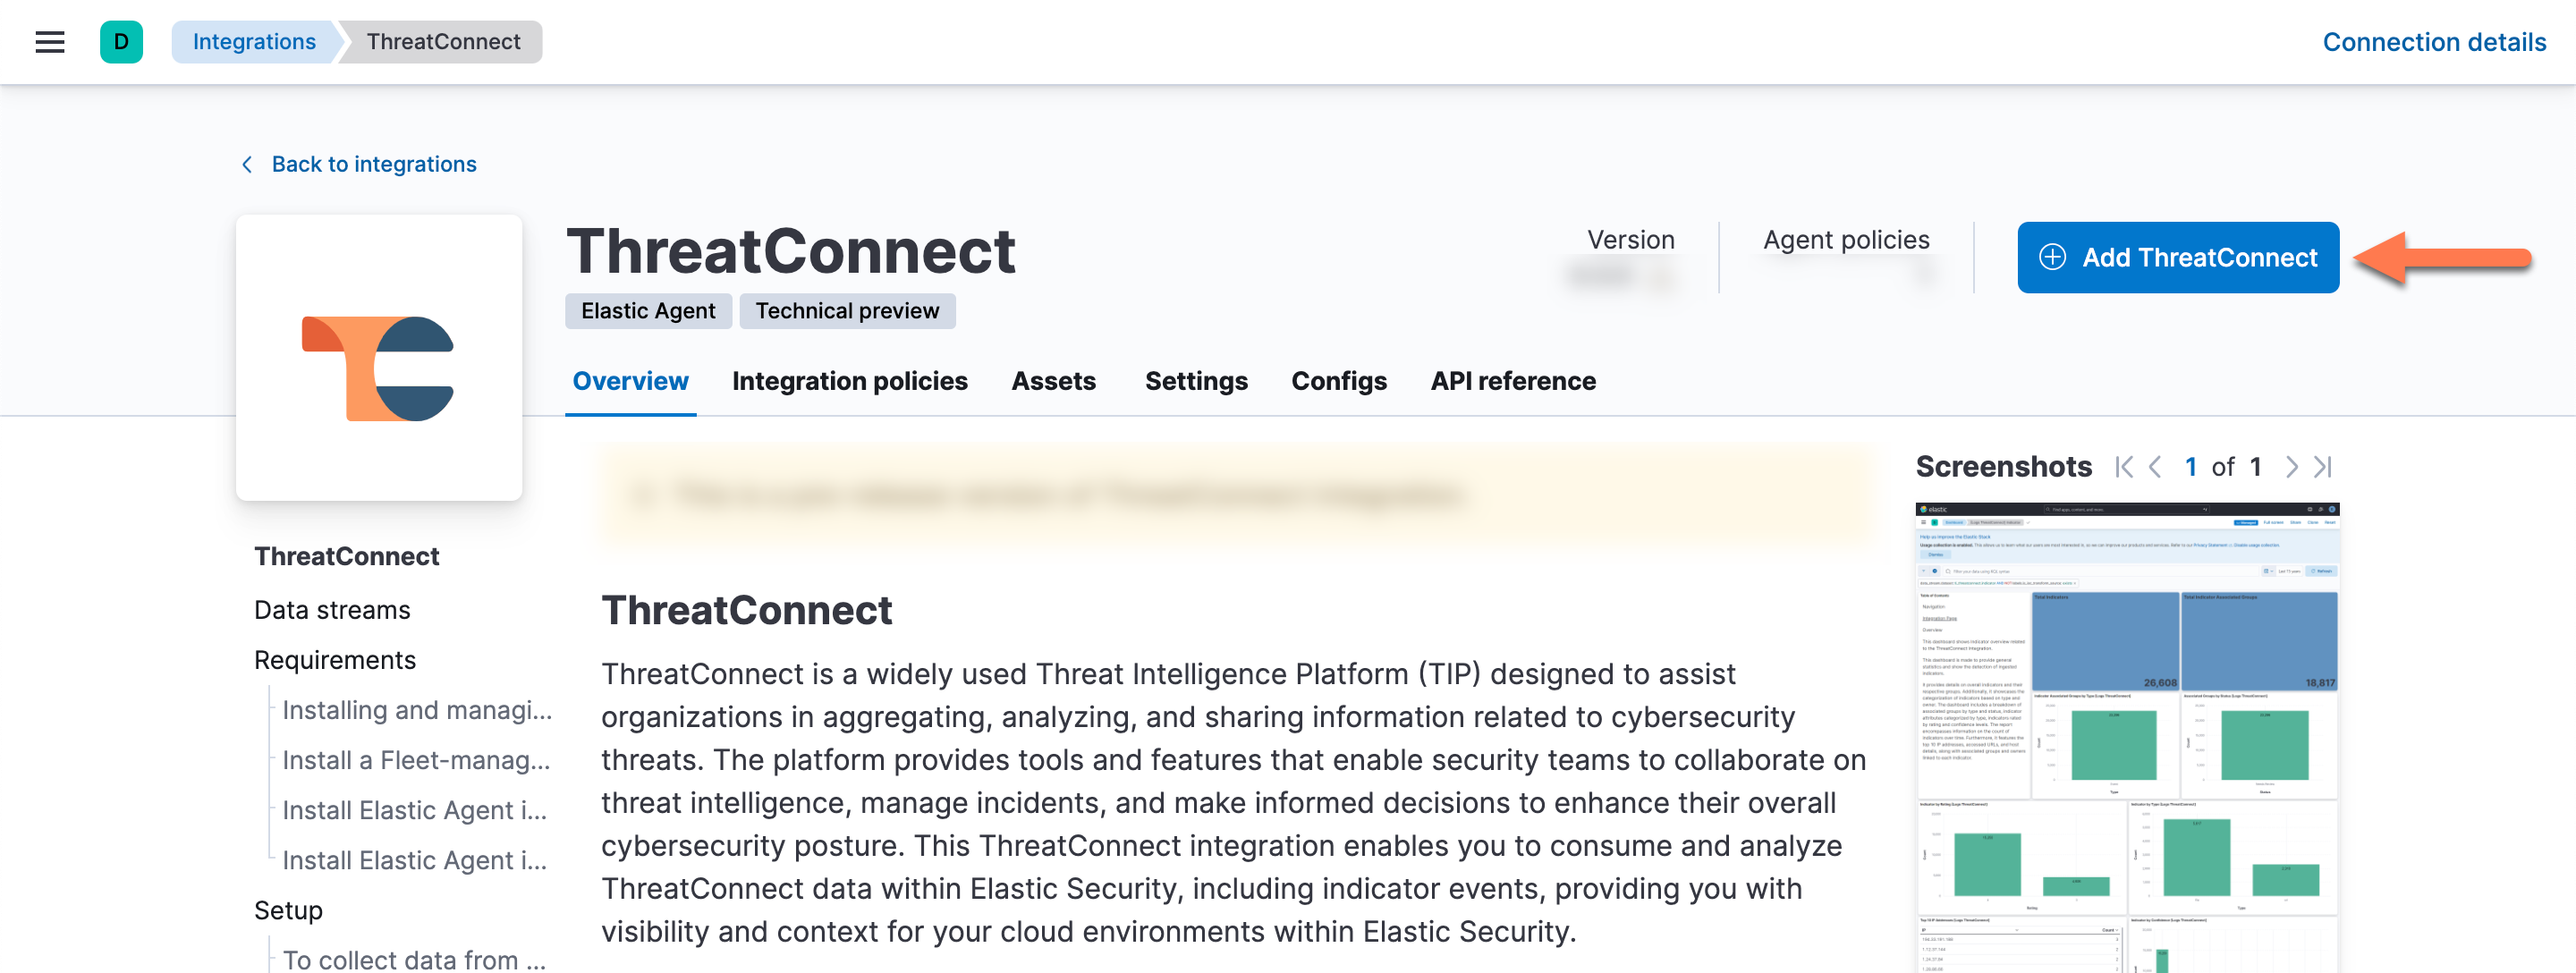
After the ThreatConnect integration is installed, you will be directed to the Add ThreatConnect integration page. Here, you can configure the ThreatConnect integration.
Configure the Integration
The Elastic Security ThreatConnect integration requires configuration in both the ThreatConnect and Elastic instances that will use the integration.
ThreatConnect Configuration
A ThreatConnect API user account is required to use the Elastic Security ThreatConnect integration. If you do not have a ThreatConnect API user account, follow these steps to create one:
- Log into ThreatConnect with an Organization Administrator account.
- From the Settings
 menu on the top navigation bar, select Organization Settings.
 - Select your Organization in the dropdown in the Organization Settings screen’s header.
- On the Membership tab of the Organization Settings screen, click Create API User to create an API user. When creating the API user, configure it as follows:
- System Role: Select Api User.
- Organization Role: Select Standard User.
- Include in Observations and False Positives: Select this checkbox.
- Allow User to Exceed API Link Limit: Select this checkbox.NoteAPI token authentication is not available for the Elastic Security integration.
- On the API User Administration window, record the Access ID and Secret Key for the API user, as they will be used when configuring the ThreatConnect integration in Elastic. Then click SAVE.
Elastic Configuration
Step 1: Configure and Deploy the Integration
After you install the Elastic Security ThreatConnect integration, follow these steps to configure the integration on the Add ThreatConnect integration page in Kibana. In addition to these steps, you may also view a complete list of configuration parameters in the “Configuration Parameters” section.
- Configure the following parameters in the Integration settings subsection of the Configure integration section of the page (Figure 3):
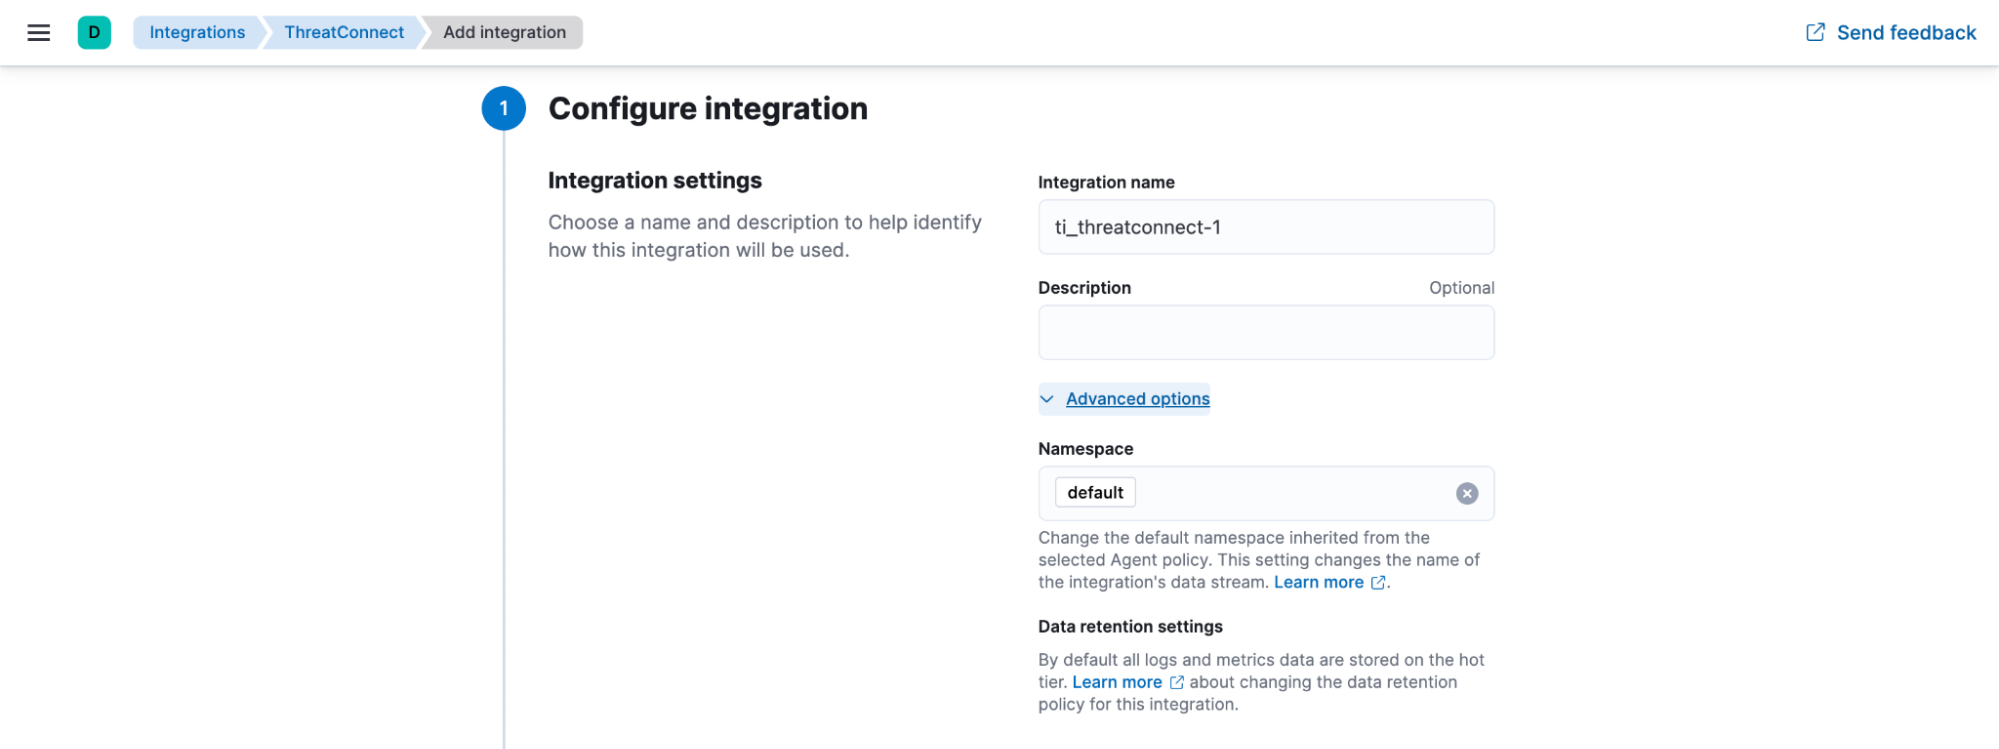
- Integration name : (Required) Enter the integration’s name. This name will be visible on the Elastic Agent running the integration.
- Description: (Optional) Enter a description of the integration.
- Advanced options: Click Advanced options to display the following parameter:
- Namespace: (Required) This parameter controls the name of the integration’s data stream. If desired, change the default namespace inherited from the selected agent policy. Note that pressing Enter in this field will convert the entered text into a tag.
- Configure the following parameters in the Settings subsection of the Configure integration section (Figure 4):
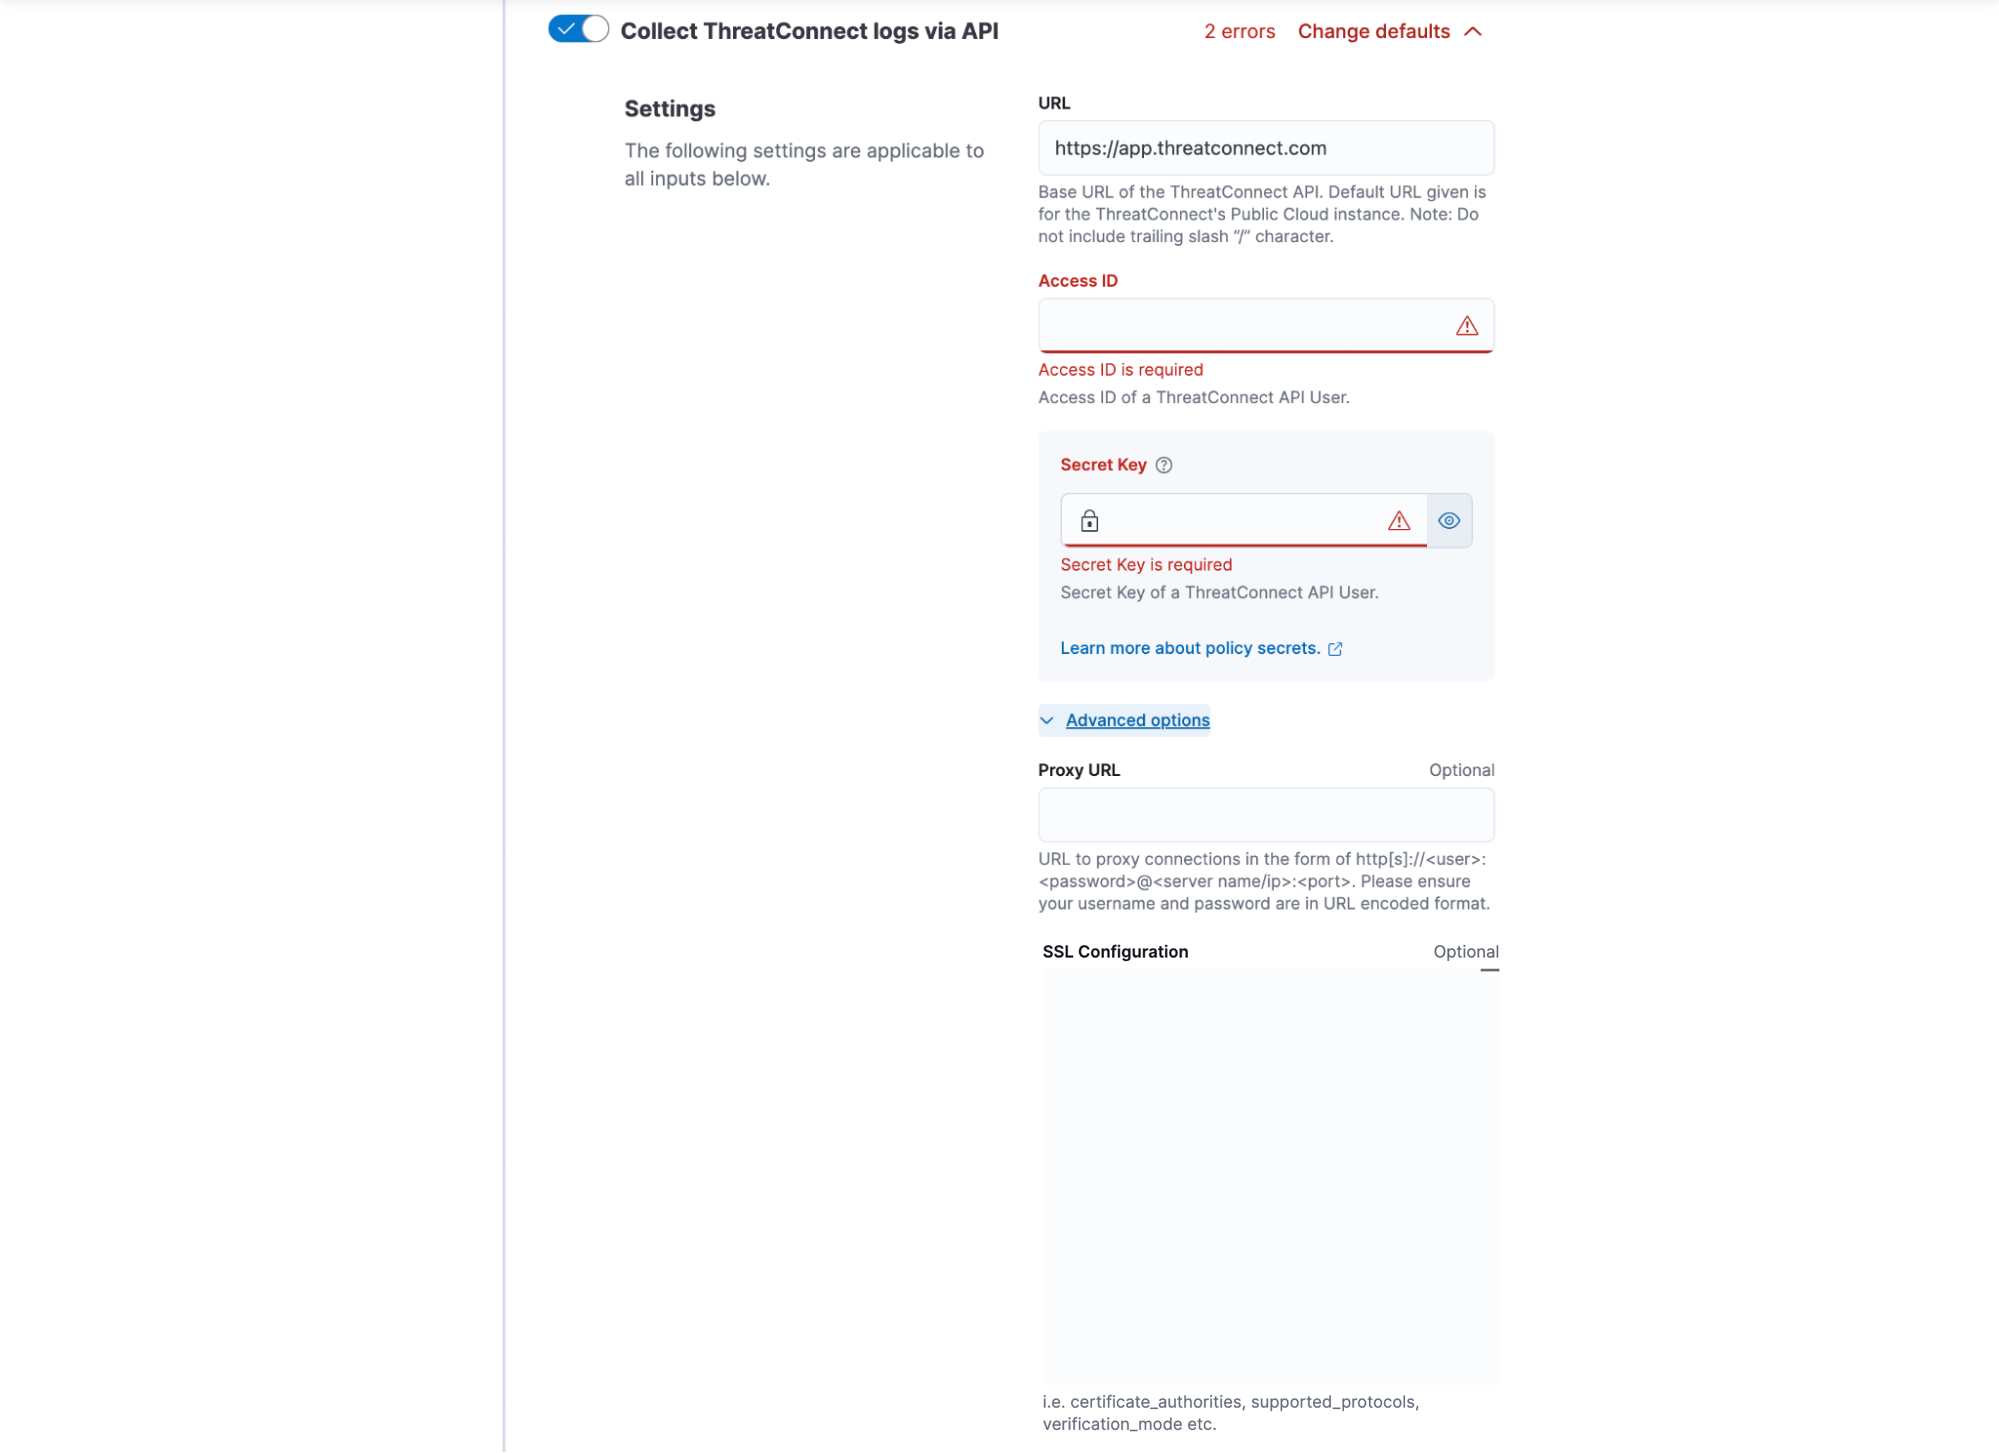
- Collect ThreatConnect logs via API: (Required) Turn on this toggle to access the ThreatConnect API.
- URL: (Required) Enter the base URL of the ThreatConnect instance. Do not include the /api portion of the URL or a trailing slash character (/).
- Access ID: (Required) Enter the Access ID of the API user in ThreatConnect.
- Secret Key: (Required) Enter the Secret Key of the API user in ThreatConnect.
- Advanced options: Click Advanced options to display the following parameters:
- Proxy URL: (Optional) If you are using a proxy, enter the URL to proxy connections in the following format: http[s]://<user>:<password>@<server name/ip>:<port>. Note that the username and password must be in a URL-encoded format.
- SSL Configuration:(Optional) If you are using SSL, enter the SSL certificate and certificate authorities (CAs).
- Configure the following parameters in the last subsection of the Configure integration section (Figure 5):
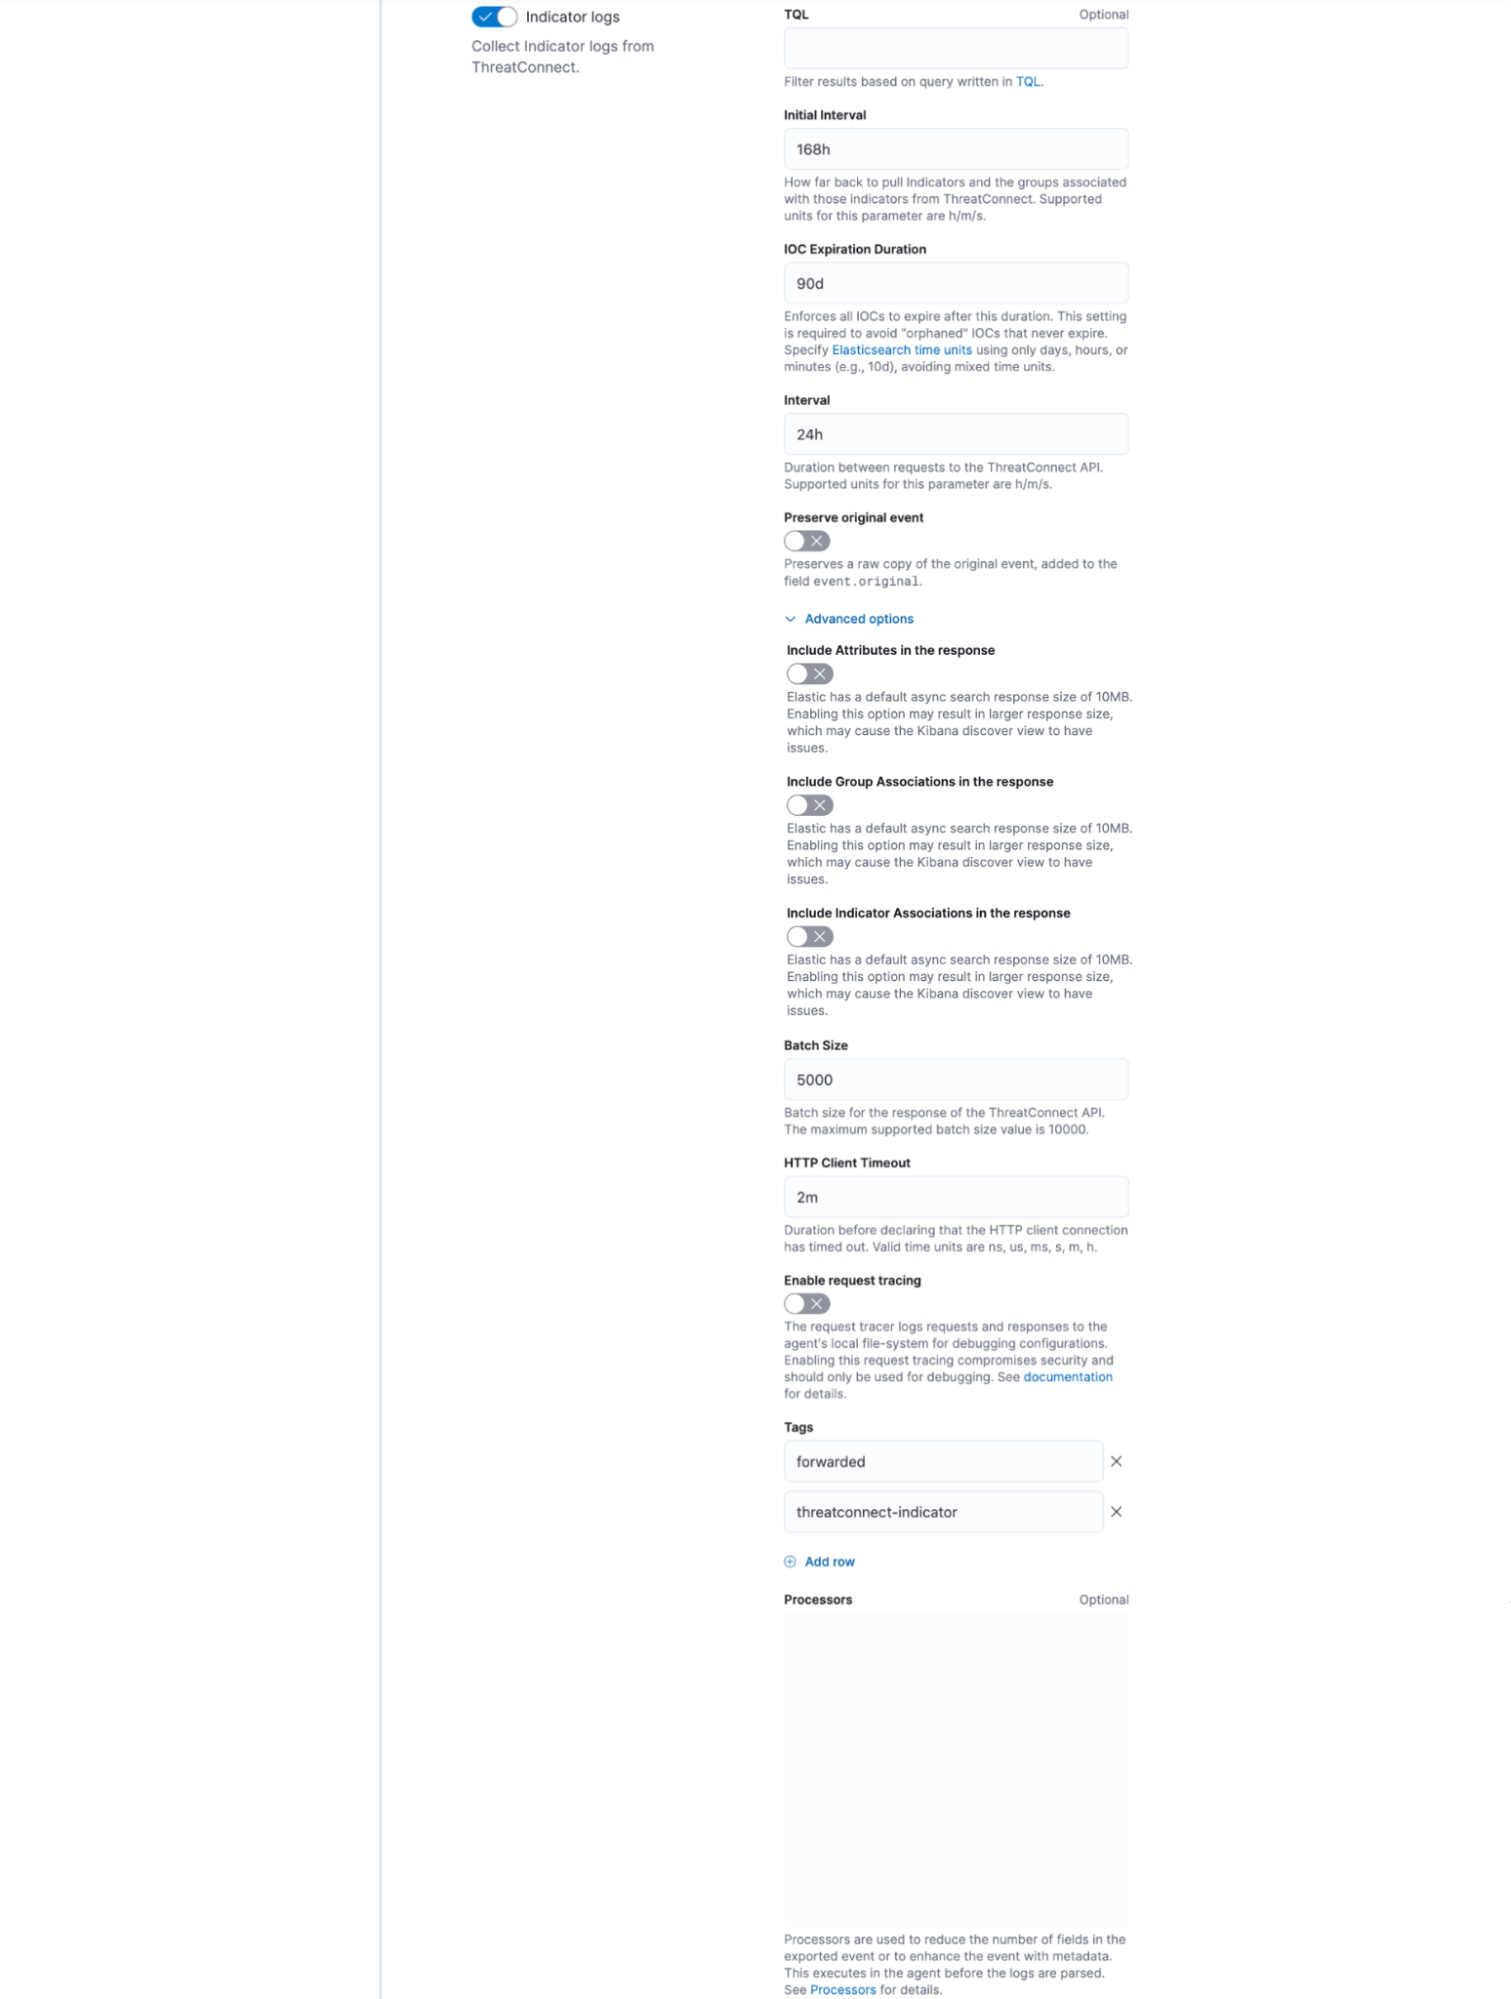
- Indicator logs: (Required) Turn on this toggle to collect Indicators from ThreatConnect.
- TQL: (Optional) Enter a query written in ThreatConnect Query Language (TQL) to filter the Indicators that will be sent to Elastic Security. If this field is left blank, Indicators from all owners that the API user has access to in their Organization will be sent. The following examples demonstrate some of the ways that you can filter Indicators with TQL:NoteIf you are verifying the ThreatConnect data to be sent to Elastic Security by entering your TQL query in the ThreatConnect UI (e.g., on the Search: Indicators screen with Advanced Search turned on), the results shown in the UI will include inactive Indicators by default. To prevent this behavior, append
AND indicatorActive = trueto the query so that it returns only active Indicators that meet the remaining query conditions. For more information on validating data integrity between ThreatConnect and Elastic Security, see the “Frequently Asked Questions (FAQ)” section.rating >= 4 and confidence >= 90: This query searches for Indicators by their Threat and Confidence Ratings. In this example, only Indicators with a Threat Rating greater than or equal to 4 and a Confidence Rating greater than or equal to 90 will be sent to Elastic Security.ownerName in ("CAL Automated Threat Library") and typeName in ("URL", "EmailAddress") and dateAdded > "04-01-2024": This query searches for Indicators by the name of their owner, their Indicator type, and their creation date. In this example, only URL and Email Address Indicators in the CAL Automated Threat Library Source that were created after April 1, 2024, will be sent to Elastic Security.NoteBy default, the integration searches for Indicators whose last modified date falls within the time frame configured for the integration's Initial Interval parameter. As such, it is recommended to account for this behavior when using TQL parameters that accept a date or time value, such as dateAdded, in the query entered for the integration's TQL parameter. For example, if the initial interval goes back one week and you use a TQL query that searches for Indicators created three weeks ago, the query may not return any results.tag in ("phishing", "ransomware"): This query searches for Indicators with one or more of the specified Tags applied to them. In this example, only Indicators with the phishing Tag, the ransomware Tag, or both the phishing and ransomware Tags applied to them will be sent to Elastic Security.
- Initial Interval: (Required) Specify how far back to retrieve Indicators and their Attributes and associations from ThreatConnect. Indicators that were last modified within the specified amount of time will be retrieved. Acceptable time units for this parameter include the following: h (hours), m (minutes), and s (seconds).NoteOn the integration’s first run, it will retrieve data that were last modified during the specified interval up to the current time. Thereafter, the integration will retrieve data that were last modified starting from the end of the specified interval (e.g., the last 168 hours).
- IOC Expiration Duration: (Required) Enter the amount of time after which all ingested Indicators will expire in Elastic Security. This setting is required to avoid “orphaned” Indicators that never expire. Acceptable time units for this parameter include the following: d (days), h (hours), and m (minutes).ImportantDo not mix time units when entering a value for the IOC Expiration Duration parameter.
- Interval: (Required) Enter the interval between each request to the ThreatConnect API to retrieve data. Acceptable time units for this parameter include the following: h (hours), m (minutes), and s (seconds).
- Preserve original event: (Optional) If troubleshooting the integration, turn on this toggle to preserve a raw copy of the original event added to the
event.originalfield. Otherwise, leave this toggle turned off. - Advanced options: Click Advanced options to display the following parameters:
- Include Attributes in the response: (Optional) Turn on this toggle to include an Indicator’s Attributes in the ThreatConnect API response. Note that turning on this toggle may result in a larger response size that can cause issues when viewing the data on the Discover page in Kibana.
- Include Group Associations in the response: (Optional) Turn on this toggle to include an Indicator’s associated Groups in the ThreatConnect API response. Note that turning on this toggle may result in a larger response size that can cause issues when viewing the data on the Discover page in Kibana.
- Include Indicator Associations in the response: (Optional) Turn on this toggle to include an Indicator’s associated Indicators in the ThreatConnect API response. Note that turning on this toggle may result in a larger response size that can cause issues when viewing the data on the Discover page in Kibana.
- Batch Size: (Required) Enter the ThreatConnect API batch size. The maximum supported batch size is 10000.
- HTTP Client Timeout: (Required) Enter the amount of time to wait before declaring that the HTTP client connection has timed out. Acceptable time units for this parameter include the following: ns (nanoseconds), us (microseconds), ms (milliseconds), s (seconds), m (minutes), and h (hours). If working with a large dataset, it is recommended to set this parameter’s value to at least 10m (10 minutes).
- Enable request tracing: (Optional) The request tracer logs requests and responses to the agent’s local file system for debugging configurations. Enabling this request tracing compromises security and should be used only when troubleshooting the integration.
- Tags: (Required) Enter the tags to apply to the incoming data in Elastic Security. By default, the following tags are populated in this parameter and should not be removed:
- forwarded: This tag signifies to Elastic that the Indicators are being forwarded from the ThreatConnect instance’s IP address rather than coming directly from it.
- threatconnect-indicator: This tag indicates that the data are ThreatConnect Indicators.
- Processors: (Optional) Define the processors to reduce the number of fields in the exported event or enhance the event with metadata, if desired. The specified processors will execute in the agent before the logs are parsed.
- In the Where to add this integration? section, select the agent policy that will host the integration (Figure 6). You can create a new agent policy or select an existing one.

- (Optional) To preview the API request that will be sent to ThreatConnect, click Preview API request at the bottom of the Add ThreatConnect integration page. Previewing the API request and the corresponding JavaScript® Object Notation (JSON) can help reveal any latent issues that were not found with the parameter validations.
- Click Save and continue at the bottom of the Add ThreatConnect integration page to save and deploy the integration to the selected agent policy.
Configuration Parameters
Table 1 defines the configuration parameters available when configuring the Elastic Security ThreatConnect integration in Kibana.
| Name | Description | Required? | Default Value |
|---|---|---|---|
| Integration name | The integration’s name. This name will be visible on the Elastic Agent running the integration. | Required | ti_threatconnect |
| Description | A description of the integration. | Optional | - |
| Namespace | The name of the integration’s data stream. Note that pressing Enter in this parameter’s field will convert the entered text into a tag. | Required | default |
| Collect ThreatConnect logs via API | Specifies whether the integration can access the ThreatConnect API. | Required | On |
| URL | The base URL of the ThreatConnect instance. Do not include the /api portion of the URL or a trailing slash character (/). | Required | https://companyabc.threatconnect.com |
| Access ID | The Access ID of the API user in ThreatConnect. | Required | - |
| Secret Key | The Secret Key of the API user in ThreatConnect. | Required | - |
| Proxy URL | The URL to proxy connections if you are using a proxy. The URL must be entered in the following format, where the username and password are in a URL-encoded format: http[s]://<user>:<password>@<server name/ip>:<port> | Optional | - |
| SSL Configuration | The SSL certificate and certificate authorities (CAs) to use if you are using SSL. | Optional | - |
| Indicator logs | Specifies whether the integration will collect Indicators from ThreatConnect. | Required | On |
| TQL | A query written in ThreatConnect Query Language (TQL) that filters the Indicators that will be sent to Elastic Security. If this field is left blank, Indicators from all owners that the API user has access to in their Organization will be sent. | Optional | - |
| Initial Interval | Specifies how far back to retrieve Indicators and their Attributes and associations from ThreatConnect. Indicators that were last modified within the specified amount of time will be retrieved. Acceptable time units for this parameter include the following:
Note On the integration’s first run, it will retrieve data that were last modified during the specified interval up to the current time. Thereafter, the integration will retrieve data that were last modified starting from the end of the specified interval (e.g., the last 168 hours). | Required | 168h |
| IOC Expiration Duration | The amount of time after which all ingested Indicators will expire in Elastic Security. This setting is required to avoid “orphaned” Indicators that never expire. Acceptable time units for this parameter include the following:
Important Do not mix time units when entering a value for the IOC Expiration Duration parameter. | Required | 90d |
| Interval | The interval between each request to the ThreatConnect API to retrieve data. Acceptable time units for this parameter include the following:
| Required | 24h |
| Preserve original event | Specifies whether to preserve a raw copy of the original event added to the event.original field. Turn on this toggle only when troubleshooting the integration. | Optional | Off |
| Include Attributes in the response | Specifies whether to include an Indicator’s Attributes in the ThreatConnect API response. Note that turning on this toggle may result in a larger response size that can cause issues when viewing the data on the Discover page in Kibana. | Optional | Off |
| Include Group Associations in the response | Specifies whether to include an Indicator’s associated Groups in the ThreatConnect API response. Note that turning on this toggle may result in a larger response size that can cause issues when viewing the data on the Discover page in Kibana. | Optional | Off |
| Include Indicator Associations in the response | Specifies whether to include an Indicator’s associated Indicators in the ThreatConnect API response. Note that turning on this toggle may result in a larger response size that can cause issues when viewing the data on the Discover page in Kibana. | Optional | Off |
| Batch Size | The ThreatConnect API batch size. The maximum supported batch size is 10000. | Required | 5000 |
| HTTP Client Timeout | The amount of time to wait before declaring that the HTTP client connection has timed out. Acceptable time units for this parameter include the following:
Note If working with a large dataset, it is recommended to set the HTTP Client Timeout parameter’s value to at least 10m (10 minutes). | Required | 2m |
| Enable request tracing | The request tracer logs requests and responses to the agent’s local file system for debugging configurations. Enabling this request tracing compromises security and should be used only when troubleshooting the integration. | Optional | Off |
| Tags | The tags to apply to the incoming data in Elastic Security. By default, the following tags are populated in this parameter and should not be removed:
| Required |
|
| Processors | The processors to reduce the number of fields in the exported event or enhance the event with metadata. The specified processors will execute in the agent before the logs are parsed. | Optional | - |
Configuration Performance Recommendations
To reduce the risk of performance issues occurring while using the Elastic Security ThreatConnect integration, follow these guidelines when configuring the integration:
- TQL: If using the TQL parameter to filter Indicators that will be sent to Elastic Security, it is recommended to have your System Administrator increase the value of the tqlQueryTimeout system setting for your ThreatConnect instance. Alternatively, override the systemwide TQL query timeout for the ThreatConnect API user account that will be used in the integration. To do so, edit the API user account, select the Custom TQL Timeout checkbox, and enter the maximum amount of time, in milliseconds, that TQL queries made by the API user will be allowed to run before timing out.
- Include Attributes in the response: Some Indicators may have over 1000 Attributes, which can result in a large amount of extra data being sent to Elastic Security when the Include Attributes in the response parameter is turned on. If you experience performance issues, it is recommended to turn off the Include Attributes in the response parameter to prevent Attributes from being sent to Elastic Security.
- Include Group Associations in the response: Some Indicators may have over 10,000 associated Groups, which can result in a large amount of extra data being sent to Elastic Security when the Include Group Associations in the response parameter is turned on. If you experience performance issues, it is recommended to turn off the Include Group Associations in the response parameter to prevent associated Groups from being sent to Elastic Security.
- Include Indicator Associations in the response: Some Indicators may have over 10,000 associated Indicators, which can result in a large amount of extra data being sent to Elastic Security when the Include Indicator Associations in the response parameter is turned on. If you experience performance issues, it is recommended to turn off the Include Indicator Associations in the response parameter to prevent associated Indicators from being sent to Elastic Security.
- Batch Size: If working with small or busy Elastic Agents, or small TQL timeouts for your ThreatConnect instance or ThreatConnect API user account, it is recommended to set the Batch parameter’s value to 5000 and then reduce it by half each time the integration runs until you reach the desired performance.
- HTTP Client Timeout: If working with small or busy Elastic Agents, a large number of Indicators on the ThreatConnect instance, or small TQL timeouts for your ThreatConnect instance or API user account, it is recommended to double the HTTP Client Timeout parameter’s initial value of 2m and then double it again each time the integration runs until you reach the desired performance.
Step 2: Validate the Data Flow
After you configure and deploy the ThreatConnect integration in Kibana, the Integration policies tab of the ThreatConnect integration page will open (Figure 7). This tab lists all instances of the integration across all agent policies in Kibana. Instances of the integration without Elastic Agents will not run, and the Agents column will display the Add Agent button for those integration instances.
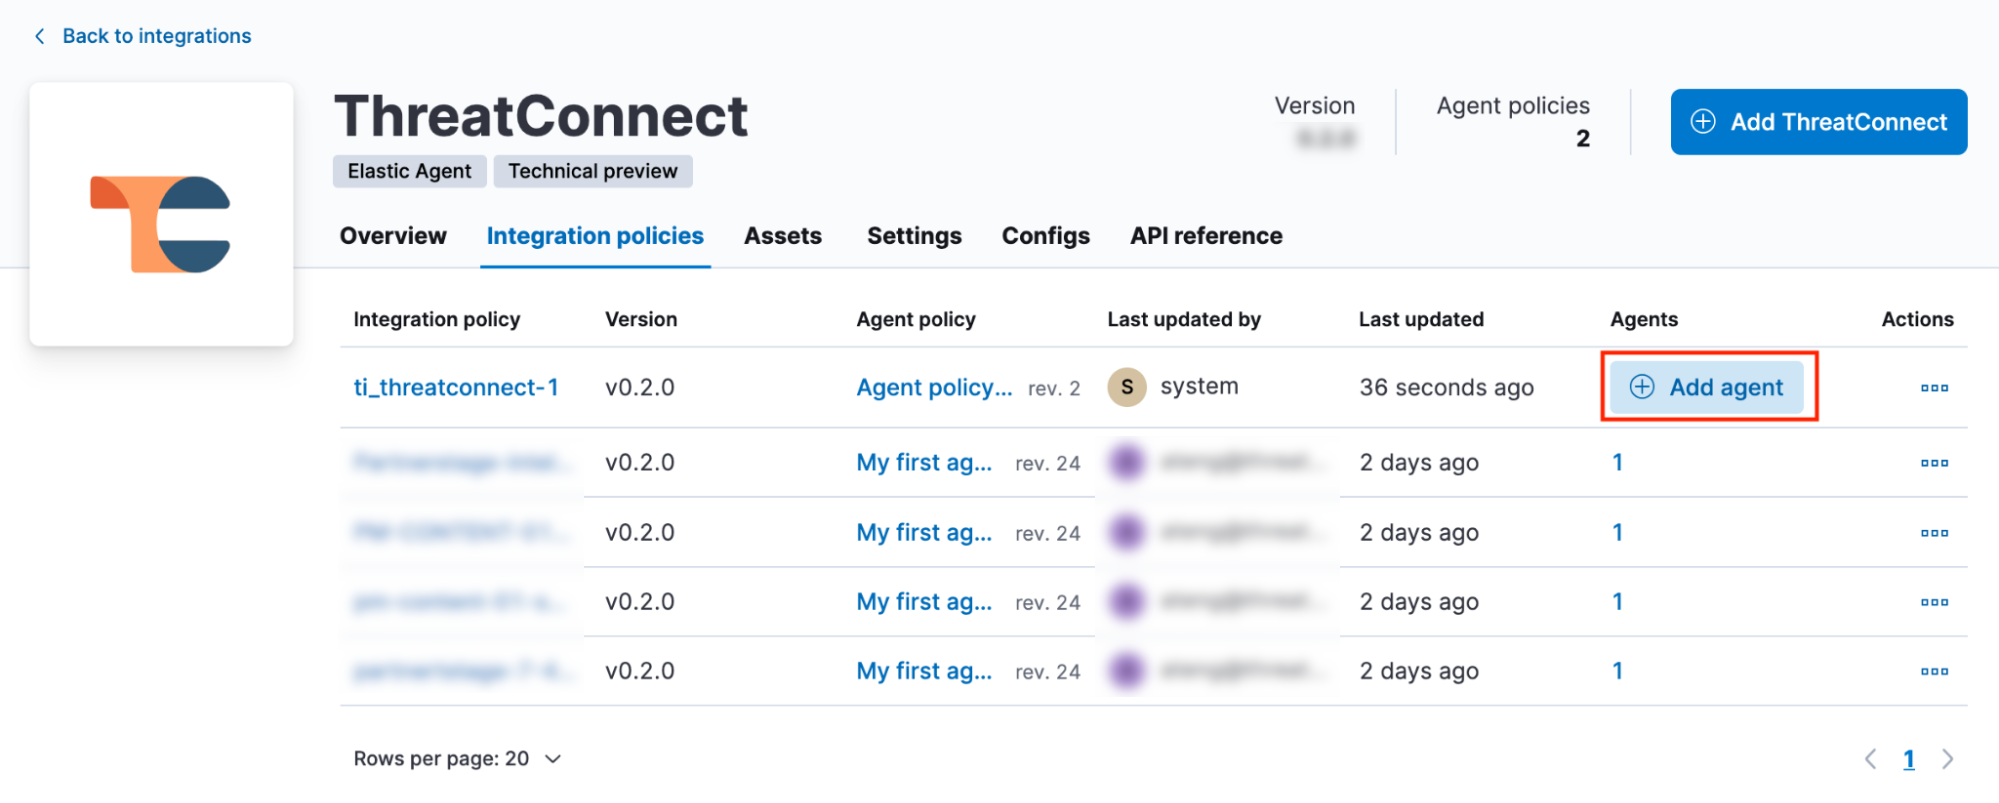
From the Integrations policies tab, you can also manage integrations by clicking the ⋯ menu in the Actions column and selecting one of the following options: Add Agent, Edit integration, and Delete integration.
Once the ThreatConnect integration is deployed, it will run automatically. There are four areas in Elastic where you can verify whether Elastic Security is ingesting ThreatConnect data:
Fleet
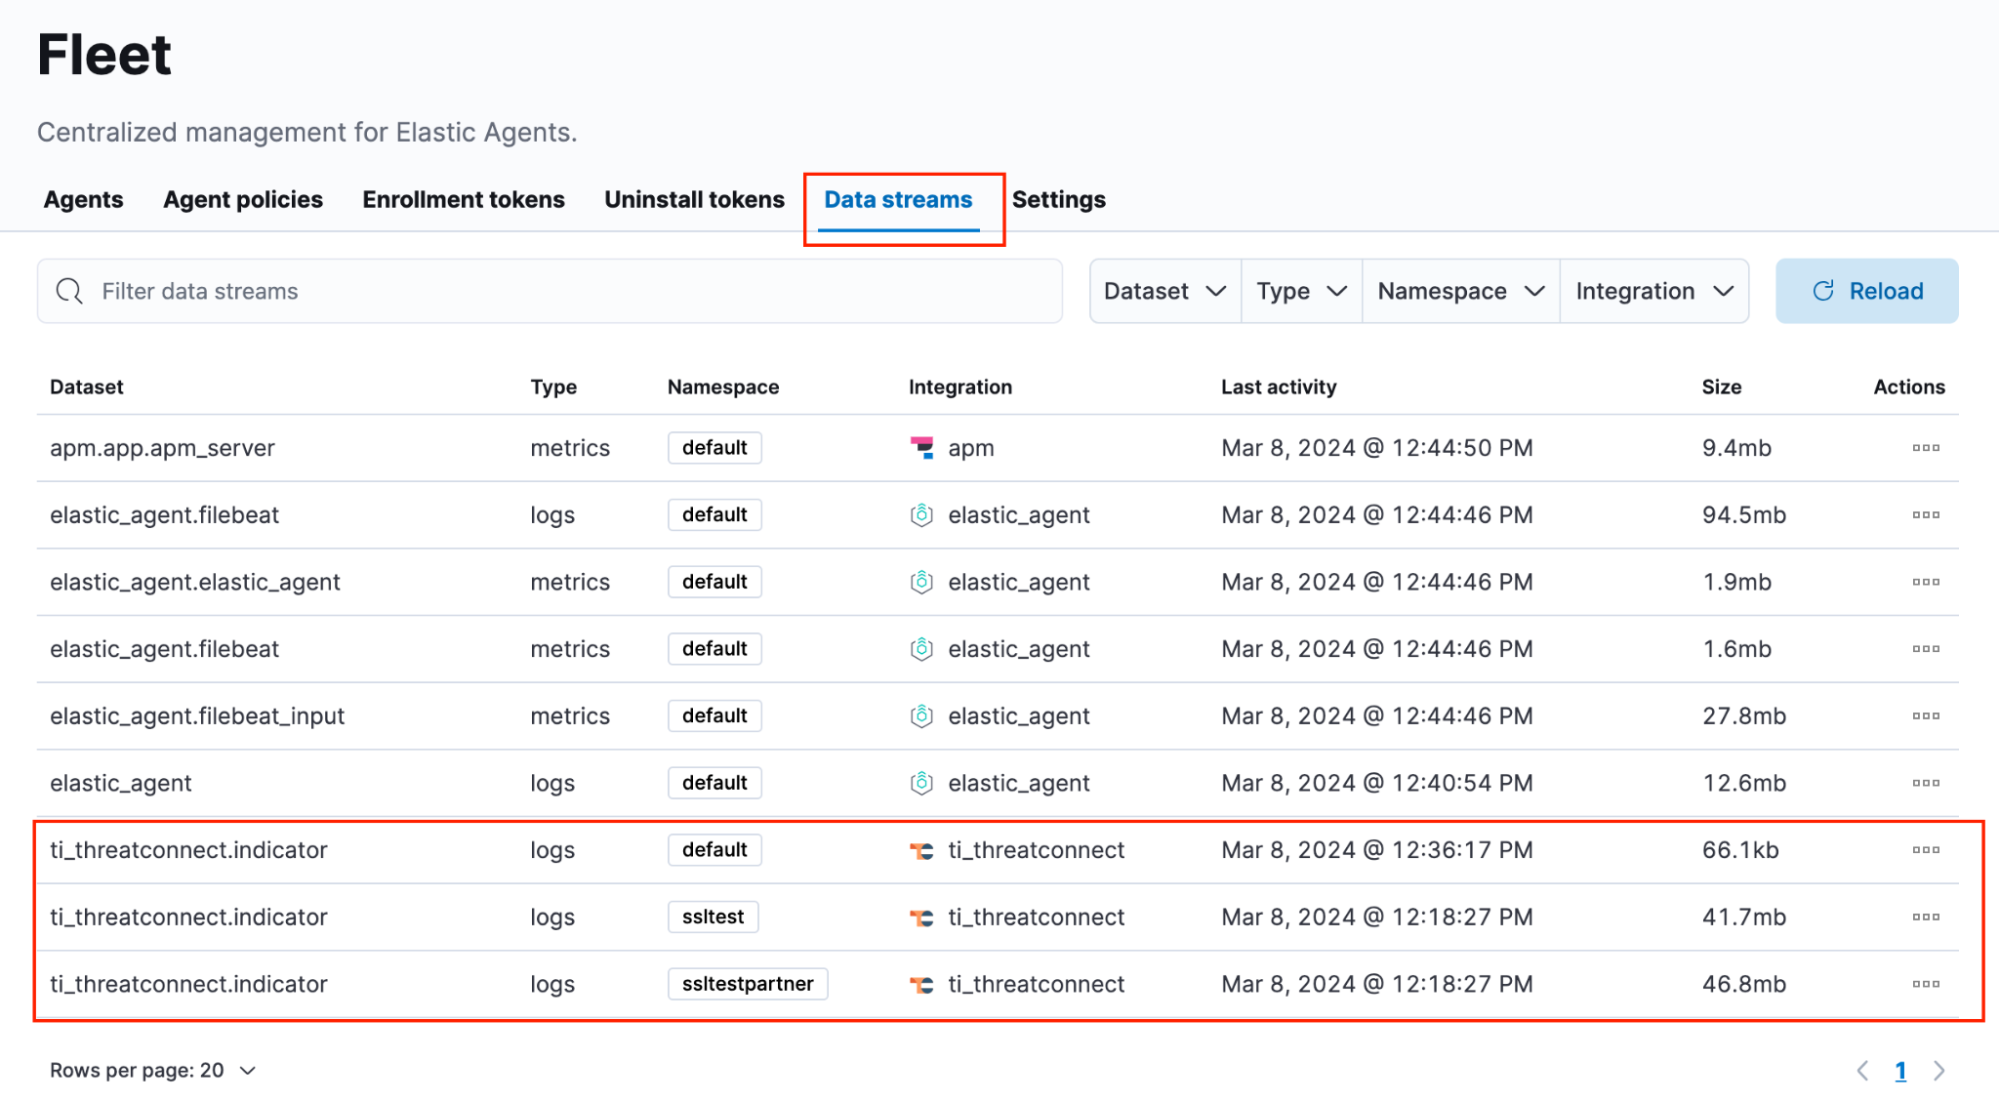
- In Kibana, open the main menu and navigate to Management > Fleet.
- On the Fleet page, select the Data streams tab to see the activity of the data streams on the Elastic Stack (Figure 8). The ThreatConnect integration dataset will be named ti_threatconnect.indicator, and the data from ThreatConnect will come in as logs. A good sign that Elastic Security is ingesting data is if the log size is in megabytes.
- You can also observe data on the managed [Logs ThreatConnect] Indicator dashboard in Kibana that is installed with the integration (Figure 9). To view this dashboard, click the ⋯ menu in the Actions column on the Data streams tab for ti_threatconnect.indicator and select View dashboard.
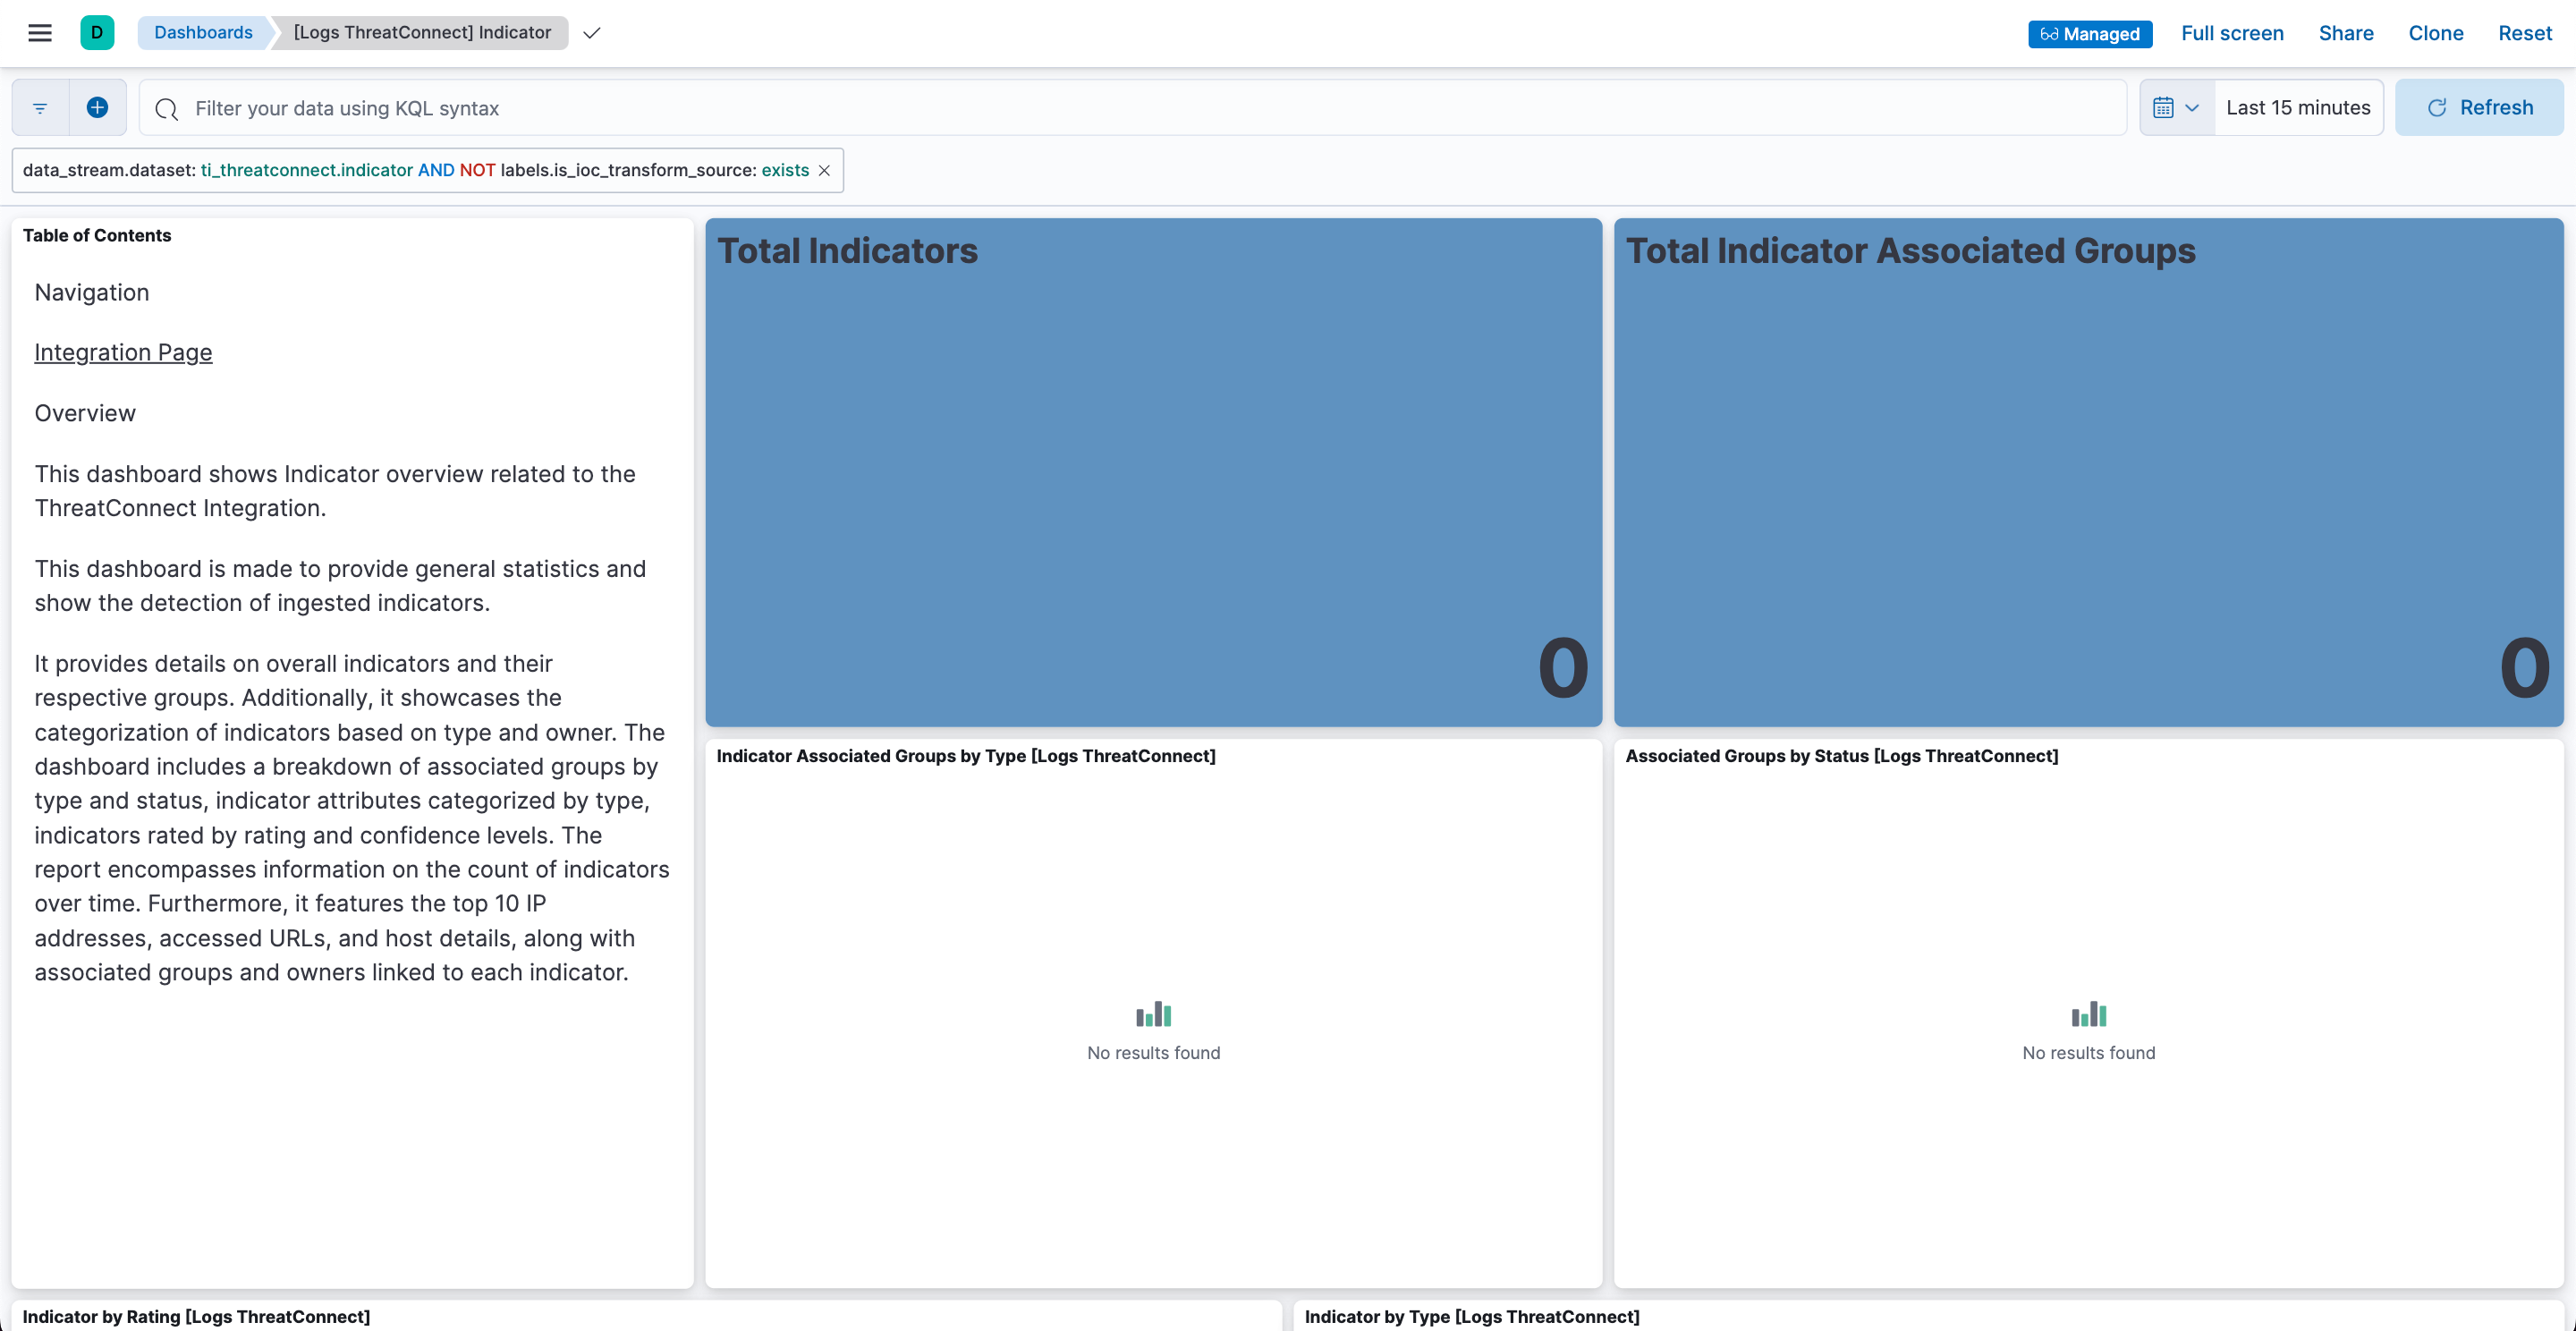
- By default, the [Logs ThreatConnect] Indicator dashboard’s time range is set to Last 15 minutes. If the count of Indicators and associated Groups on the dashboard is 0, update the time range to match the value entered for the ThreatConnect integration’s Initial Interval parameter. In most cases, updating the time range will result in the dashboard displaying data (Figure 10).NoteTo quickly validate whether Elastic Security has ingested data, set the time range to Last 90 days.
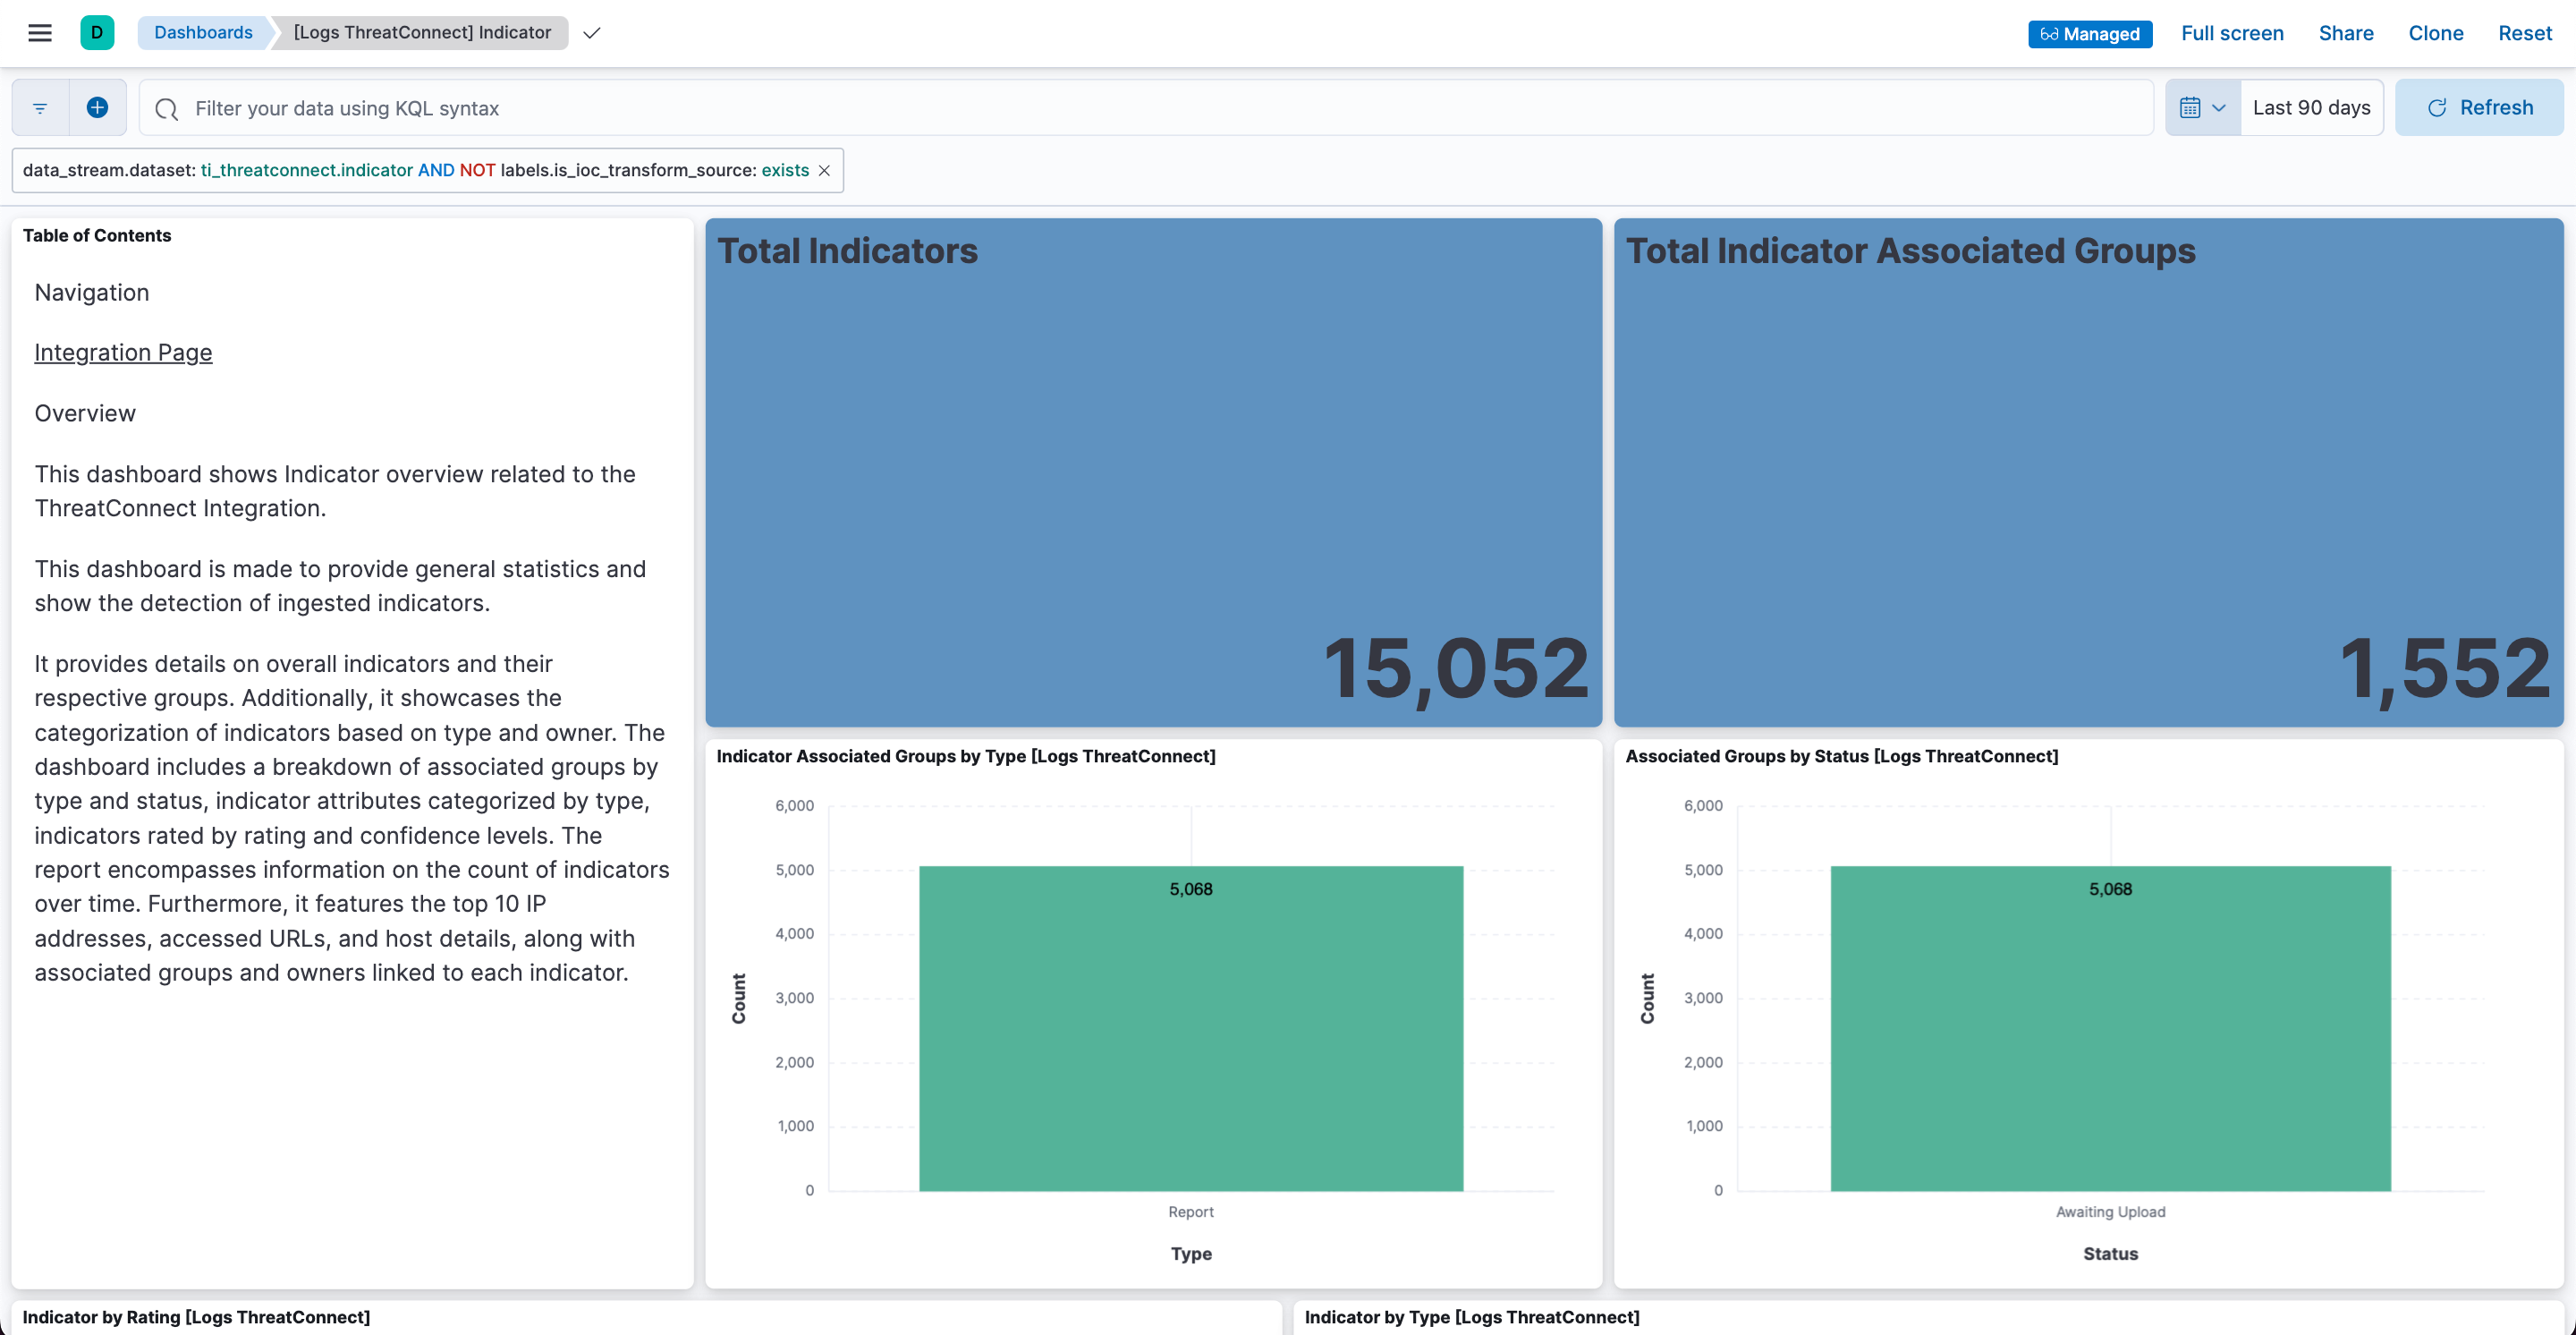
- (Optional) Because the [Logs ThreatConnect] Indicator dashboard is a managed dashboard, its visualizations are set statically and cannot be changed. To clone the dashboard and create a copy of it that you can edit, click Clone at the top right of the dashboard.
Discover
- In Kibana, open the main menu and navigate to Analytics > Discover.
- Select the logs-*data view from the data view menu at the top left of the Discover page (Figure 11). Note that this data view will be included in the list of available data views by default.
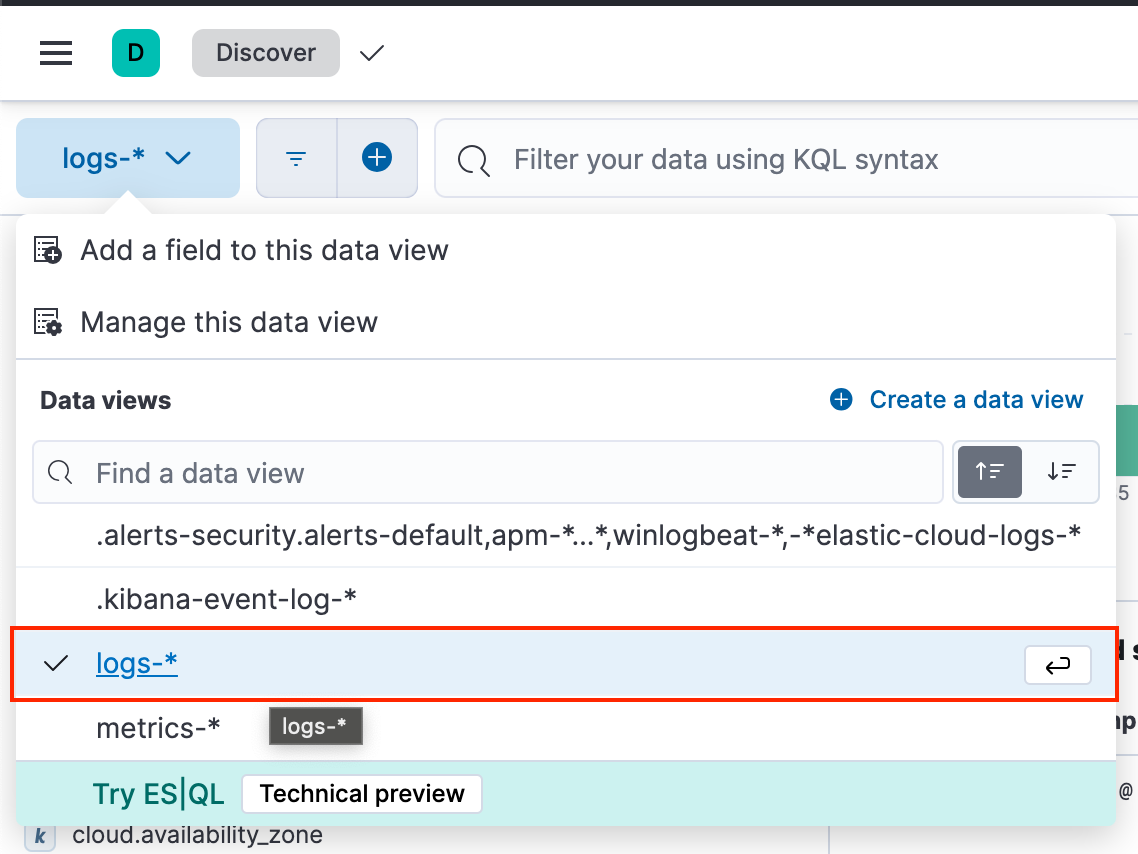
- Because the logs-* data view is generic, there may be too many data coming from all of the Elastic Stack logging files to easily find the ThreatConnect data. If you encounter this issue, click Create a data view in the Data views section of the data view menu to create the data view for the ThreatConnect data shown in Figure 12.
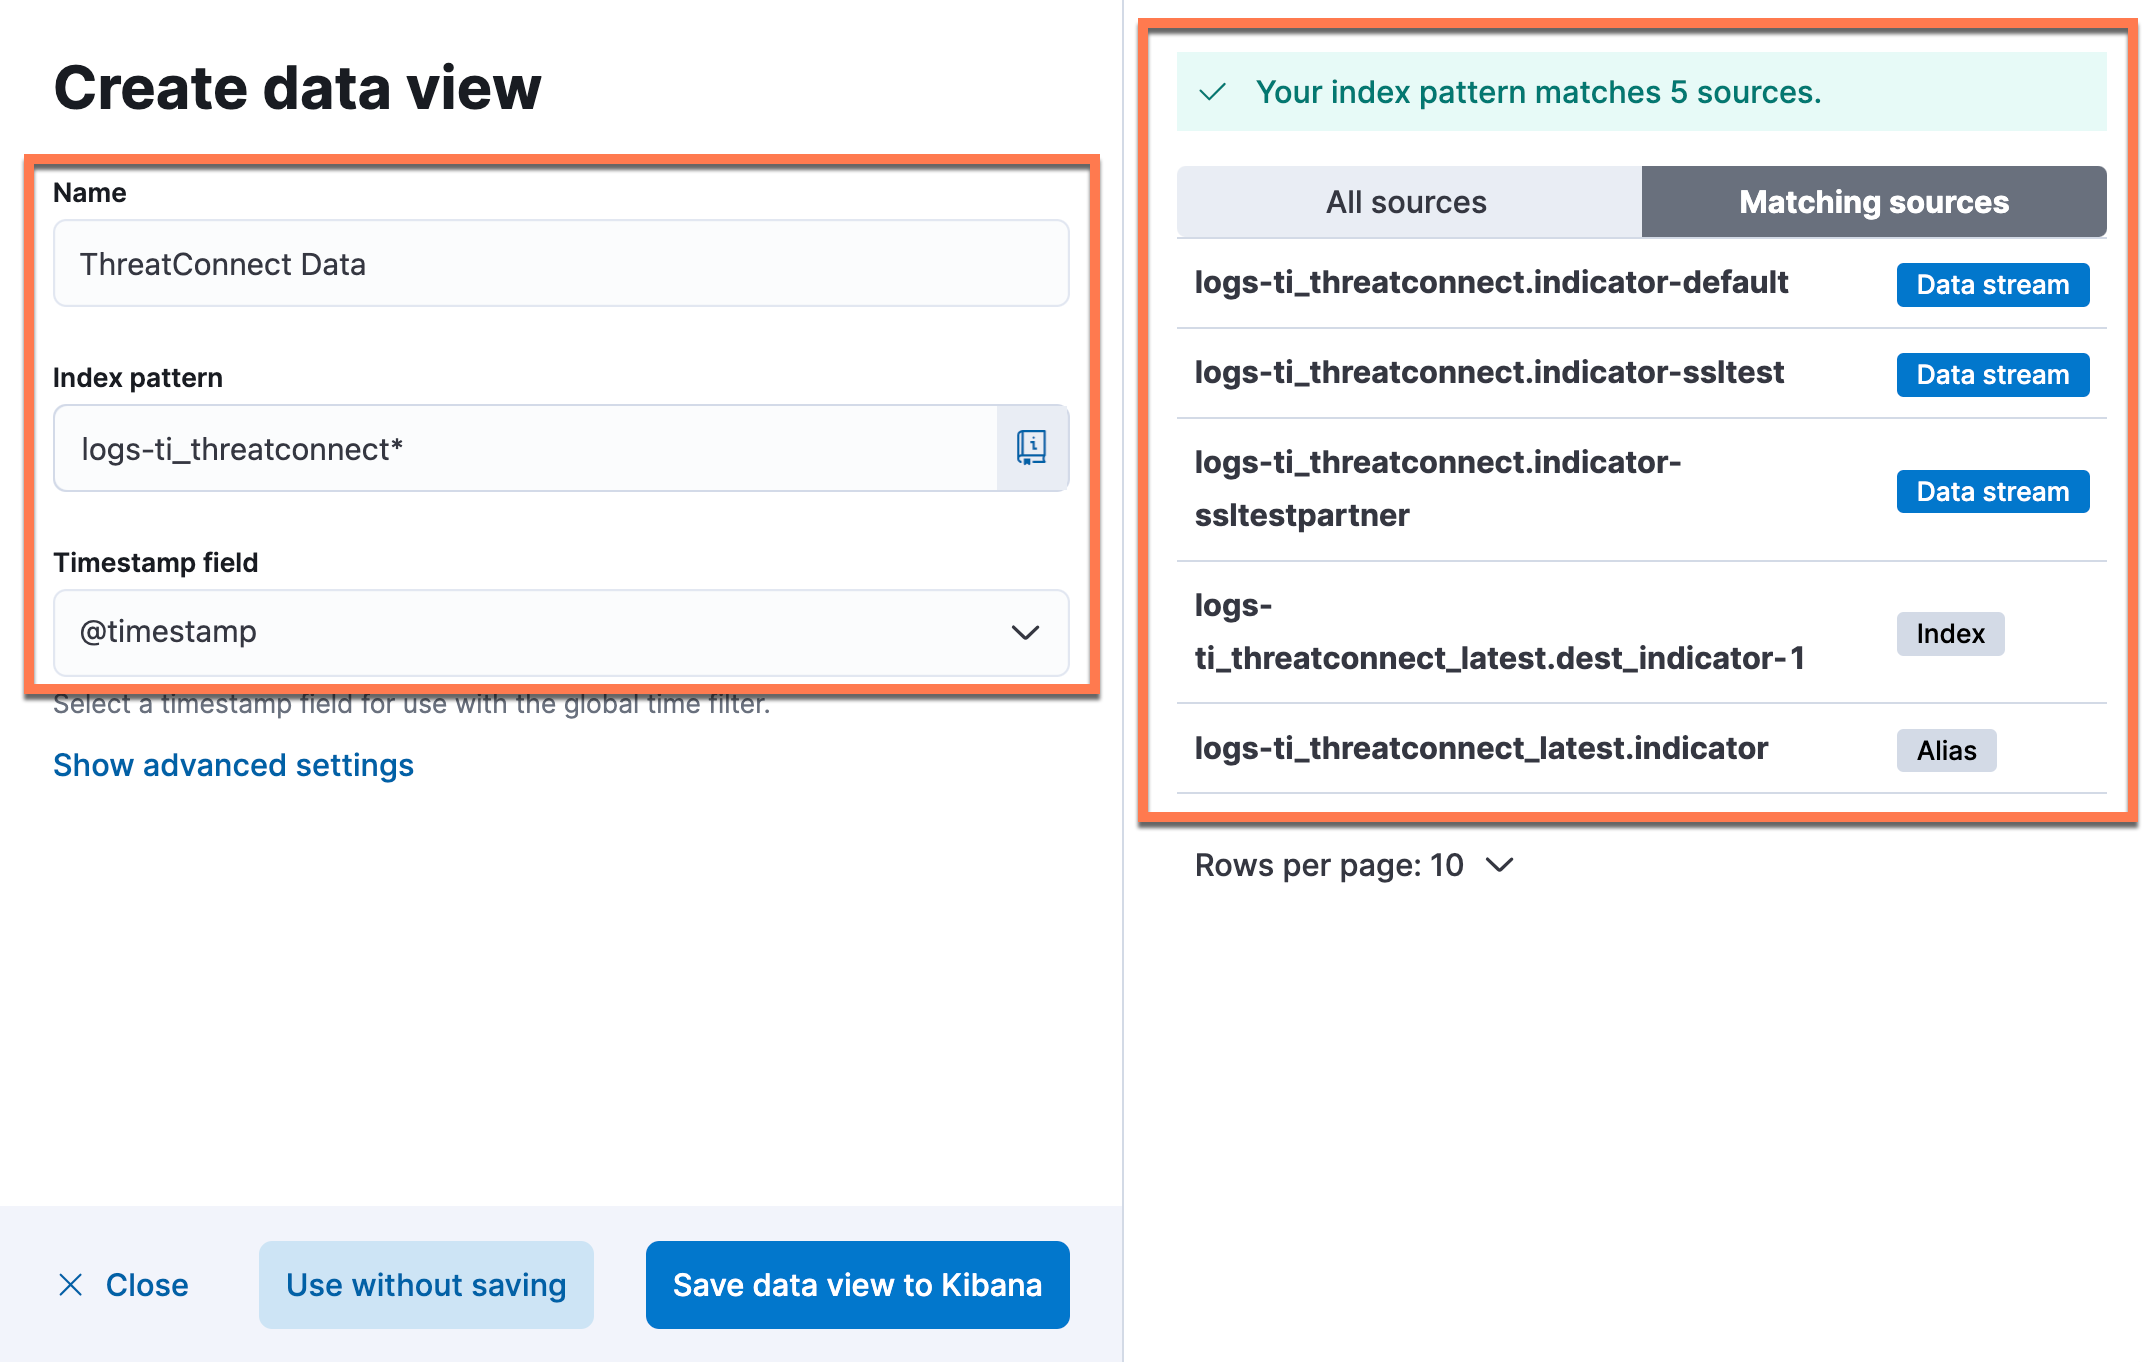
- Name: Enter ThreatConnect Data in the text box.
- Index pattern: Enter logs-ti_threatconnect* in the text box. After this value has been entered, matching log files will be displayed on the right side of the Create data view drawer.NoteIn Figure 12, the logs-ti_threatconnect.indicator-default source is the normal data stream, and the portion after the “-” character will match the value you entered for the integration’s Namespace parameter. Additionally, the logs-ti_threatconnect.dest_indicator-1 source is where all Indicators will be stored long term.
- Timestamp field: Keep the default value of @timestamp.
- Click Save data view to Kibana.
- After the ThreatConnect Data data view has been created, it will be selected as the data view on the Discover page automatically. If the ThreatConnect Data data view displays no data, change the time range from the default value of Last 15 minutes to the value entered for the integration’s Initial Interval parameter.NoteTo quickly validate whether Elastic Security has ingested data, set the time range to Last 90 days.
- When the ThreatConnect Data data view displays data, the Documents table will be populated with a list of documents associated with the integration. To view a document’s full details, click Expand
 for the document. If the document contains a
 threat.indicator.referencefield that shows the URL for the Indicator’s Details screen in ThreatConnect (Figure 13), then Elastic Security is ingesting data and the integration has been deployed successfully.ImportantIf an expanded document contains an
error.messagefield that is populated with data, there may be a configuration error or connection failure between Elastic Security and ThreatConnect. In this case, proceed to the “Integration Troubleshooting” section for further instruction. The following is the most common error message that may be displayed in theerror.messagefield:"error.message": [ "failed eval: internal error: runtime error: invalid memory address or nil pointer dereference", "Processor json with tag json_event_original in pipeline logs-ti_threatconnect.indicator-0.2.0 failed with message: field [original] not present as part of path [event.original]" ]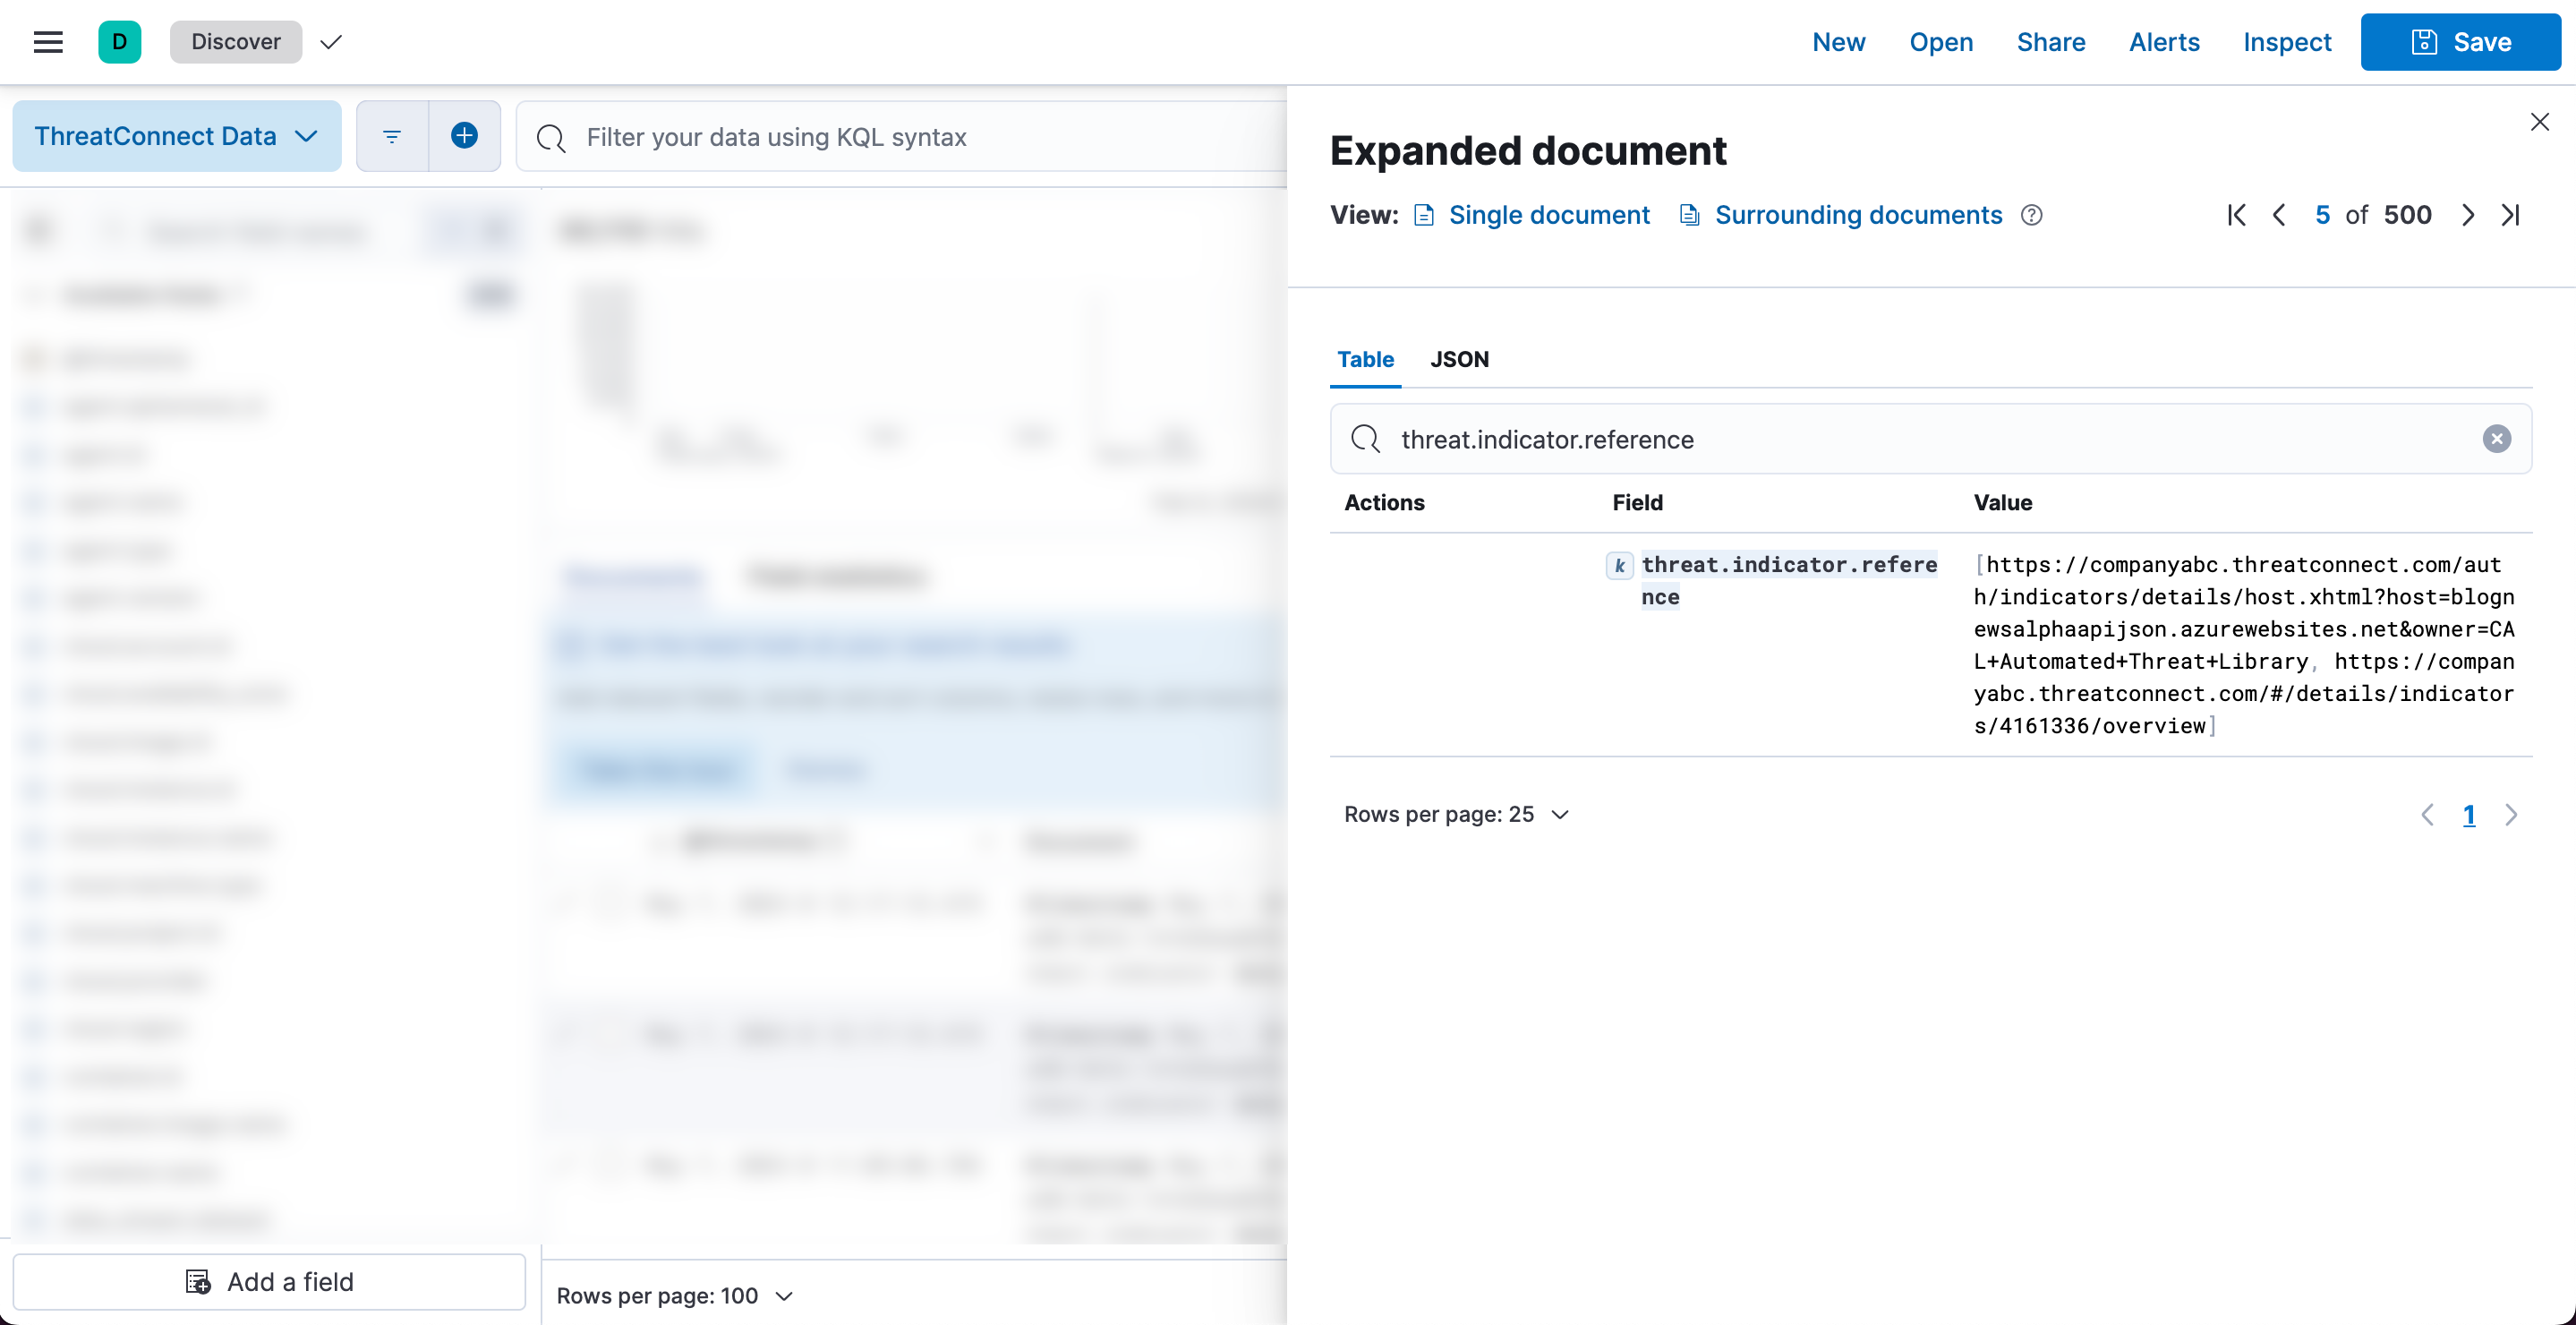
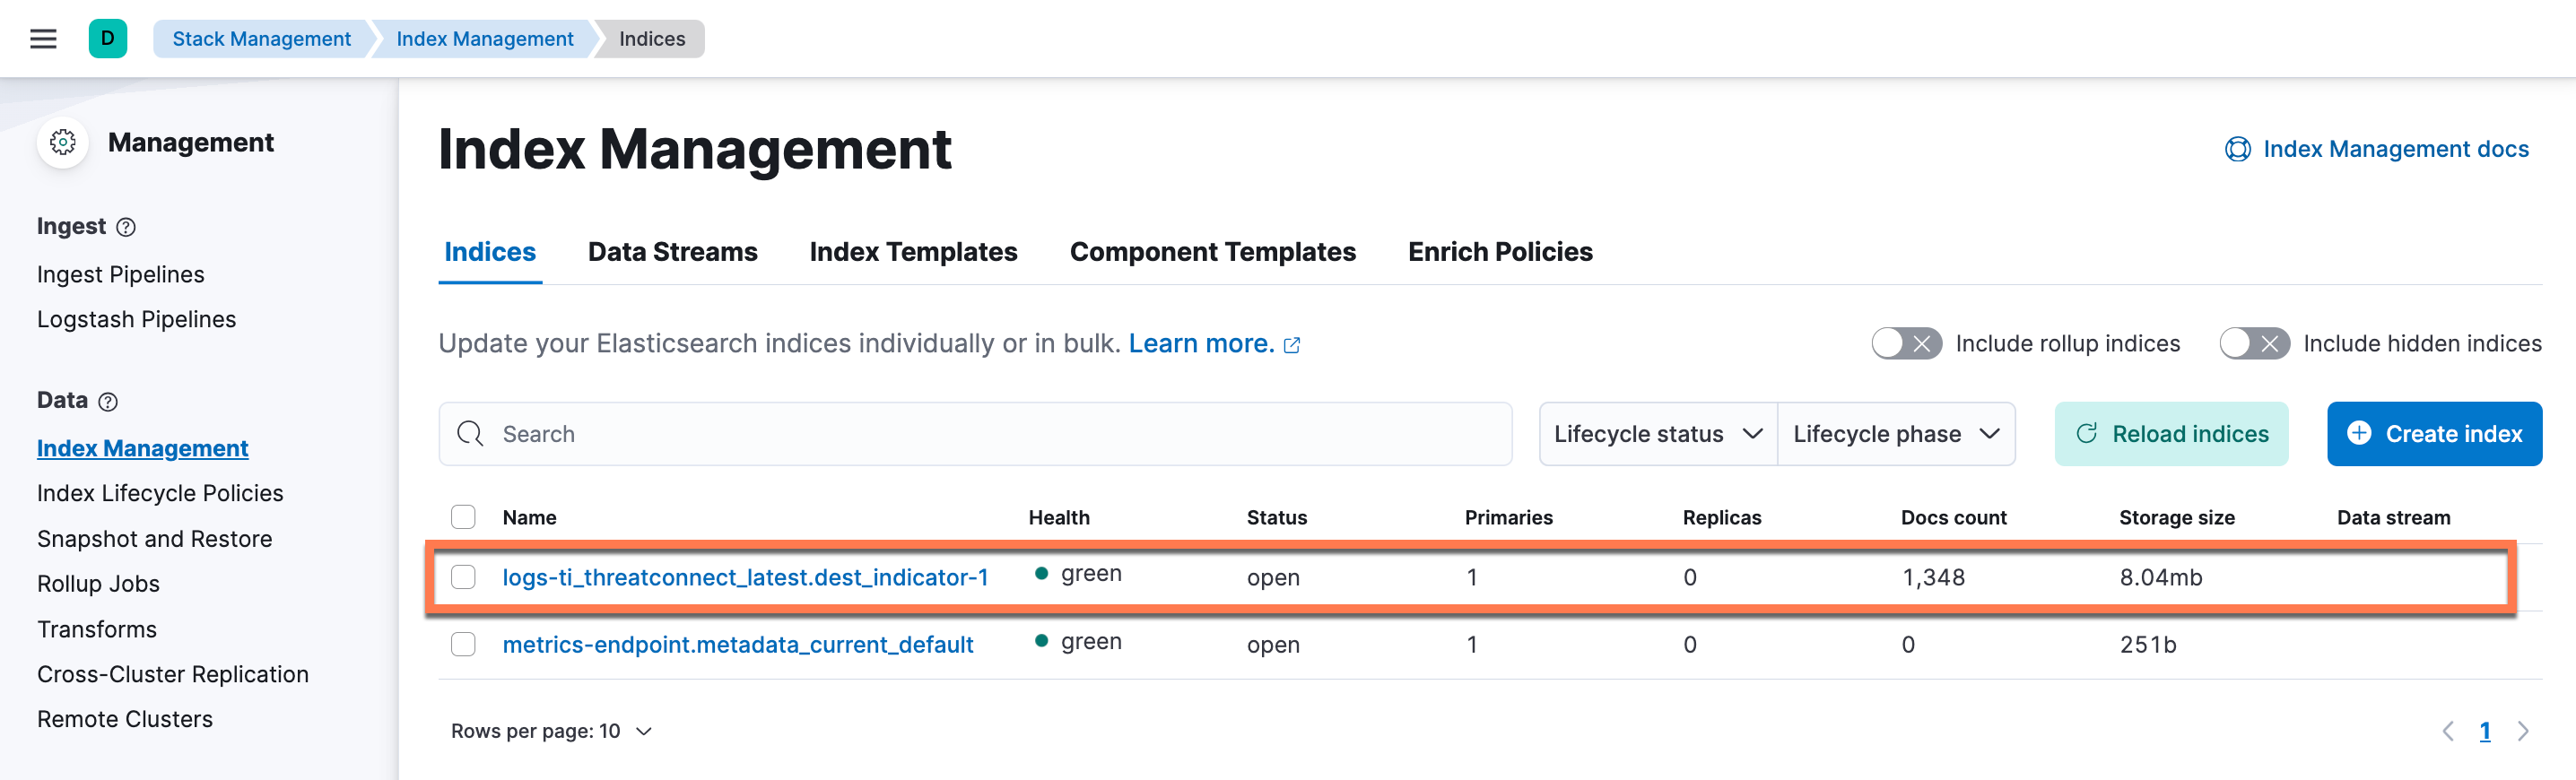
Index Management
- In Kibana, open the main menu and navigate to Management > Stack Management > Index Management.
- On the Indices tab of the Index Management page (Figure 14), locate the permanent index (logs-ti_threatconnect_latest.dest_indicator-1 if using version 1.0.0; logs-ti_threatconnect_latest.dest_indicator-2 if using version 1.0.1 or newer) and review the values in the Docs count and Storage size columns. If Doc count is greater than 0 and Storage size is in megabytes, then Elastic Security is ingesting data.
Intelligence
- In Kibana, open the main menu and navigate to Security > Intelligence.
- On the Indicators page, Indicators that Elastic Security has ingested will be displayed in the Trend section and the table below it. If the Indicators page displays no data, change the time range from the default value of Last 15 minutes to the value entered for the integration’s Initial Interval parameter.
Integration Troubleshooting
If you experience issues with the Elastic Security ThreatConnect integration (e.g., Elastic Security is not ingesting data), follow these steps to obtain log files that you can use to troubleshoot the integration:
- In Kibana, open the main menu and navigate to Management > Integrations > Installed integrations. Then click the ThreatConnect card.
- On the ThreatConnect integration page, select the Integration policies tab.
- Click the ⋯ menu in the Actions column for the desired integration policy and select Edit integration.
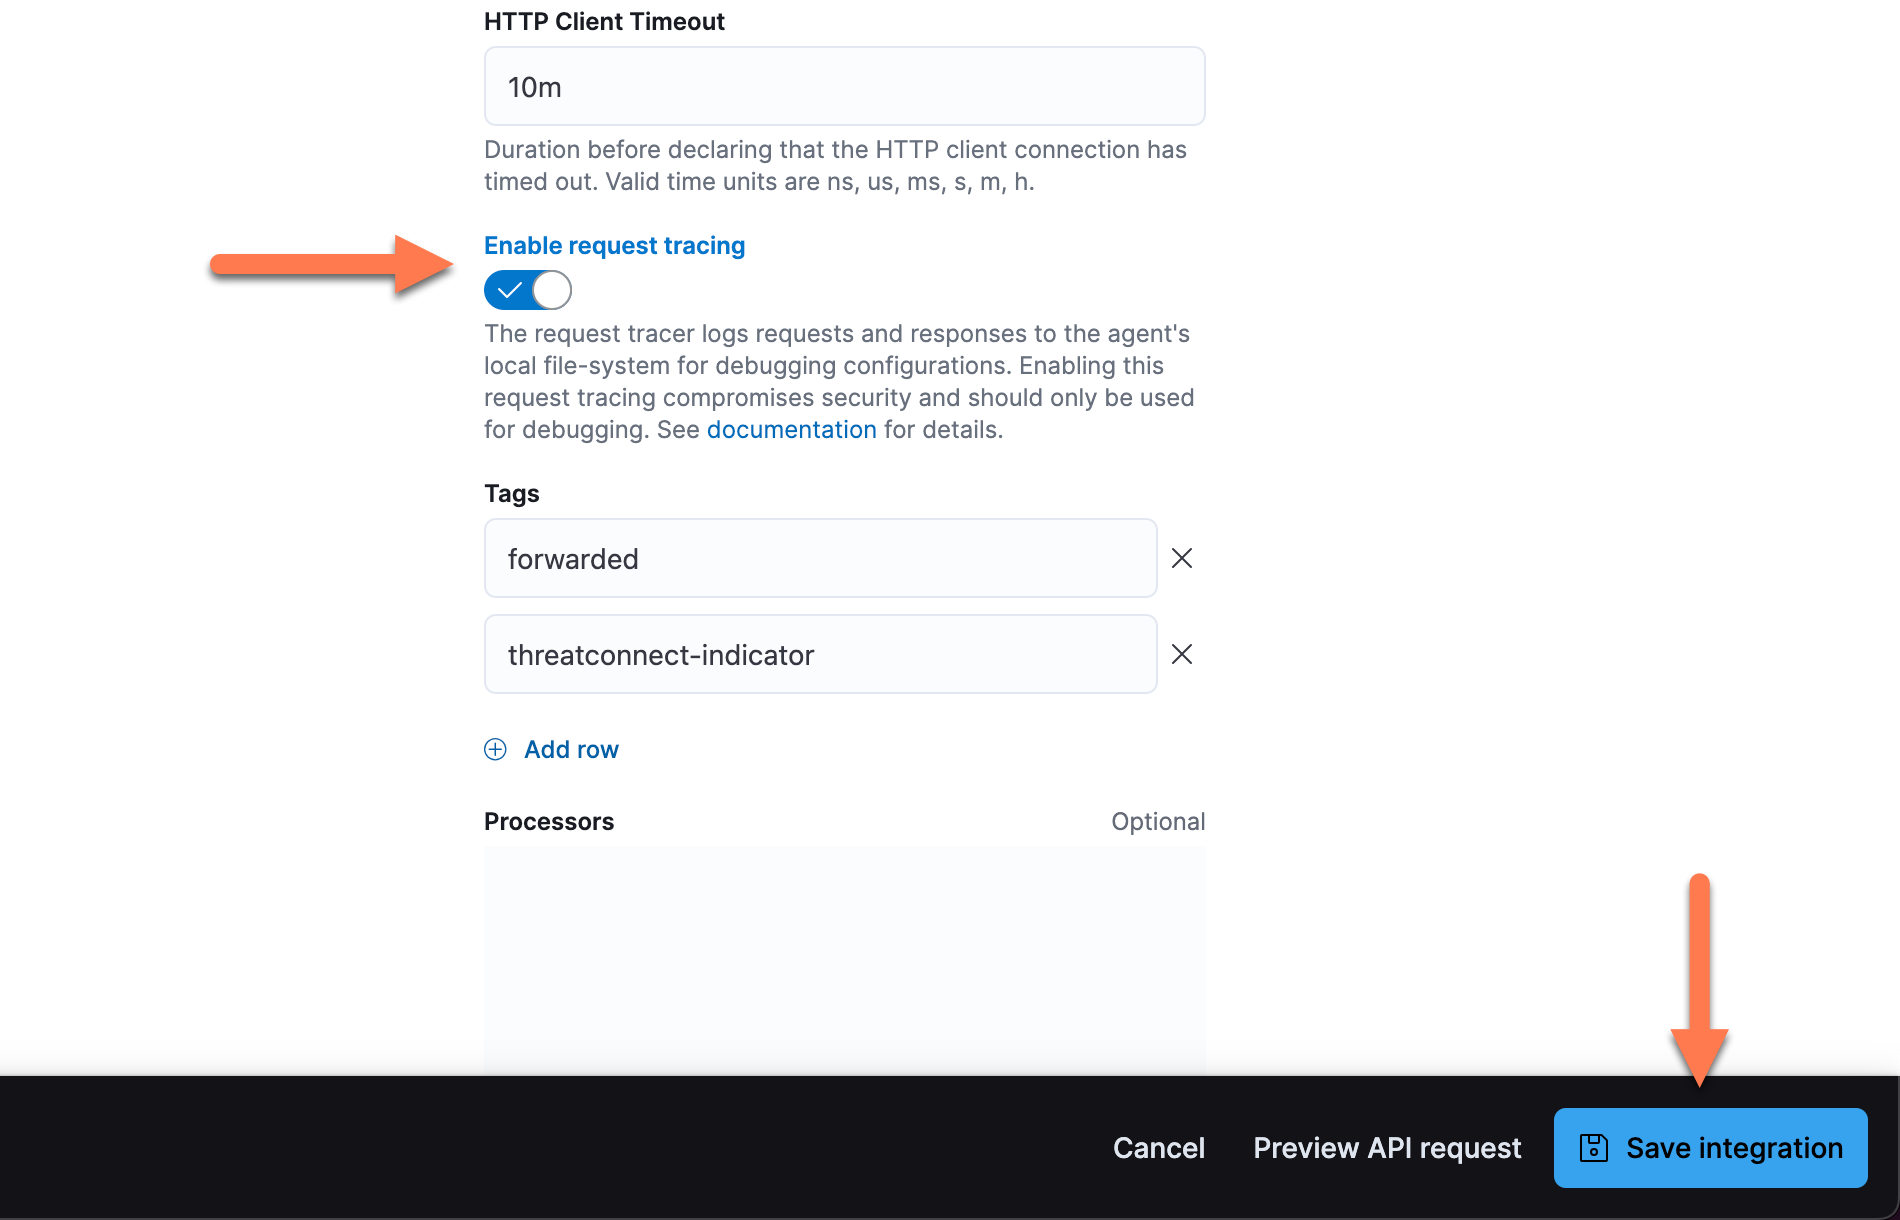
- On the Edit ThreatConnect integration page, click Change defaults to the right of the Collect ThreatConnect logs via API toggle. Then click Advanced options below the Preserve original event toggle.
- Turn on the Enable request tracing toggle, and then click Save integration to redeploy and rerun the integration (Figure 15).
- Open the main menu in Kibana and navigate to Management > Fleet.
- Select the Agent Policies tab. Then identify the Agent Policy running the ThreatConnect integration and click its name in the Name column.
- On the Agent Policy page, select the Settings tab. Then select Collect agent logs and Collect agent metrics in the Agent monitoring section and click Save changes.
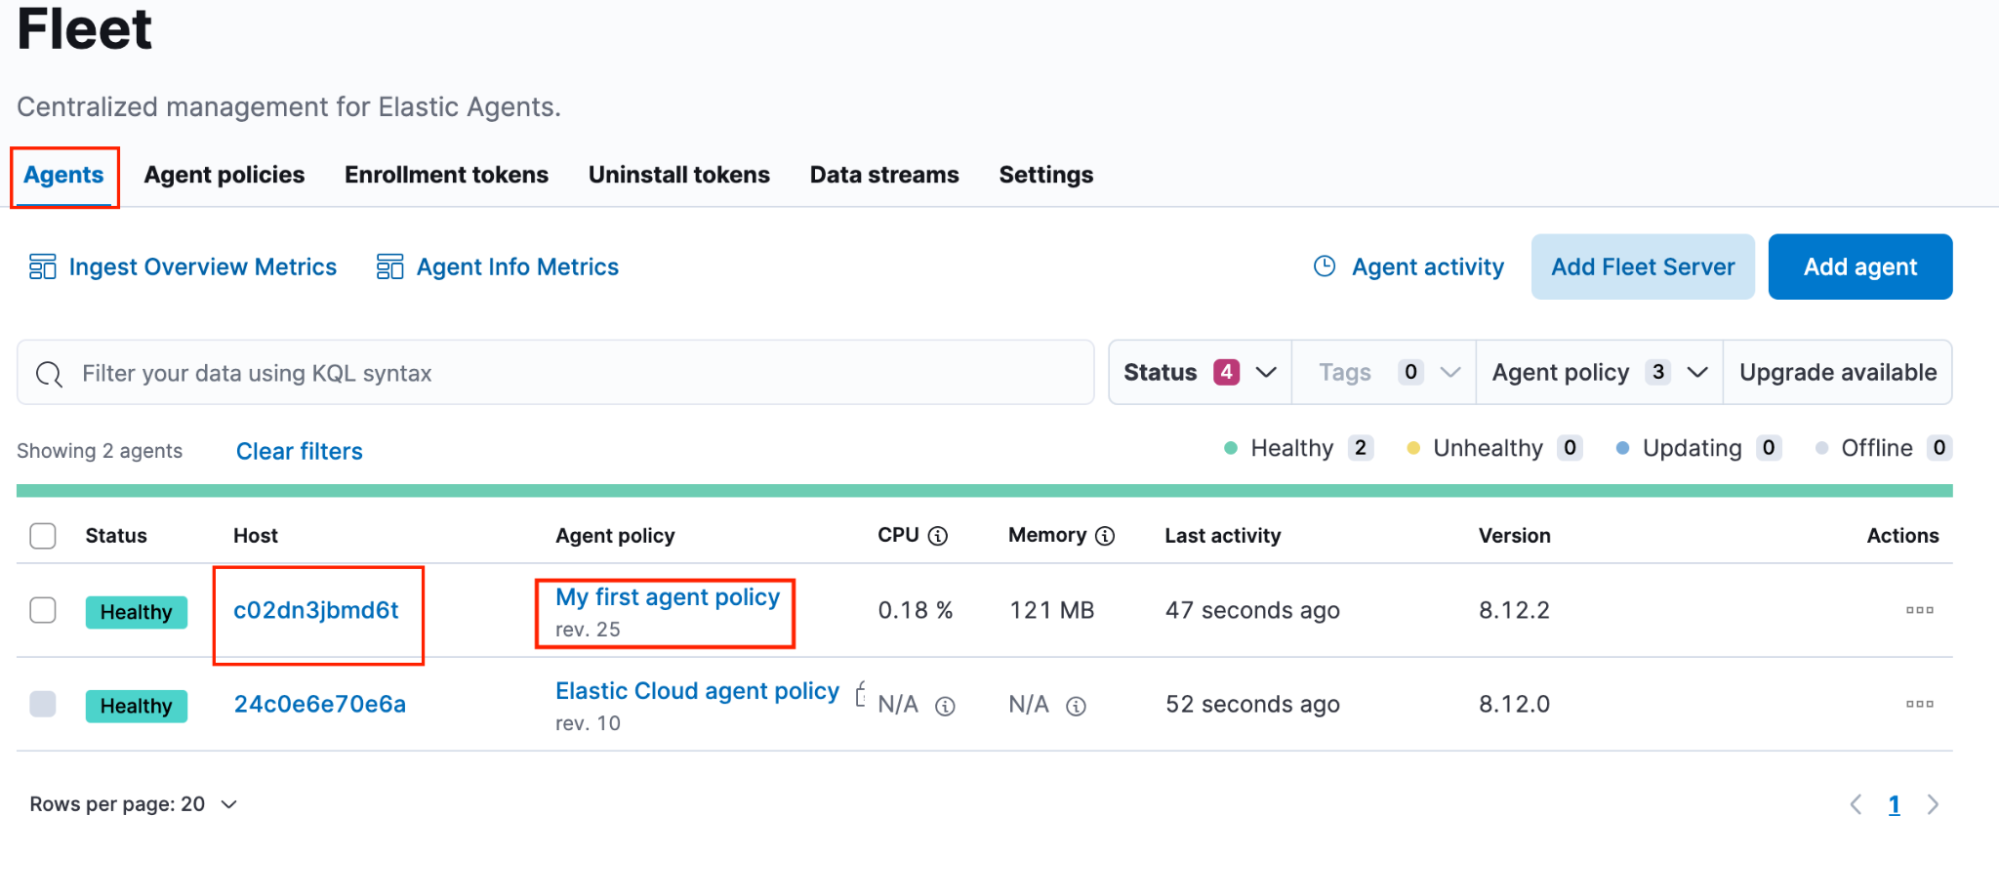
- Return to the Fleet page and select the Agents tab. Then identify the Elastic Agent host running the ThreatConnect integration and click the host’s name in the Host column (Figure 16). The host running the ThreatConnect integration will have the same agent policy on which the integration is running.
- On the host page, select the Logs tab. Then scroll down to the Agent logging level setting, select debug, and click Apply changes. Note that this change applies only to future log messages. Therefore, you may need to rerun the integration to be able to view meaningful agent logs.
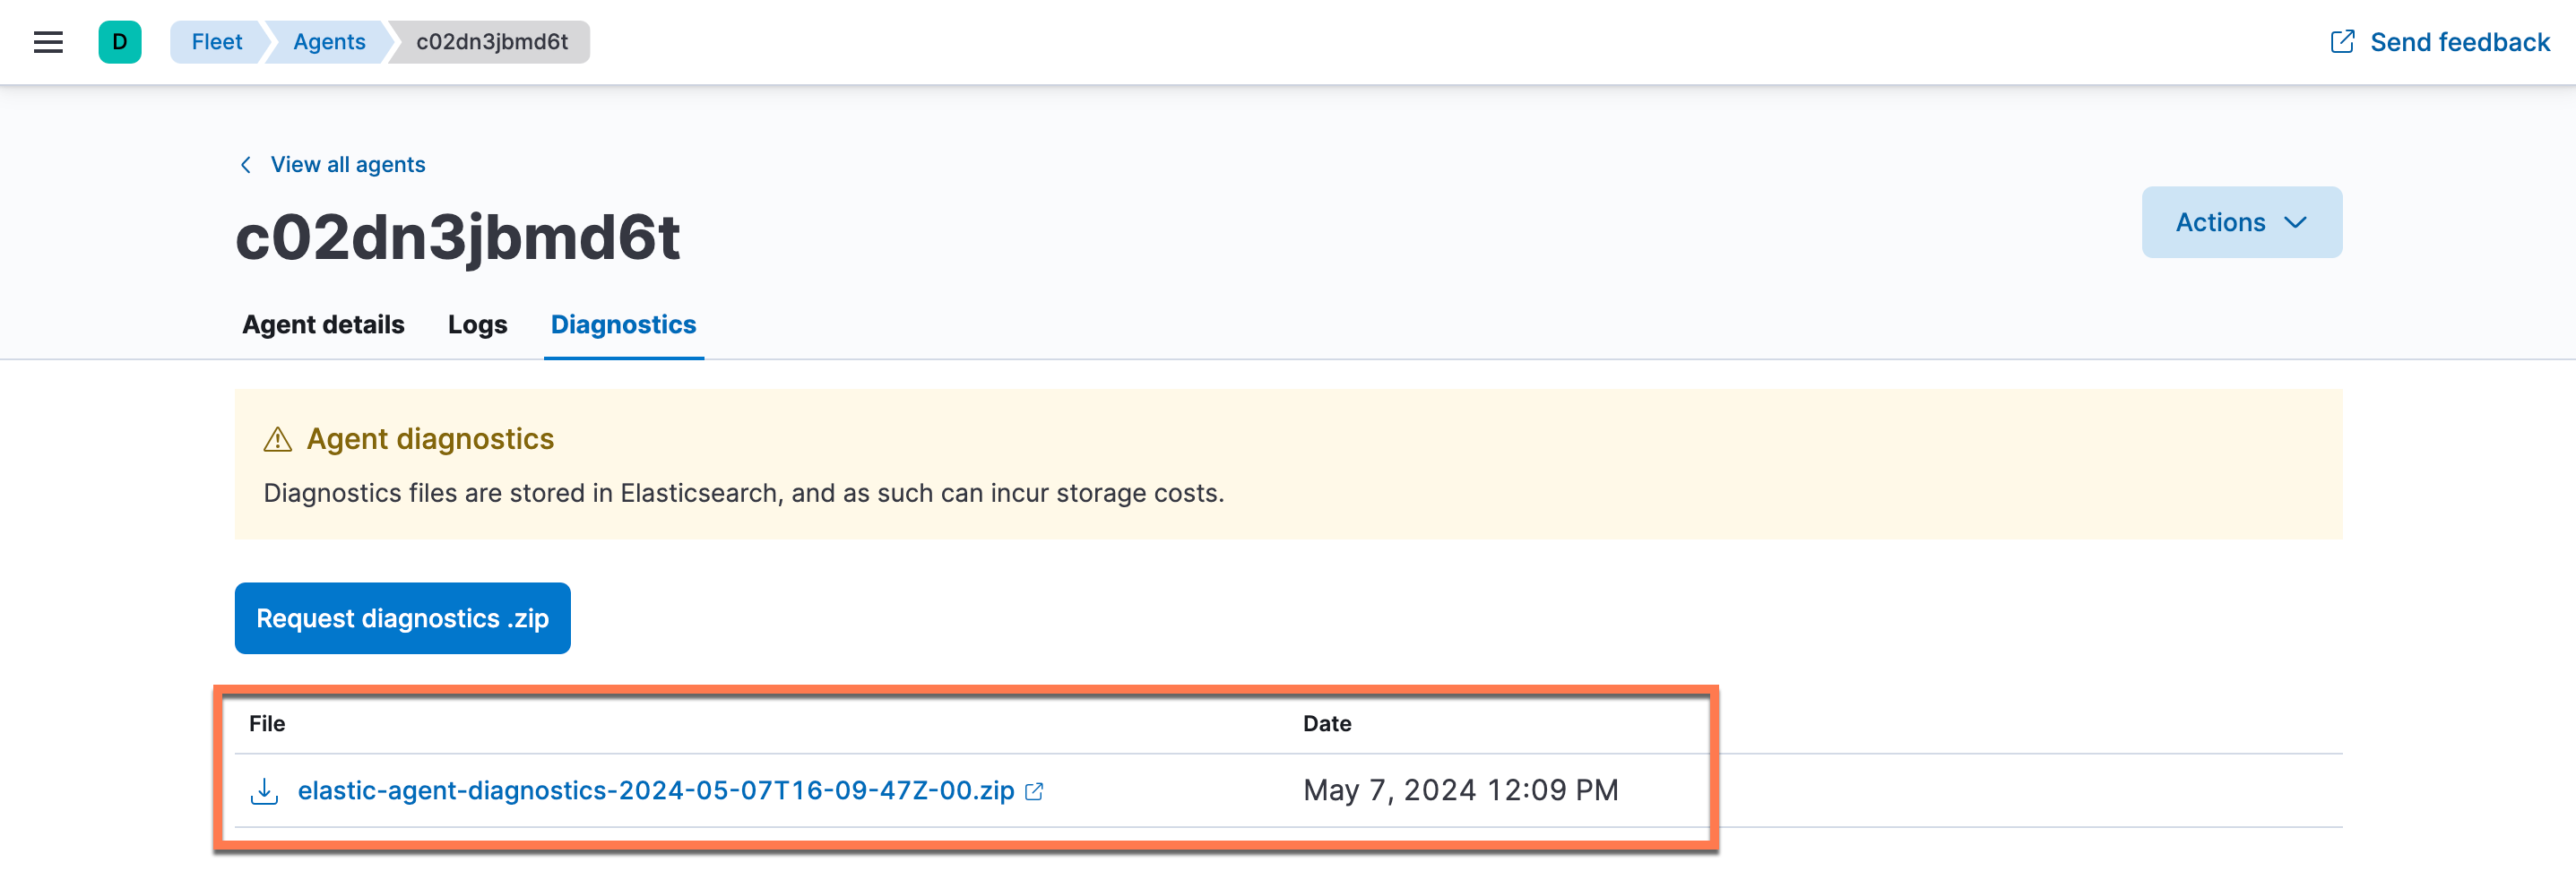
- On the host page, select the Diagnostics tab. Then click Request diagnostics .zip.
- Once the diagnostics ZIP file is generated, it will be displayed in the table below the Request diagnostics .zip button (Figure 17). Click the diagnostics ZIP file's name to download the file.
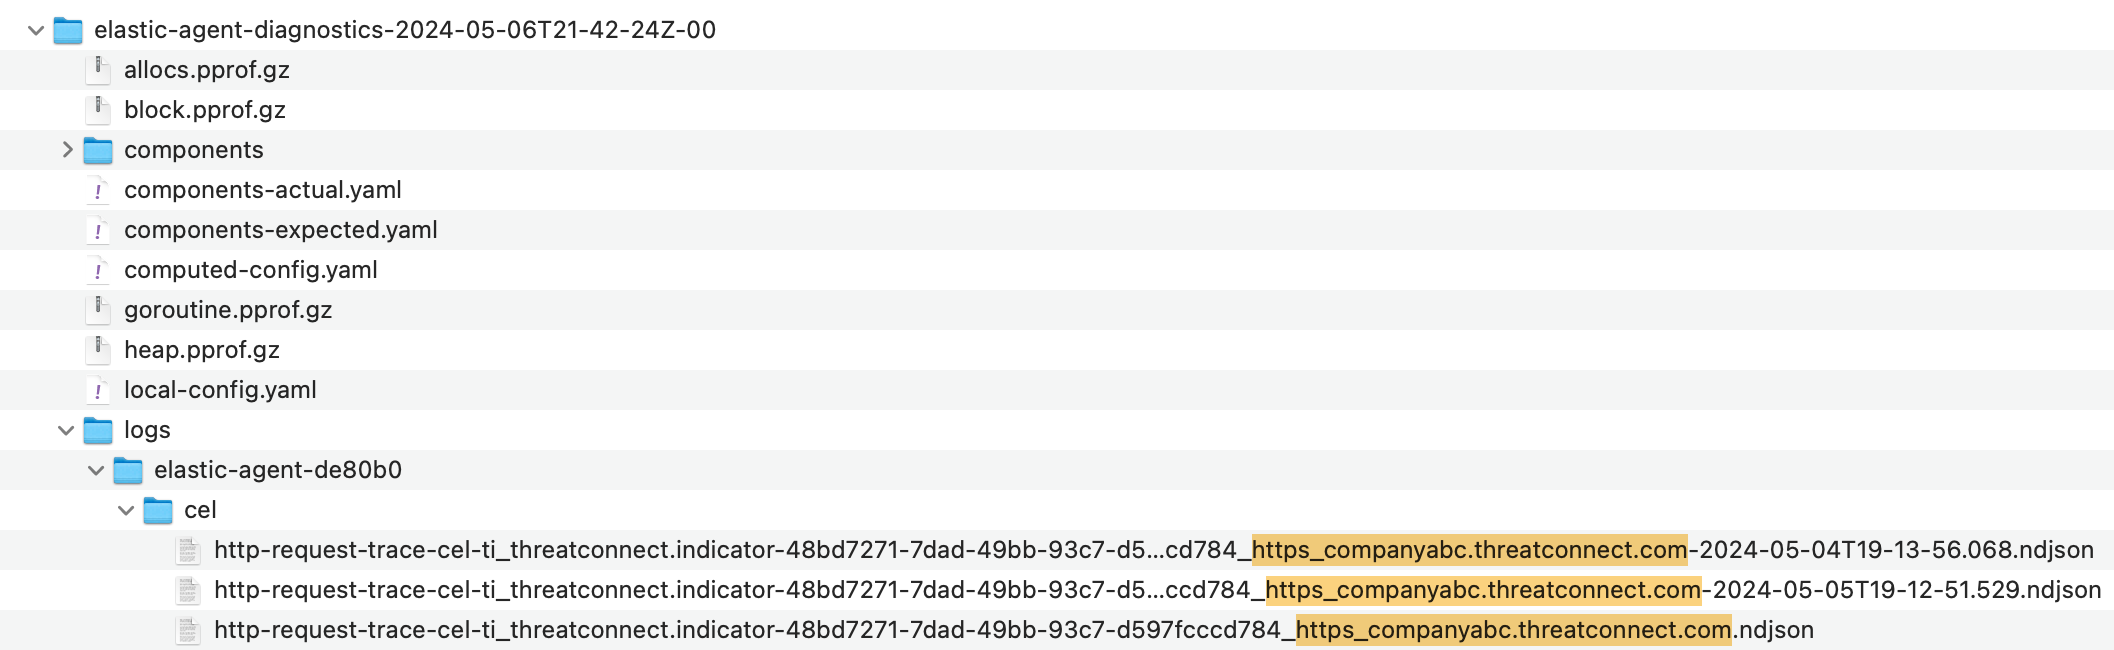
- Unzip the diagnostics ZIP file once it is downloaded, and then find the cel folder containing the http-request-trace logs (Figure 18). Note that each trace log is tied to a specific ThreatConnect instance URL. Each time the ThreatConnect instance URL is changed in the URL parameter and the integration runs, there will be a new trace log associated with that URL. The end of the trace log’s filename contains the specific ThreatConnect URL to which the trace log corresponds. Also, if multiple ThreatConnect integrations are running on a single host, the trace logs for each integration will be included in the ZIP file.
- Open the trace log that corresponds to the URL of the ThreatConnect instance from which the integration should be retrieving data.NoteBecause the trace logs are in JSON format, it is recommended to format the logs with a code editor or JSON formatter tool for better viewing.
The following code sample shows an example of a formatted trace log. The first JSON object is the request, and the second JSON object is the response. Note that the entire request is shown in the url.original field and can be used in an API testing tool to verify whether there is an issue with the API request. The second JSON object contains the http.response.status_code and http.response.body.content fields, both of which can be used to debug issues with the API request.
{
"log.level": "debug",
"@timestamp": "2024-03-04T15:54:30.102-0500",
"message": "HTTP request",
"transaction.id": "CP0QH8NVL6SHE-12",
"url.original": "https://companyabc.threatconnect.com/api/v3/indicators?fields=associatedGroups&fields=associatedIndicators&fields=attributes&fields=securityLabels&fields=sightings&fields=tags&fields=threatAssess&resultLimit=5000&resultStart=0&sorting=lastModified+asc&tql=lastModified+GEQ+%222024-02-26T20%3A48%3A23Z%22",
"url.scheme": "https",
"url.path": "/api/v3/indicators",
"url.domain": "companyabc.threatconnect.com",
"url.port": "",
"url.query": "fields=associatedGroups&fields=associatedIndicators&fields=attributes&fields=securityLabels&fields=sightings&fields=tags&fields=threatAssess&resultLimit=5000&resultStart=0&sorting=lastModified+asc&tql=lastModified+GEQ+%222024-02-26T20%3A48%3A23Z%22",
"http.request.method": "GET",
"user_agent.original": "",
"http.request.body.content": "",
"http.request.body.bytes": 0,
"http.request.mime_type": "",
"event.original": "GET /api/v3/indicators?fields=associatedGroups&fields=associatedIndicators&fields=attributes&fields=securityLabels&fields=sightings&fields=tags&fields=threatAssess&resultLimit=5000&resultStart=0&sorting=lastModified+asc&tql=lastModified+GEQ+%222024-02-26T20%3A48%3A23Z%22 HTTP/1.1\r\nHost: companyabc.threatconnect.com\r\nUser-Agent: Go-http-client/1.1\r\nAuthorization: TC 70295075712214205425:b7RBP1UMhpVOeOGEUeEXuwL5A9/9Lk3sEFbaOBJNWXE=\r\nTimestamp: 1709585303\r\nAccept-Encoding: gzip\r\n\r\n",
"ecs.version": "1.6.0"
}
{
"log.level": "debug",
"@timestamp": "2024-03-04T15:54:30.127-0500",
"message": "HTTP response",
"transaction.id": "CP0QH8NVL6SHE-12",
"http.response.status_code": 401,
"http.response.body.content": "{\"message\":\"ERROR (Unauthorized): You are not authorized to perform the requested operation.\",\"status\":\"Error\"}",
"http.response.body.bytes": 111,
"http.response.mime_type": "application/json",
"event.original": "HTTP/1.1 401 Unauthorized\r\nConnection: close\r\nTransfer-Encoding: chunked\r\nAccess-Control-Allow-Methods: GET, PUT, POST, DELETE, OPTIONS\r\nAccess-Control-Allow-Origin: *\r\nCache-Control: no-Store,no-Cache\r\nContent-Type: application/json\r\nDate: Mon, 04 Mar 2024 20:54:30 GMT\r\nPragma: no-Cache\r\nServer: nginx\r\nStrict-Transport-Security: max-age=31536000;\r\nX-Content-Type-Options: nosniff\r\nX-Frame-Options: SAMEORIGIN\r\nX-Xss-Protection: 1; mode=block\r\n\r\n",
"ecs.version": "1.6.0"
}See Table 2 for a list of common HTTP status codes and errors that you may encounter when troubleshooting issues with the integration.
| http.response.status_code | http.response.body.content | Explanation |
|---|---|---|
| 400 | "message\":\"Error processing request. Make sure the URI is encoded. Due to: calculated signature and header signature mismatch." | The ThreatConnect instance URL, the API user’s Access ID, or the API user’s Secret Key was entered incorrectly when the integration was configured. |
| 401 | "ERROR (Unauthorized): You are not authorized to perform the requested operation." | There is something wrong with the authentication of the request. Check the values entered for the integration’s Access ID and Secret Key parameters. |
| 404 | "Resource not found, check the requested path. Please review your request and try again. If the problem persists, contact technical support." | The value for the integration’s URL parameter was not entered properly. For example, if the ThreatConnect instance URL is https:/companyabc.threatconnect.com and https://companyabc.threatconnect.com/api is entered into the integration’s URL parameter, an additional /api will be included in the request URL (i.e., https://companyabc.threatconnect.com/api/api). |
| - | "net/http: request canceled". | The integration is canceling the HTTP request to the ThreatConnect instance. One way to fix this is to double the value of the integration’s HTTP Client Timeout parameter. Alternatively, decrease the value of the integration’s Batch Size parameter to 1000. Reducing the amount of data per request can increase the transaction rate and prevent requests from reaching the timeout. You may also increase the value of the HTTP Client Timeout parameter and decrease the value of the Batch Size parameter simultaneously to further fine-tune the data retrieval performance. |
If the API request was successful and data are flowing from ThreatConnect to Elastic Security, the trace log will look like the following code sample, where there are multiple requests in a row that include a 200 HTTP status code and no response body. The JSON object containing the response body will be shown only when there is an issue with the API request.
{
"log.level": "debug",
"@timestamp": "2024-04-30T21:00:18.938Z",
"message": "HTTP request",
"transaction.id": "1C01L1K15B5HE-1",
"url.original": "https://companyabc.threatconnect.com/api/v3/indicators?fields=associatedGroups&fields=associatedIndicators&fields=attributes&fields=securityLabels&fields=sightings&fields=tags&fields=threatAssess&resultLimit=200&resultStart=0&sorting=lastModified+asc&tql=lastModified+GEQ+%222024-04-30T20%3A10%3A17Z%22+AND+ownerName+in+%28%22CAL+Automated+Threat+Library%22%29+and+typeName+in+%28%22URL%22%2C+%22EmailAddress%22%29+and+dateAdded+%3E+%2204-01-2024%22",
"url.scheme": "https",
"url.path": "/api/v3/indicators",
"url.domain": "companyabc.threatconnect.com",
"url.port": "",
"url.query": "fields=associatedGroups&fields=associatedIndicators&fields=attributes&fields=securityLabels&fields=sightings&fields=tags&fields=threatAssess&resultLimit=200&resultStart=0&sorting=lastModified+asc&tql=lastModified+GEQ+%222024-04-30T20%3A10%3A17Z%22+AND+ownerName+in+%28%22CAL+Automated+Threat+Library%22%29+and+typeName+in+%28%22URL%22%2C+%22EmailAddress%22%29+and+dateAdded+%3E+%2204-01-2024%22",
"http.request.method": "GET",
"user_agent.original": "",
"http.request.body.content": "",
"http.request.body.bytes": 0,
"http.request.mime_type": "",
"event.original": "GET /api/v3/indicators?fields=associatedGroups&fields=associatedIndicators&fields=attributes&fields=securityLabels&fields=sightings&fields=tags&fields=threatAssess&resultLimit=200&resultStart=0&sorting=lastModified+asc&tql=lastModified+GEQ+%222024-04-30T20%3A10%3A17Z%22+AND+ownerName+in+%28%22CAL+Automated+Threat+Library%22%29+and+typeName+in+%28%22URL%22%2C+%22EmailAddress%22%29+and+dateAdded+%3E+%2204-01-2024%22 HTTP/1.1\r\nHost: companyabc.threatconnect.com\r\nUser-Agent: Go-http-client/1.1\r\nAuthorization: TC 51856757511267639807:8/ZGiYpkF0odcwePmA/yAkZCHJF7mrHaaVe50hQIp5k=\r\nTimestamp: 1714510818\r\nAccept-Encoding: gzip\r\n\r\n",
"ecs.version": "1.6.0"
}
{
"log.level": "debug",
"@timestamp": "2024-04-30T21:00:19.276Z",
"message": "HTTP response",
"transaction.id": "1C01L1K15B5HE-1",
"http.response.status_code": 200,
"http.response.body.content": "{\"data\":[],\"status\":\"Success\"}",
"http.response.body.bytes": 30,
"http.response.mime_type": "application/json",
"event.original": "HTTP/1.1 200 OK\r\nConnection: close\r\nTransfer-Encoding: chunked\r\nAccess-Control-Allow-Methods: GET, PUT, POST, DELETE, OPTIONS\r\nAccess-Control-Allow-Origin: *\r\nCache-Control: no-Store,no-Cache\r\nContent-Type: application/json\r\nDate: Tue, 30 Apr 2024 21:00:19 GMT\r\nPragma: no-Cache\r\nServer: nginx\r\nStrict-Transport-Security: max-age=31536000;\r\nX-Content-Type-Options: nosniff\r\nX-Frame-Options: SAMEORIGIN\r\nX-Xss-Protection: 1; mode=block\r\n\r\n",
"ecs.version": "1.6.0"
}Update the Integration
Follow these steps to update the Elastic Security ThreatConnect integration in Kibana:
- In Kibana, open the main menu and navigate to Management > Integrations > Installed integrations.
- If an update is available for the ThreatConnect integration, the ThreatConnect card will display an Update available label. Click the ThreatConnect card to open the ThreatConnectintegration page.NoteOn the ThreatConnect integration page, a
 icon will be displayed next to the version number if an update is available.
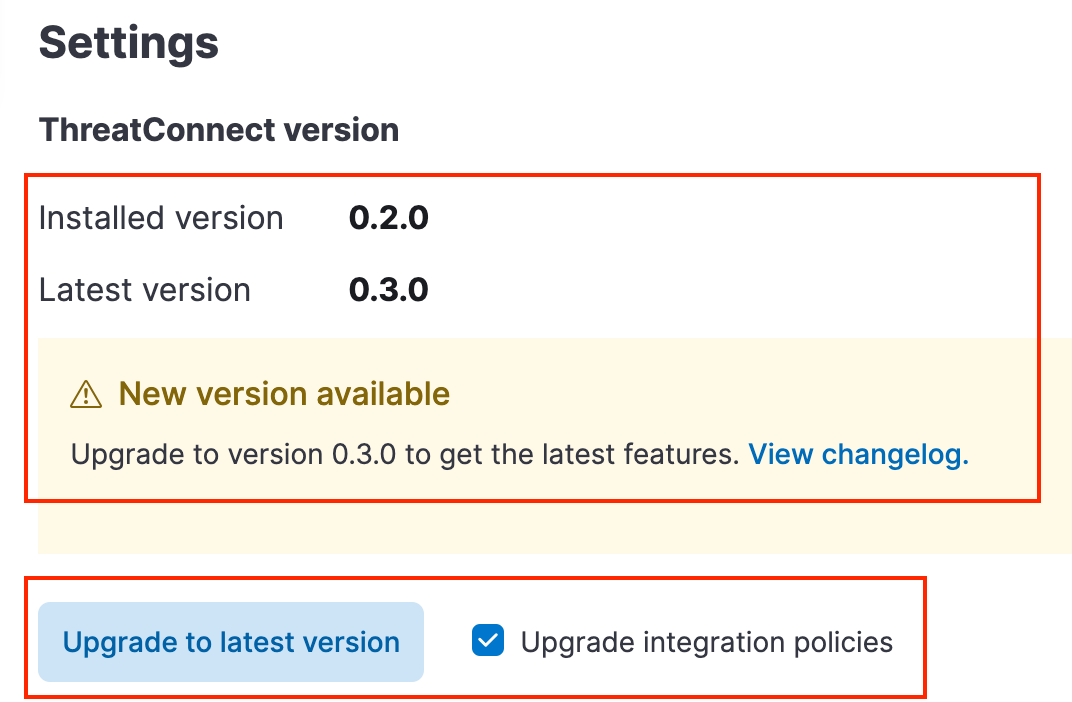
 - Select the Settings tab on the ThreatConnect integration page. On this tab, you can view the version of the integration that is currently installed, the latest version of the integration that is available, and a changelog for the latest version (Figure 19). To upgrade the integration to the latest version, click Upgrade to latest version.
 NoteIf you select the Upgrade integration policies checkbox, a Upgrade ThreatConnect and policies window that prompts you to confirm the upgrade will be displayed after you click Upgrade to latest version. Click the Upgrade ThreatConnect and policies button in this window to proceed with the upgrade.
Delete the Integration
If a situation arises where the Elastic Security ThreatConnect integration needs to be deleted, you can do so through the associated agent policy's page. For example, if the integration’s Initial Interval parameter is not set to the desired value and the integration already ran once, you will need to delete the integration and re-add it because, at this time, it is not possible to reset the Initial Interval timestamp after the integration has been deployed and run.
Follow these steps to delete the ThreatConnect integration in Kibana:
- In Kibana, open the main menu and navigate to Management > Fleet.
- On the Agents tab, select the agent policy associated with the ThreatConnect integration.
- On the agent policy page, click the ⋯ menu in the Actions column for the ThreatConnect integration and select Delete integration.
Reset the Integration Assets
In some cases (e.g., when you need to perform a clean installation of the Elastic Security ThreatConnect integration), you may need to reset or erase all of the Elastic Stack integration assets for each instance of the ThreatConnect integration.
Uninstall and Reinstall Assets Automatically
Follow these steps to uninstall and reinstall the ThreatConnect integration assets automatically:
- In Kibana, open the main menu and navigate to Management > Integrations > Installed integrations. Then select the ThreatConnect integration.
- Select the Integration policies tab on the ThreatConnect integration page. Then, for each instance of the integration, click the ⋯ menu in the Actions column and select Delete integration.
- Select the Settings tab on the ThreatConnect integration page. Then click Uninstall ThreatConnect to uninstall all assets installed by the ThreatConnect integration. Note that the Uninstall ThreatConnect button will not be available unless all instances of the ThreatConnect integration are deleted.
- Click Install ThreatConnect assets on the Settings tab to reinstall all of the ThreatConnect integration assets.
Uninstall and Reinstall Assets Manually
If you need to delete all data associated with the ThreatConnect integration, including Indicators that Elastic Security ingested and the built-in Kibana dashboard, you must uninstall some integration assets manually. Follow these steps to uninstall the ThreatConnect integration assets and reinstall them manually:
- In Kibana, open the main menu and navigate to Management > Integrations > Installed integrations. Then select the ThreatConnect integration.
- Select the Integration policies tab on the ThreatConnect integration page. Then, for each instance of the integration, click the ⋯ menu in the Actions column and select Delete integration.
- Open the main menu in Kibana and navigate to Management > Stack Management > Index Management.
- On the Indices tab of the Index Management page, search for
threatconnect, select all indices shown as results, click Manage index to the left of the search bar, and select Delete index to delete the permanent indices that were installed with the integration. - Select the Data Streams tab on the Index Management page. Then search for
threatconnect, select all data streams shown as results, and click Delete data streams to the left of the search bar to delete the selected items. - Select the Index Templates tab on the Index Management page. Then search for
threatconnect, select all index templates shown as results, and click Delete templates to the left of the search bar to delete the selected items. - Select the Component Templates tab on the Index Management page. Then search for
threatconnect, select all component templates shown as results, and click Delete component templates to the left of the search bar to delete the selected items. - Open the main menu in Kibana and navigate to Analytics > Dashboards. Then search for
threatconnect, select all dashboards shown as results, and click Delete dashboards to the left of the search bar to delete the selected items. - Open the main menu in Kibana and navigate to Management > Integrations > Installed integrations. Then select the ThreatConnect integration.
- Select the Settings tab on the ThreatConnect integration page. Then click Install ThreatConnect assets to reinstall all of the ThreatConnect integration assets.
Data Mappings
The data mappings in Table 3 illustrate how data are mapped from the ThreatConnect data model to the Elastic Common Scheme (ECS). ThreatConnect fields also come in as Elastic custom fields for reference.
| ThreatConnect API Field | ECS Field | Elastic Custom Mapping Field | Sample Value |
|---|---|---|---|
| active | threat_connect.indicator.active.value | TRUE | |
| activeLocked | threat_connect.indicator.active.locked | FALSE | |
| address | threat.indicator.email.address | threat_connect.indicator.address | jelod40108@newnime.com |
| AS Number | threat.indicator.as.number | threat_connect.indicator.as_number | ASN1234 |
| associatedArtifacts | threat_connect.indicator.associated_artifacts | {"data": [{"id": 12345,"summary": "71.6.135.131","type": "Address","intelType": "indicator-Address","dateAdded": "2023-03-28T13:49:32Z","derivedLink": true,"hashCode": "DQdYXoSZXiWM2shjCXxdsHTcflvuoi12dli1oo7oFHs="}]} | |
| associatedCases | threat_connect.indicator.associated_cases | {"data": [{"id": 12345,"xid": "a1a1a1a1-a1a1-a1a1-a1a1-a1a1a1a1a1a1","name": "Test Case","dateAdded": "2022-10-04T12:49:08Z","lastUpdated": "2023-08-28T21:00:30Z","caseOpenTime": "2022-10-04T12:49:08Z","caseOpenUser": {"id": 1,"userName": "djones","firstName": "Douglas","lastName": "Jones","pseudonym": "DMJ","owner": "Demo Organization"},"status": "Open","severity": "High","resolution": "Not Specified","assignee": {"type": "User","data": {"id": 2,"userName": "hhodges","firstName": "Herschel","lastName": "Hodges","pseudonym": "HRH","owner": "Demo Organization"}},"createdBy": {"id": 1,"userName": "djones","firstName": "Douglas","lastName": "Jones","pseudonym": "DMJ","owner": "Demo Organization"},"owner": "Demo Organization","ownerId": 5}]} | |
| associatedGroups.data[].assignments.data.type | threat_connect.indicator.associated_groups.data[].assignments.data.type | Assigned | |
| associatedGroups.data[].assignments.data.user.id | threat_connect.indicator.associated_groups.data[].assignments.data.user.id | 12 | |
| associatedGroups.data[].body | threat_connect.indicator.associated_groups.data[].body | Please visit bad.com to see your order and give us all your money | |
| associatedGroups.data[].createdBy.firstName | threat_connect.indicator.associated_groups.data[].created_by.first_name | John | |
| associatedGroups.data[].createdBy.id | threat_connect.indicator.associated_groups.data[].created_by.id | 3 | |
| associatedGroups.data[].createdBy.lastName | threat_connect.indicator.associated_groups.data[].created_by.last_name | Smith | |
| associatedGroups.data[].createdBy.owner | threat_connect.indicator.associated_groups.data[].created_by.owner | Demo Organization | |
| associatedGroups.data[].createdBy.pseudonym | threat_connect.indicator.associated_groups.data[].created_by.pseudonym | jsmith | |
| associatedGroups.data[].createdBy.userName | threat_connect.indicator.associated_groups.data[].created_by.user_name | jsmith@companyabc.com | |
| associatedGroups.data[].dateAdded | threat_connect.indicator.associated_groups.data[].date_added | 2021-11-03T14:57:45Z | |
| associatedGroups.data[].documentDateAdded | threat_connect.indicator.associated_groups.data[].document.date_added | 2021-10-21T19:54:59Z | |
| associatedGroups.data[].documentType | threat_connect.indicator.associated_groups.data[].document.type | Text | |
| associatedGroups.data[].downVoteCount | threat_connect.indicator.associated_groups.data[].down_vote_count | 0 | |
| associatedGroups.data[].dueDate | threat_connect.indicator.associated_groups.data[].due_date | 2021-09-17T12:50:19Z | |
| associatedGroups.data[].emailDate | threat_connect.indicator.associated_groups.data[].email_date | 2021-09-17T12:50:19Z | |
| associatedGroups.data[].escalationDate | threat_connect.indicator.associated_groups.data[].escalation_date | 2021-09-17T12:50:19Z | |
| associatedGroups.data[].eventDate | threat_connect.indicator.associated_groups.data[].event_date | 2021-09-17T12:50:19Z | |
| associatedGroups.data[].externalDateAdded | threat_connect.indicator.associated_groups.data[].external.date.added | 2021-09-17T12:50:19Z | |
| associatedGroups.data[].externalDateExpires | threat_connect.indicator.associated_groups.data[].external.date.expires | 2021-09-17T12:50:19Z | |
| associatedGroups.data[].externalLastModified | threat_connect.indicator.associated_groups.data[].external.last_modified | 2021-09-17T12:50:19Z | |
| associatedGroups.data[].fileName | threat_connect.indicator.associated_groups.data[].file.name | indicators.txt | |
| associatedGroups.data[].fileSize | threat_connect.indicator.associated_groups.data[].file.size | 36 | |
| associatedGroups.data[].fileText | threat_connect.indicator.associated_groups.data[].file.text | File text | |
| associatedGroups.data[].fileType | threat_connect.indicator.associated_groups.data[].file.type | Hash | |
| associatedGroups.data[].firstSeen | threat_connect.indicator.associated_groups.data[].first_seen | 2021-09-17T12:50:19Z | |
| associatedGroups.data[].from | threat_connect.indicator.associated_groups.data[].from | auto-confirm@bad.com | |
| associatedGroups.data[].header | threat_connect.indicator.associated_groups.data[].header | Delivered-To: smithj@threatconnect.com Received: by… | |
| associatedGroups.data[].id | threat_connect.indicator.associated_groups.data[].id | 6 | |
| associatedGroups.data[].lastModified | threat_connect.indicator.associated_groups.data[].last_modified | 2021-10-21T19:54:59Z | |
| associatedGroups.data[].lastSeen | threat_connect.indicator.associated_groups.data[].last_seen | 2021-09-17T12:50:19Z | |
| associatedGroups.data[].legacyLink | threat_connect.indicator.associated_groups.data[].legacy_link | https://companyabc.threatconnect.com/auth/document/document.xhtml?document=10 | |
| associatedGroups.data[].malware | threat_connect.indicator.associated_groups.data[].malware | TRUE | |
| associatedGroups.data[].name | threat_connect.indicator.associated_groups.data[].name | Bad Incident | |
| associatedGroups.data[].ownerId | threat_connect.indicator.associated_groups.data[].owner.id | 1 | |
| associatedGroups.data[].ownerName | threat_connect.indicator.associated_groups.data[].owner.name | Demo Organization | |
| associatedGroups.data[].password | threat_connect.indicator.associated_groups.data[].password | duwyhfsjhsi | |
| associatedGroups.data[].publishDate | threat_connect.indicator.associated_groups.data[].publish_date | 2021-09-17T12:50:19Z | |
| associatedGroups.data[].reminderDate | threat_connect.indicator.associated_groups.data[].reminder_date | 2021-09-17T12:50:19Z | |
| associatedGroups.data[].scoreBreakdown | threat_connect.indicator.associated_groups.data[].score_breakdown | Rule SPF Neutral was matched against 'neutral'. | |
| associatedGroups.data[].scoreIncludesBody | threat_connect.indicator.associated_groups.data[].score_includes_body | TRUE | |
| associatedGroups.data[].status | threat_connect.indicator.associated_groups.data[].status | New | |
| associatedGroups.data[].subject | threat_connect.indicator.associated_groups.data[].subject | Your Amazon.com order for demo@sample.com | |
| associatedGroups.data[].to | threat_connect.indicator.associated_groups.data[].to | demo@sample.com | |
| associatedGroups.data[].type | threat_connect.indicator.associated_groups.data[].type | Incident | |
| associatedGroups.data[].upVote | threat_connect.indicator.associated_groups.data[].up_vote | FALSE | |
| associatedGroups.data[].upVoteCount | threat_connect.indicator.associated_groups.data[].up_vote_count | 0 | |
| associatedGroups.data[].webLink | threat_connect.indicator.associated_groups.data[].web_link | https://companyabc.threatconnect.com/#/details/groups/3/overview | |
| associatedGroups.data[].xid | threat_connect.indicator.associated_groups.data[].xid | a1a1a1a1-a1a1-a1a1-a1a1-a1a1a1a1a1a1 | |
| associatedGroups.generatedReport | TRUE | ||
| associatedIndicators.data[].active | threat_connect.indicator.associated_indicators.data[].active.value | TRUE | |
| associatedIndicators.data[].activeLocked | threat_connect.indicator.associated_indicators.data[].active.locked | FALSE | |
| associatedIndicators.data[].address | threat_connect.indicator.associated_indicators.data[].address | jelod40108@newnime.com | |
| associatedIndicators.data[].AS Number | threat_connect.indicator.associated_indicators.data[].as_number | ASN1234 | |
| associatedIndicators.data[].Block | threat_connect.indicator.associated_indicators.data[].block | 216.160.83.56/29 | |
| associatedIndicators.data[].confidence | threat_connect.indicator.associated_indicators.data[].confidence | 20 | |
| associatedIndicators.data[].dateAdded | threat_connect.indicator.associated_indicators.data[].date_added | 2021-11-02T13:07:08Z | |
| associatedIndicators.data[].description | threat_connect.indicator.associated_indicators.data[].description | A bad email address | |
| associatedIndicators.data[].dnsActive | threat_connect.indicator.associated_indicators.data[].dns_active | FALSE | |
| associatedIndicators.data[].externalDateAdded | threat_connect.indicator.associated_indicators.data[].external.date.added | 2023-10-04T12:34:56Z | |
| associatedIndicators.data[].externalDateExpires | threat_connect.indicator.associated_indicators.data[].external.date.expires | 2023-10-04T12:34:56Z | |
| associatedIndicators.data[].externalLastModified | threat_connect.indicator.associated_indicators.data[].external.last_modified | 2023-10-04T12:34:56Z | |
| associatedIndicators.data[].firstSeen | threat_connect.indicator.associated_indicators.data[].first_seen | 2023-10-04T12:34:56Z | |
| associatedIndicators.data[].Hashtag | threat_connect.indicator.associated_indicators.data[].hashtag | #testabc | |
| associatedIndicators.data[].hostName | threat_connect.indicator.associated_indicators.data[].host_name | samplehost.com | |
| associatedIndicators.data[].id | threat_connect.indicator.associated_indicators.data[].id | 10 | |
| associatedIndicators.data[].ip | threat_connect.indicator.associated_indicators.data[].ip | 175.16.199.22 | |
| associatedIndicators.data[].Key Name | threat_connect.indicator.associated_indicators.data[].key_name | HKEY_LOCAL_MACHINE\\SYSTEM\\Setup\\Status\\ChildCompletion | |
| associatedIndicators.data[].lastModified | threat_connect.indicator.associated_indicators.data[].last_modified | "2021-11-02T13:07:08Z" | |
| associatedIndicators.data[].lastSeen | threat_connect.indicator.associated_indicators.data[].last_seen | 2023-10-04T12:34:56Z | |
| associatedIndicators.data[].legacyLink | threat_connect.indicator.associated_indicators.data[].legacy_link | https://companyabc.threatconnect.com/auth/indicators/details/file.xhtml?file=F5A2496CF66CB8CFFE66CB1B27D7DEDE&owner=Demo+Organization | |
| associatedIndicators.data[].md5 | threat_connect.indicator.associated_indicators.data[].md5 | F5A2496CF66CB8CFFE66CB1B27D7DEDE | |
| associatedIndicators.data[].Mutex | threat_connect.indicator.associated_indicators.data[].mutex | Test.Mutex() | |
| associatedIndicators.data[].ownerId | threat_connect.indicator.associated_indicators.data[].owner.id | 1 | |
| associatedIndicators.data[].ownerName | threat_connect.indicator.associated_indicators.data[].owner.name | Demo Organization | |
| associatedIndicators.data[].privateFlag | threat_connect.indicator.associated_indicators.data[].private_flag | FALSE | |
| associatedIndicators.data[].rating | threat_connect.indicator.associated_indicators.data[].rating | 3 | |
| associatedIndicators.data[].sha1 | threat_connect.indicator.associated_indicators.data[].sha1 | 640AB2BAE07BEDC4C163F679A746F7AB7FB5D1FA | |
| associatedIndicators.data[].sha256 | threat_connect.indicator.associated_indicators.data[].sha256 | 7D5FFFBFE8D098E369466164F705B4D692517A2B4659A03901DAF67CF78553FB | |
| associatedIndicators.data[].size | threat_connect.indicator.associated_indicators.data[].size | 123 | |
| associatedIndicators.data[].Subject | threat_connect.indicator.associated_indicators.data[].subject | Spam | |
| associatedIndicators.data[].summary | threat_connect.indicator.associated_indicators.data[].summary | F5A2496CF66CB8CFFE66CB1B27D7DEDE | |
| associatedIndicators.data[].text | threat_connect.indicator.associated_indicators.data[].text | http://www.testingmcafeesites.com/testcat_pc.html | |
| associatedIndicators.data[].type | threat_connect.indicator.associated_indicators.data[].type | File | |
| associatedIndicators.data[].User Agent String | threat_connect.indicator.associated_indicators.data[].user_agent_string | PostmanRuntime/7.32.3 | |
| associatedIndicators.data[].Value Name | threat_connect.indicator.associated_indicators.data[].value.name | 0 | |
| associatedIndicators.data[].Value Type | threat_connect.indicator.associated_indicators.data[].value.type | REG_QWORD | |
| associatedIndicators.data[].webLink | threat_connect.indicator.associated_indicators.data[].web_link | https://companyabc.threatconnect.com/#/details/indicators/10/overview | |
| associatedIndicators.data[].whoisActive | threat_connect.indicator.associated_indicators.data[].whois_active | TRUE | |
| attributes.data[].createdBy.firstName | threat_connect.indicator.attributes.data[].created_by.first_name | John | |
| attributes.data[].createdBy.id | threat_connect.indicator.attributes.data[].created_by.id | 3 | |
| attributes.data[].createdBy.lastName | threat_connect.indicator.attributes.data[].created_by.last_name | Smith | |
| attributes.data[].createdBy.owner | threat_connect.indicator.attributes.data[].created_by.owner | Demo Organization | |
| attributes.data[].createdBy.pseudonym | threat_connect.indicator.attributes.data[].created_by.pseudonym | jsmith | |
| attributes.data[].createdBy.userName | threat_connect.indicator.attributes.data[].created_by.user_name | smithj@companyabc.com | |
| attributes.data[].dateAdded | threat_connect.indicator.attributes.data[].dateAdded | 2021-11-09T13:32:37Z | |
| attributes.data[].default | threat_connect.indicator.attributes.data[].default | FALSE | |
| attributes.data[].id | threat_connect.indicator.attributes.data[].id | 10 | |
| attributes.data[].lastModified | threat_connect.indicator.attributes.data[].last_modified | 2021-11-09T13:32:37Z | |
| attributes.data[].pinned | threat_connect.indicator.attributes.data[].pinned | FALSE | |
| attributes.data[].source | threat_connect.indicator.attributes.data[].source | Phase of Intrusion | |
| attributes.data[].type | threat_connect.indicator.attributes.data[].type | Additional Analysis and Context | |
| attributes.data[].value | threat_connect.indicator.attributes.data[].value | Host used by hacker conglomerate traced to Iran. | |
| Block | threat_connect.indicator.block | 216.160.83.56/29 | |
| confidence | threat_connect.indicator.confidence | 20 | |
| customAssociations | threat_connect.indicator.custom_associations | {"data": [{"id": 12345,"dateAdded": "2018-09-18T17:46:56Z","ownerId": 5,"ownerName": "Demo Organization","webLink": "https://companyabc.threatconnect.com/#/details/indicators/12345","type": "Address","lastModified": "2024-01-18T15:27:41Z","summary": "209.15.13.134","privateFlag": false,"active": true,"activeLocked": false,"ip": "209.15.13.134","legacyLink": "https://companyabc.threatconnect.com/auth/indicators/details/address.xhtml?address=209.15.13.134&owner=Demo+Organization"}]} | |
| dateAdded | threat_connect.indicator.date_added | 2021-11-02T13:07:08Z | |
| description | threat.indicator.description | threat_connect.indicator.description | A bad email address |
| dnsActive | threat_connect.indicator.dns_active | FALSE | |
| dnsResolution | threat_connect.indicator.dns_resolution | {"data": [{"addresses": {"data": [{"id": 9962038,"ip": "162.55.172.212","geoLocation": {"country": "Germany","countryCode": "DE","state": "Rheinland-Pfalz","timezone": "Europe/Berlin","city": "Mammelzen","asn": 24940,"registeringOrg": "Hetzner Online GmbH","lat": 50.7,"lon": 7.6661}}],"count": 0},"dateOccurred": "2023-07-06T14:08:31Z"}],"count": 0} | |
| enrichment | threat_connect.indicator.enrichment | {"data": [{"type": "VirusTotal","vtMaliciousCount": 14}]} | |
| externalDateAdded | threat_connect.indicator.external.date.added | 2023-10-04T12:34:56Z | |
| externalDateExpires | threat_connect.indicator.external.date.expires | 2023-10-04T12:34:56Z | |
| externalLastModified | threat.indicator.modified_at | threat_connect.indicator.external_last.modified | 2023-10-04T12:34:56Z |
| falsePositiveReportedByUser | threat_connect.indicator.false_positive_reported_by_user | FALSE | |
| falsePositives | threat_connect.indicator.false_positives | 1 | |
| fileActions | threat_connect.indicator.file_actions | {"data": [{"relationship": "File DNS Query","indicator": {"id": 54321,"dateAdded": "2018-09-18T17:46:56Z","ownerId": 5,"ownerName": "Demo Organization","webLink": "https://companyabc.threatconnect.com/#/details/indicators/54321","type": "Host","lastModified": "2024-05-09T18:48:34Z","rating": 0.00,"confidence": 0,"source": "Host used by hacker conglomerate traced to China.","description": "Malicious actor with ties to hacker networks.","summary": "badguy.com","privateFlag": false,"active": false,"activeLocked": false,"fileActions": {"count": 0},"hostName": "badguy.com","dnsActive": true,"whoisActive": true,"legacyLink": "https://companyabc.threatconnect.com/auth/indicators/details/host.xhtml?host=badguy.com&owner=Demo+Organization"}}],"count": 1} | |
| fileOccurrences | threat_connect.indicator.file_occurrences | {"data": [{"fileName": "win999301.dll","path": "C:\\\\Windows\\System","date": "2022-06-14T10:00:00Z"}]} | |
| firstSeen | threat.indicator.first_seen | threat_connect.indicator.first_seen | 2023-10-04T12:34:56Z |
| genericCustomIndicatorValues | threat_connect.indicator.generic_custom_indicator_values | HKEY_CURRENT_USER\\Software\\MyApp | |
| geoLocation | threat_connect.indicator.geo_location | {"country": "Germany","countryCode": "DE","state": "Land Berlin","timezone": "Europe/Berlin","city": "Berlin","asn": 24940,"registeringOrg": "Hetzner Online GmbH","lat": 52.5203,"lon": 13.3849} | |
| Hashtag | threat_connect.indicator.hashtag | #testabc | |
| hostName | observer.hostname | threat_connect.indicator.host_name | samplehost.com |
| id | threat_connect.indicator.id | 10 | |
| investigationLinks | threat_connect.indicator.investigation_links | {"data": [{"name": "#totalhash","path": "https://totalhash.cymru.com/search/?ip:49.13.76.144"}]} | |
| ip | threat.indicator.ip | threat_connect.indicator.ip | 175.16.199.22 |
| Key Name | threat.indicator.registry.path | threat_connect.indicator.key_name | HKEY_LOCAL_MACHINE\\SYSTEM\\Setup\\Status\\ChildCompletion |
| lastFalsePositive | threat_connect.indicator.last_false_positive | 2023-10-04T12:34:56Z | |
| lastModified | @timestamp | threat_connect.indicator.last_modified | "2021-11-02T13:07:08Z" |
| lastSeen | threat.indicator.last_seen | threat_connect.indicator.last_seen | 2023-10-04T12:34:56Z |
| legacyLink | threat.indicator.reference | threat_connect.indicator.legacy_link | https://companyabc.threatconnect.com/auth/indicators/details/file.xhtml?file=F5A2496CF66CB8CFFE66CB1B27D7DEDE&owner=Demo+Organization |
| md5 | threat.indicator.file.hash.md5 | threat_connect.indicator.md5 | F5A2496CF66CB8CFFE66CB1B27D7DEDE |
| Mutex | threat_connect.indicator.mutex | Test.Mutex() | |
| observations | threat_connect.indicator.observations | 2 | |
| ownerId | threat_connect.indicator.owner.id | 1 | |
| ownerName | threat_connect.indicator.owner.name | Demo Organization | |
| privateFlag | threat_connect.indicator.private_flag | FALSE | |
| rating | threat_connect.indicator.rating | 3 | |
| securityLabels.data[].color | threat_connect.indicator.security_labels.data[].color | FFFFFF | |
| securityLabels.data[].dateAdded | threat_connect.indicator.security_labels.data[].date_added | 2016-08-31T00:00:00Z | |
| securityLabels.data[].description | threat_connect.indicator.security_labels.data[].description | This Security Label is used for information that carries minimal risk | |
| securityLabels.data[].id | threat_connect.indicator.security_labels.data[].id | 1 | |
| securityLabels.data[].name | threat_connect.indicator.security_labels.data[].name | TLP:WHITE | |
| securityLabels.data[].owner | threat_connect.indicator.security_labels.data[].owner | System | |
| sha1 | threat.indicator.file.hash.sha1 | threat_connect.indicator.sha1 | 640AB2BAE07BEDC4C163F679A746F7AB7FB5D1FA |
| sha256 | threat.indicator.file.hash.sha256 | threat_connect.indicator.sha256 | 7D5FFFBFE8D098E369466164F705B4D692517A2B4659A03901DAF67CF78553FB |
| size | threat.indicator.file.size | threat_connect.indicator.size | 123 |
| source | threat_connect.indicator.source | https://fp.tools/api/v4/indicators/attribute/pN0psYjPUQ6a_sxPSW5XjQ | |
| Subject | email.subject | threat_connect.indicator.subject | Spam |
| summary | event.id | threat_connect.indicator.summary | F5A2496CF66CB8CFFE66CB1B27D7DEDE |
| tags.data[].description | threat_connect.indicator.tags.data[].description | Apply this Tag to objects related to ransomware attacks | |
| tags.data[].id | threat_connect.indicator.tags.data[].id | 1 | |
| tags.data[].lastUsed | threat_connect.indicator.tags.data[].last_used | 2023-08-25T13:15:30Z | |
| tags.data[].name | threat_connect.indicator.tags.data[].name | user execution: malicious link | |
| tags.data[].owner | threat_connect.indicator.tags.data[].owner | Demo Organization | |
| tags.data[].platforms.count | threat_connect.indicator.tags.data[].platforms.count | 1 | |
| tags.data[].platforms.data | threat_connect.indicator.tags.data[].platforms.data | ["Windows"] | |
| tags.data[].techniqueId | threat_connect.indicator.tags.data[].technique.id | T1055.005 | |
| text | threat.indicator.url.original | threat_connect.indicator.text | http://www.testingmcafeesites.com/testcat_pc.html |
| threatAssessConfidence | threat_connect.indicator.threat_assess.confidence | 58.1 | |
| threatAssessRating | threat_connect.indicator.threat_assess.rating | 4.5 | |
| threatAssessScore | threat_connect.indicator.threat_assess.score.value | 678 | |
| threatAssessScoreFalsePositive | threat_connect.indicator.threat_assess.score.false_positive | 0 | |
| threatAssessScoreObserved | threat_connect.indicator.threat_assess.score.observed | 139 | |
| trackedUsers | threat_connect.indicator.tracked_users | {"jsmith API": {"observations": 0,"falsePositives": 0}} | |
| type | threat.indicator.type | threat_connect.indicator.type | File |
| User Agent String | user_agent.original | threat_connect.indicator.user_agent_string | PostmanRuntime/7.32.3 |
| Value Name | threat.indicator.registry.value | threat_connect.indicator.value.name | 0 |
| Value Type | threat.indicator.registry.data[].type | threat_connect.indicator.value.type | REG_QWORD |
| webLink | threat.indicator.reference | threat_connect.indicator.web_link | https://companyabc.threatconnect.com/#/details/indicators/10/overview |
| whoIs | threat_connect.indicator.who_is | {"data": [{"fullRecord": "Domain Name: ZEVERCO.COM\n Registry...","registrant": "Dynadot Inc","created": "2024-01-30T00:00:00Z","updated": "2024-01-30T00:00:00Z","expires": "2025-01-30T00:00:00Z","contacts": [{"type": "Registrant","name": "REDACTED FOR PRIVACY","organization": "Super Privacy Service LTD c/o Dynadot","street1": "PO Box 701","city": "San Mateo","state": "California","postalCode": "94401","country": "UNITED STATES","phone": "16505854708"}]}],"count": 0} | |
| whoisActive | threat_connect.indicator.whois_active | TRUE | |
| event.kind | event | ||
| event.category | threat | ||
| event.type | indicator |
Frequently Asked Questions (FAQ)
When the Elastic Security ThreatConnect integration runs, it returns an “Allow Users to Exceed API Link Limit” HTTP 401 error. What does this error mean, and how do I fix it?
The “Allow Users to Exceed API Link Limit” HTTP 401 error occurs when ThreatConnect attempts to return a results set that exceeds your ThreatConnect instance’s API link limit—that is, the maximum number of items allowed to be read at one time via the v3 API. This limit is determined in the system settings for your ThreatConnect instance. It is 1000 by default, although your System Administrator may have set a different value. To resolve this issue, edit the API user account that the Elastic Security ThreatConnect integration is configured for and select the Allow User to Exceed API Link Limit checkbox. This setting will override your instance’s API link limit for the API user account, allowing that account to read an unlimited number of API links.
How do I debug the Elastic Security ThreatConnect integration if it is not working as expected?
See the “Integration Troubleshooting” section for instructions on how to troubleshoot issues with the Elastic Security ThreatConnect integration.
I receive an error message from the log data when I inspect them with Kibana Discover. What should I do?
The following is the most common error message that occurs in the Elastic Security ThreatConnect integration:
"error.message": [
    "failed eval: internal error: runtime error: invalid memory address or nil pointer dereference",
    "Processor json with tag json_event_original in pipeline logs-ti_threatconnect.indicator-0.2.0 failed with message: field [original] not present as part of path [event.original]"
]This is a generic error that usually signifies a configuration or connection failure between Elastic Security and ThreatConnect. If you encounter this error, verify there are no issues with the values entered for following integration configuration parameters:
- URL: Ensure /api is not included in the URL.
- ThreatConnect Access ID: Check for extraneous characters (e.g., letters, special characters), as the API user’s Access ID should contain only numbers.
- Secret Key: If using Elastic Stack version 8.13.4 or older, ensure that the ThreatConnect API user’s Secret Key does not contain the $ character.
If you confirm that there are no issues with the values entered for these parameters, see the “Integration Troubleshooting” section to further troubleshoot the integration.
I do not see data on the built-in Kibana dashboard or in Kibana Discover. What should I do?
Change the time range from the default value of Last 15 minutes to the value entered for the integration’s Initial Interval parameter. Alternatively, set the time range to Last 90 days to quickly validate whether Elastic Security is ingesting ThreatConnect data.
If you update the time range and data are still not displayed, see the “Integration Troubleshooting” section to further troubleshoot the integration.
The value of the ThreatConnect integration’s Initial Interval parameter was too small and Elastic Security did not ingest some ThreatConnect data. What should I do?
Delete the ThreatConnect integration and then redeploy it with a larger value for the Initial Interval parameter. At this time, there is no way to reset the initial interval date for the integration.
How can I verify data integrity between ThreatConnect and Elastic Security?
To verify that the data being sent from ThreatConnect and the data being ingested by Elastic Security match, follow these steps:
- Confirm that the Enable request tracing toggle is turned on for the ThreatConnect integration and the integration has run.
- Collect the agent logs for the integration, as described in the “Integration Troubleshooting” section.
- Locate the outgoing API request in the logs, and then copy the value assigned to the
tqlquery parameter in the request URL. - Decode the value (i.e., TQL query) copied in Step 3 with a URL decoder.
- In ThreatConnect, navigate to the Search: Indicators screen and run an advanced search by turning on the Advanced Search toggle.
- Enter the decoded TQL query into the search bar, and append
AND indicatorActive = trueto the query. Then run the query and view the Indicators being sent to Elastic Security. Make note of the number of Indicators that the query returned. - In Kibana, open the main menu and navigate to Management > Stack Management > Index Management > Indices. Then select the permanent index (logs-ti_threatconnect_latest.dest_indicator-1 if using version 1.0.0; logs-ti_threatconnect_latest.dest_indicator-2 if using version 1.0.1 or newer).
- Compare the value in the Docs count column for the permanent index with the number of Indicators returned on the Search: Indicators screen in ThreatConnect and confirm that they match.
Should I add more than one instance of the ThreatConnect integration to an agent policy?
It is recommended that an agent policy have an equal number of Elastic Agents per integration instance. Otherwise, there may be issues with bandwidth on the Elastic Stack. This limitation can also be overcome by having a large Elastic Agent.
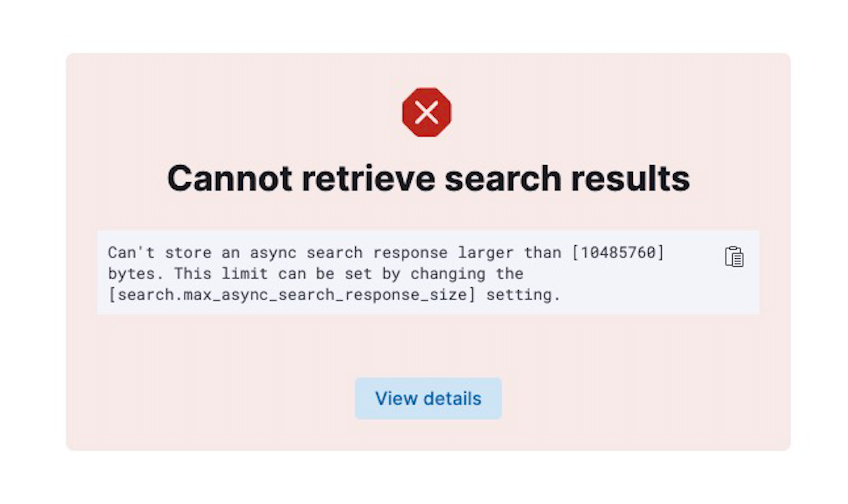
Why am I receiving a “Cannot retrieve search results” error when viewing records in Kibana Discover, and how can I resolve this issue?
The “Cannot retrieve search results” error (Figure 20) occurs when the size of a response from ThreatConnect is larger than 10 megabytes. Changing the time range can exclude some of the larger records for a certain time interval as a temporary fix. You can also change the max_async_search_response_size via an API call to the Elastic Cluster.
ThreatConnect® is a registered trademark of ThreatConnect, Inc.
Elastic®, Filebeat®, and Kibana® are registered trademarks of Elasticsearch BV.
JavaScript® is a registered trademark of Oracle Corporation.
30085-04 EN Rev. A