Once an App has been built successfully, you can debug and test it via the Live Debug function. Toggle the Live Debug slider at the top right of the App Builder screen on to activate the live debugger (Figure 1).
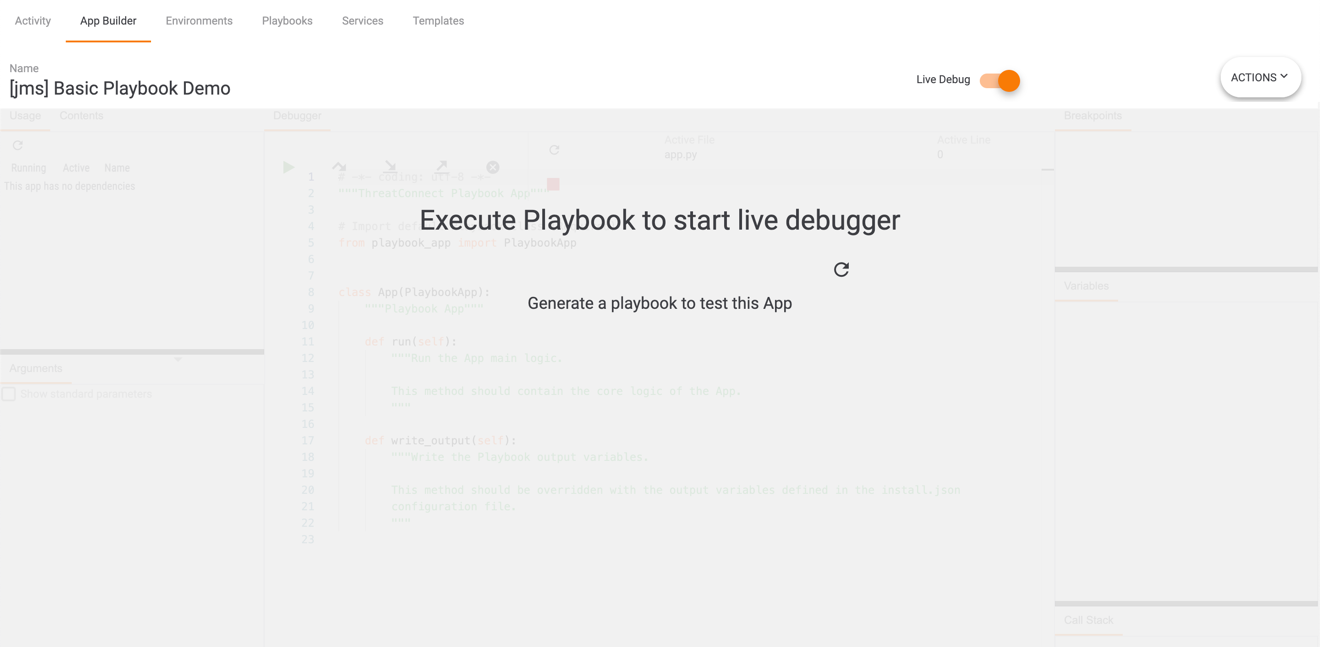
A successful build is required for the live debugger to work. If the App has not been built successfully, the Live Debug slider will be disabled and a message stating “Build required for pending changes” will be displayed when you hover over the slider.
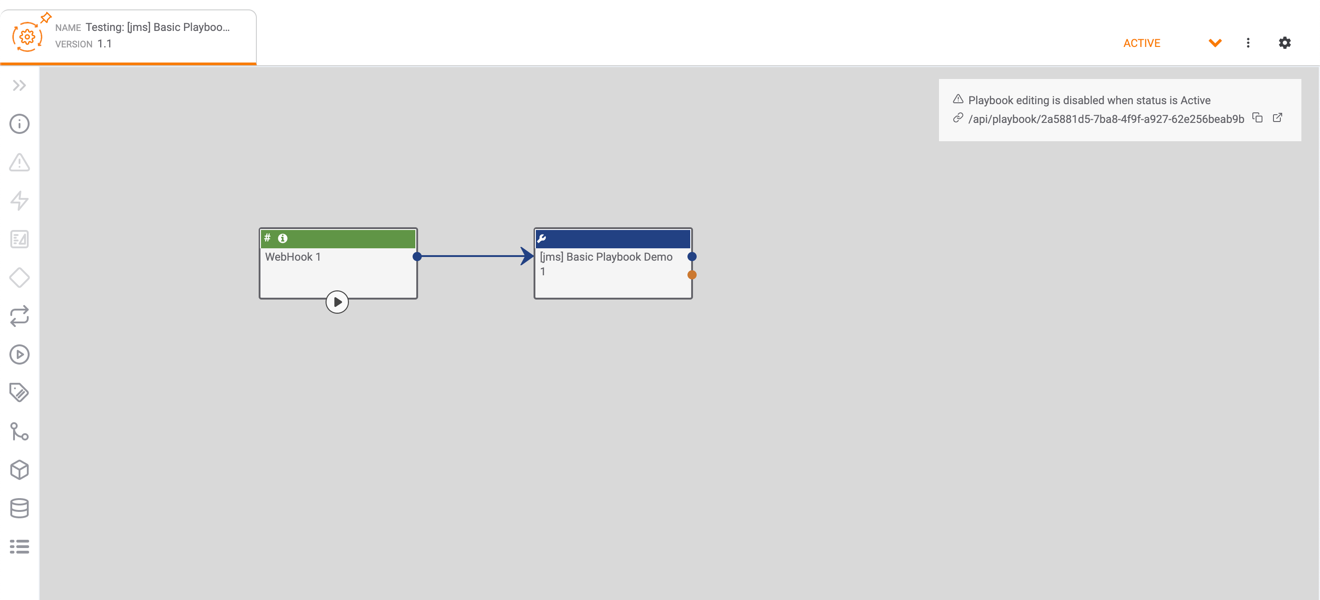
In order to test an App, a Playbook that uses the App must be created. Click the Generate a playbook to test this App text (Figure 1). A new tab will open with a test Playbook in the Playbook Designer (Figure 2).
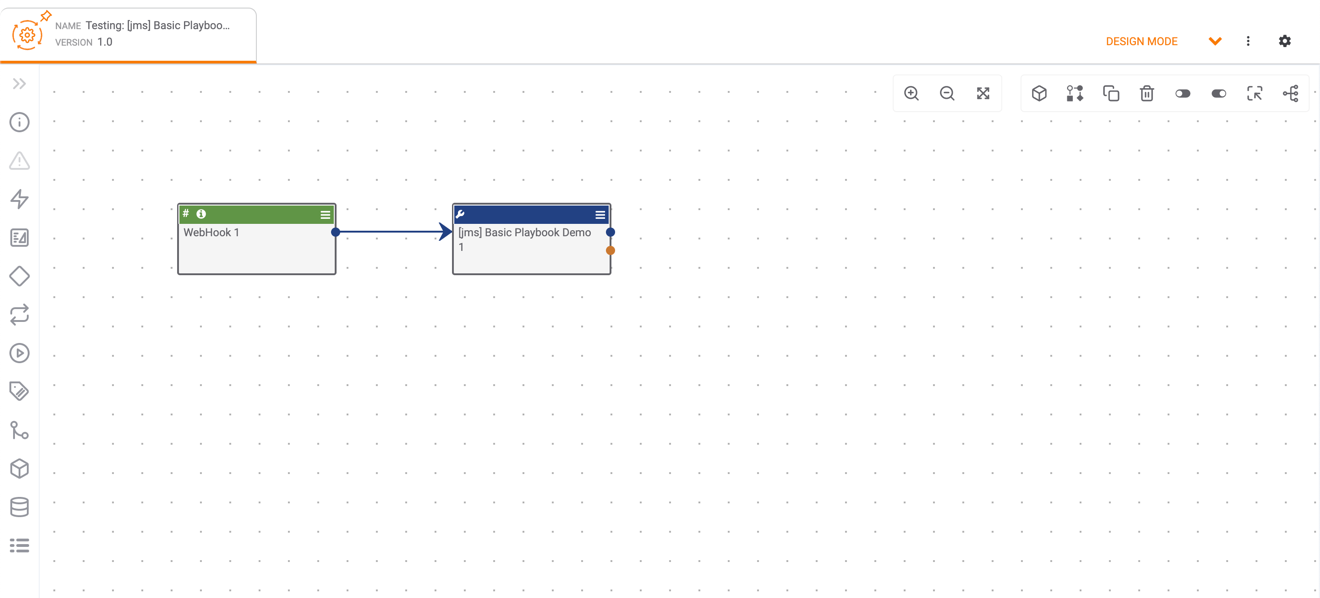
The test Playbook connects the new App to a WebHook Trigger. Other Triggers, Apps, and Operators may be added as well. The Edit App pane allows you to view and test the input parameters that were created on the App Builder screen. The wrench  icon at the upper-left corner of the App indicates that the App is in development.
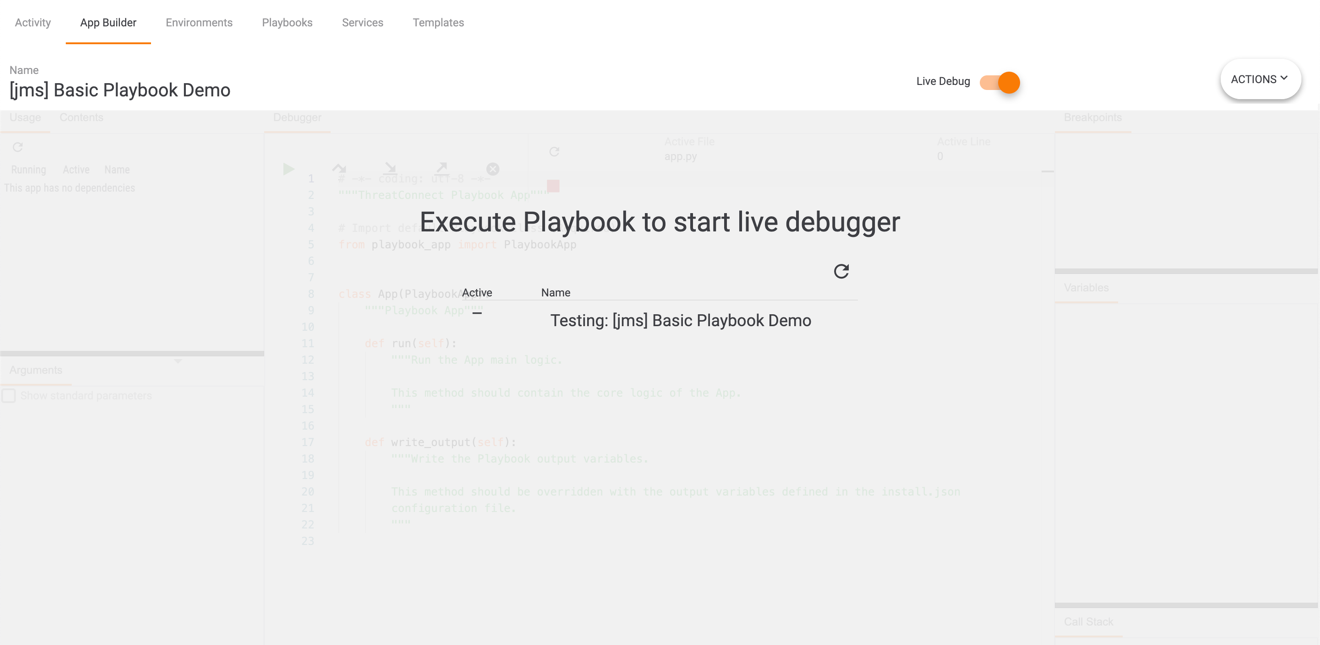
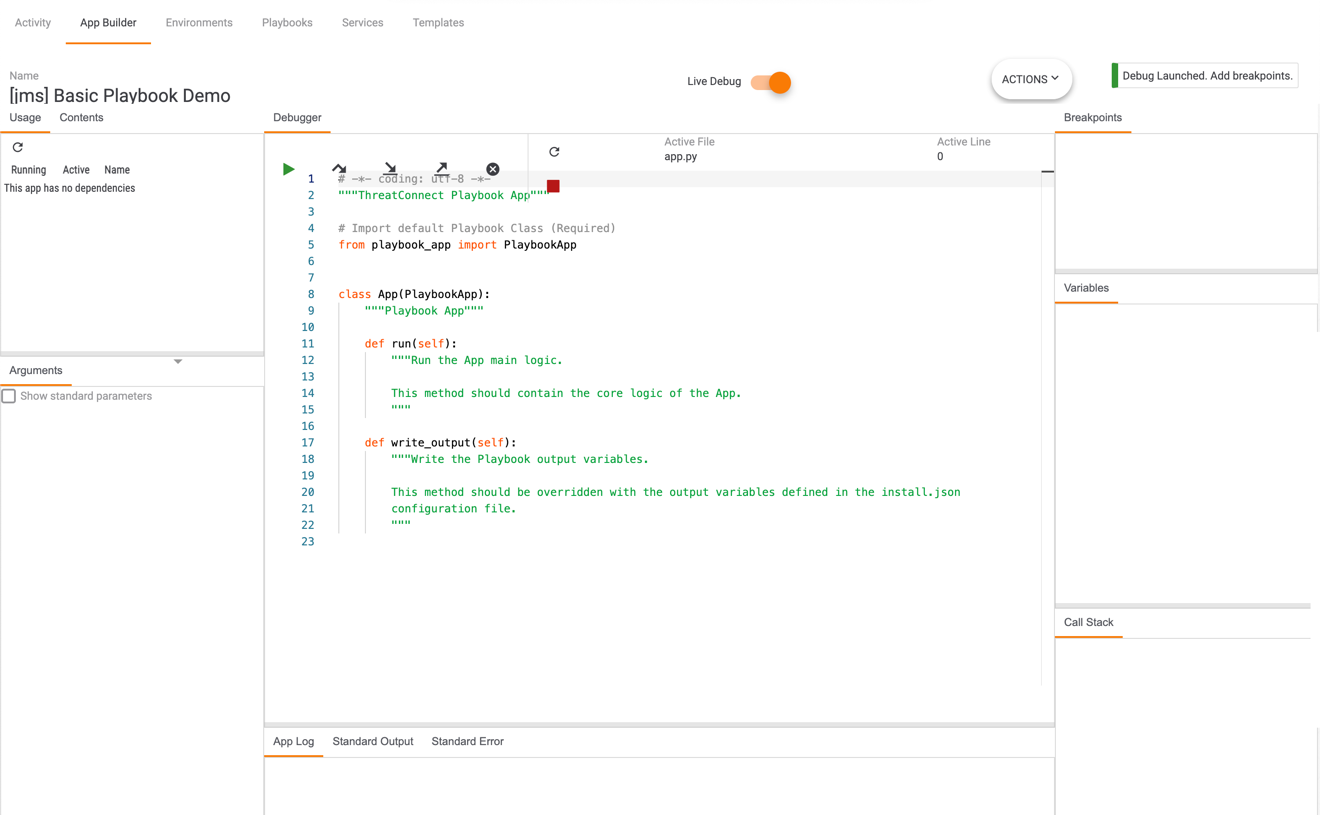
Once the test Playbook is created, it will continue to exist, even if you close its browser tab or log out of ThreatConnect. Once you return to the App in the App Builder or toggle the Live Debug slider on again, the App Builder screen will provide a link to the test Playbook, as well as information on whether the Playbook is active or not (Figure 3). Click Refresh  to refresh the listing—for example, to show a change in status (active or inactive) or to display any new Playbooks that were created using the project.
As demonstrated in Figure 2, the test Playbook can be used to view the App in order to verify the input parameters and the output variables. Enter information into the input parameters so that a test run of the App will have the required information for the App to work.
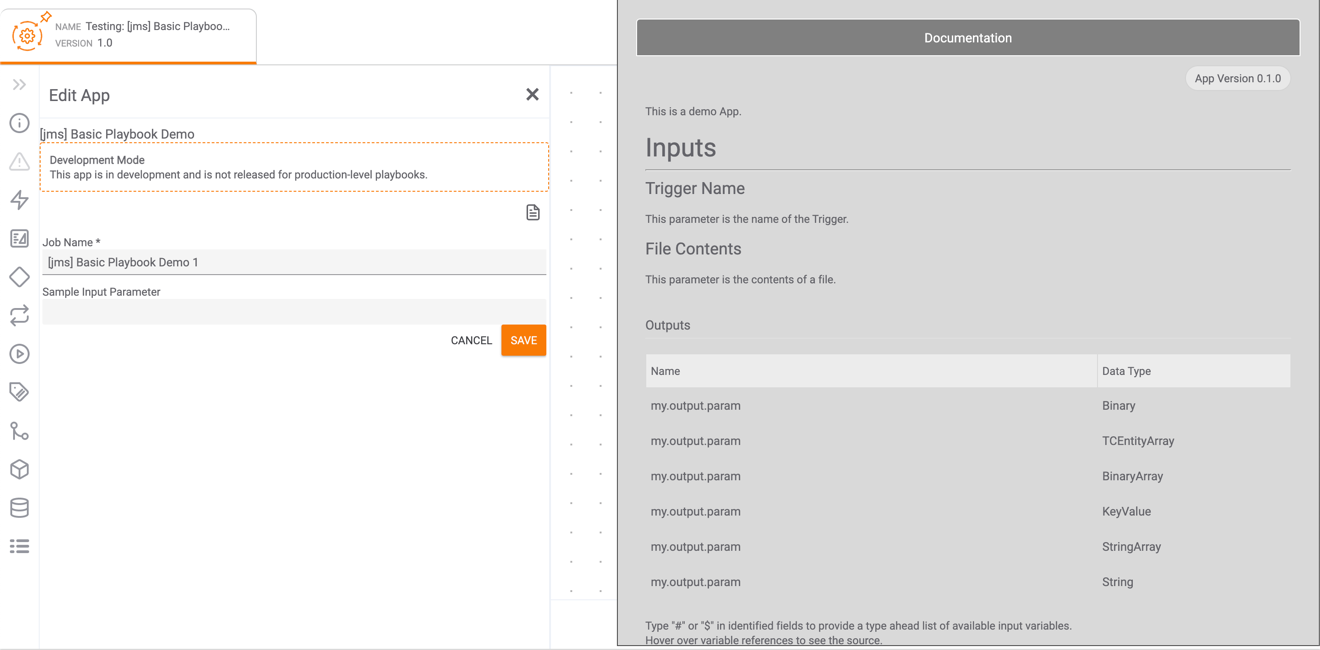
To view the App note entered in the Metadata tab, as well as the output variables and the current version of the App, double-click the App in the design pane to display the Edit App pane, and then click Display Documentation  (Figure 4).
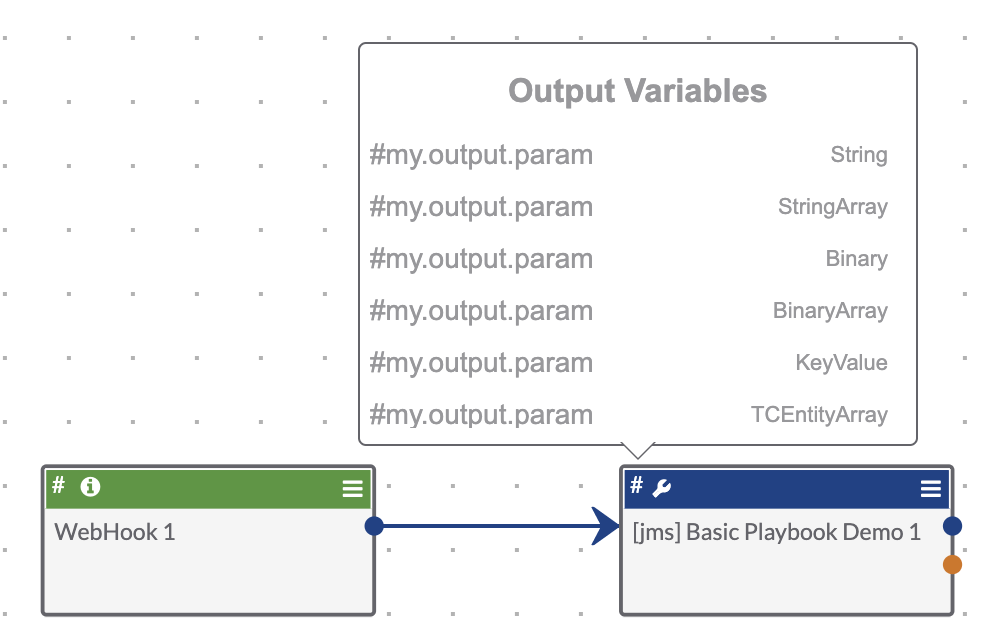
You can also view a list of output variables by hovering the cursor over the hashtag (#) at the upper-left corner of the App in the design pane (Figure 5).
To begin the debugging process, the test Playbook must be active. Hover over the Mode dropdown menu in the upper-right corner of the Playbook Designer (Figure 2) and select Active. The Playbook will switch from Design Mode to Active (Figure 6).
If further information or changes are required in order to activate the Playbook, a message stating “Fix validation errors to enable activation” will be displayed when hovering over the Mode dropdown, and the Active option will be disabled. To view more details about the validation errors in the Playbook, click the red Validations  icon in the side navigation bar of the Playbook Designer.
To execute the Playbook for debugging and testing, click Execute Endpoint  in the box displayed at the upper-left corner of the Playbook Designer (Figure 6) while the Playbook is active.
Return to the browser tab with the App Builder screen, which will now display tabs that correspond to debugging functions (Figure 7).
Debug Mode
When in debug mode, the Code Editor becomes the Debugger tab. Use the icons at the top of the tab to orchestrate the debugging process:
- Continue
 : Click this icon to instruct the debugger to continue the debugging process, stopping only when a breakpoint is encountered or the program exits.
 - Step Over
 : Click this icon to instruct the debugger to continue execution until the next line in the current function is reached or it returns.
 - Step Into
 : Click this icon to instruct the debugger to execute the current line, stopping at the first possible occasion.
 - Step Out
 : Click this icon to instruct the debugger to continue execution until the current function returns.
 - Clear Breakpoints
 : Click this icon to instruct the debugger to clear all breakpoints in the current session.
 - Update Global Variables
 : Click this icon to instruct the debugger to update all global variables for the App.
 - End and Exit
 : Click this icon to instruct the debugger to end the debugging session and exit the program.
In addition to the Debugger tab, the App Builder screen displays a number of other tabs that provide information that can be used for debugging the App:
- Usage: This tab provides information on test Playbooks that use the App, including whether each Playbook is running and active.
- Contents: This tab is the same Contents tab on the App Builder screen when live debugging is turned off.
- Arguments: Select the Show standard parameters checkbox to display a list of all of the standard parameters associated with an App and their values for the test execution of the Playbook. Standard parameters are a fixed set of parameters passed to all Apps and used by the software developer’s kit (SDK) to perform various low-level functions. They are available in this tab for troubleshooting, but are hidden by default.
- Secure Params: Click the Additional Tabs
 icon displayed to the right of the Arguments tab and select Secure Params to switch to the Secure Params tab, which will list the arguments not passed during command-line execution, but retrieved securely in memory once the App is executing. Select the Show standard parameters checkbox to display a list of the parameters and their values for the test execution of the Playbook. To return to the Arguments tab, click Additional Tabs
 again and select Arguments.
 - Breakpoints: This tab displays a list of all the breakpoints in the debugging session, including the line number and file name. Breakpoints can be added at any executable line of code (i.e., not comments or empty lines). Toggle breakpoints by clicking on the gutter to the left of the line numbers for the code displayed in the Debugger tab. When a breakpoint is toggled on, a breakpoint
 icon will be displayed to the left of the line number for the code, and the breakpoint will be added to the list in the Breakpoints tab. Click on the breakpoint
 icon to remove it.
 - Variables: This tab lists values for all variables in the current execution.
- Call Stack: This tab displays the program call stack for the line that is currently executing.
- App Log: This tab displays a log for the execution of the App.
- Standard Output: This tab displays the values of the output variables.
- Standard Error: This tab provides information about the errors that occurred during the execution.
ThreatConnect® is a registered trademark of ThreatConnect, Inc.
20084-17 v.07.B