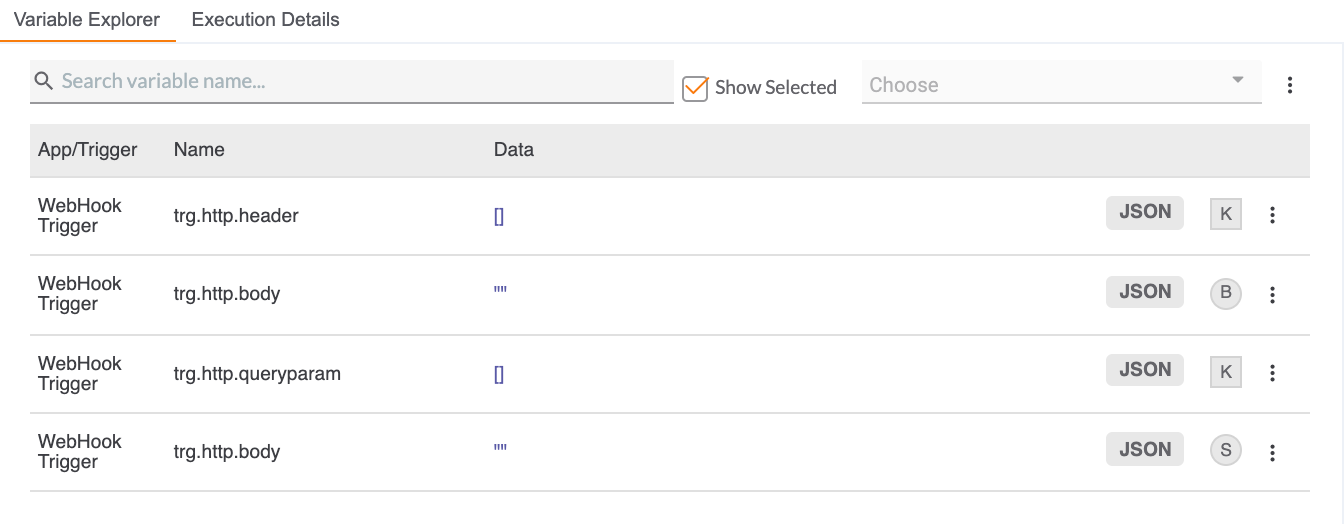
The Variable Explorer tab in Interactive Mode allows you to observe the state of each Trigger, App, and Component in the Playbook as a self-contained element (Figure 1).
 Search variable name…: Enter a variable name in the search field to quickly narrow down the viewable list to the desired variable.
- Show Selected: Select the Show Selected checkbox to display variable data on the selected element immediately after execution. Selecting this option before executing an element ensures that the data are shown immediately without the need to refresh the Playbook Designer screen.
- Choose: This dropdown menu allows you to select multiple elements to view concurrently in the Variable Explorer.NoteChoose is not an available option if the Show Selected checkbox is selected.
- App/Trigger: This column displays the name of the element being observed or has a value of Global for all global variables.
- Name: This column displays the name of each output variable for the element.
- Data: This column is an interactive field that displays the data stored in the variable. Clicking the data will display a pane with further details on the variable data, including the type and JSON information. If “”or [] is displayed in the column, there are no data available for the variable.
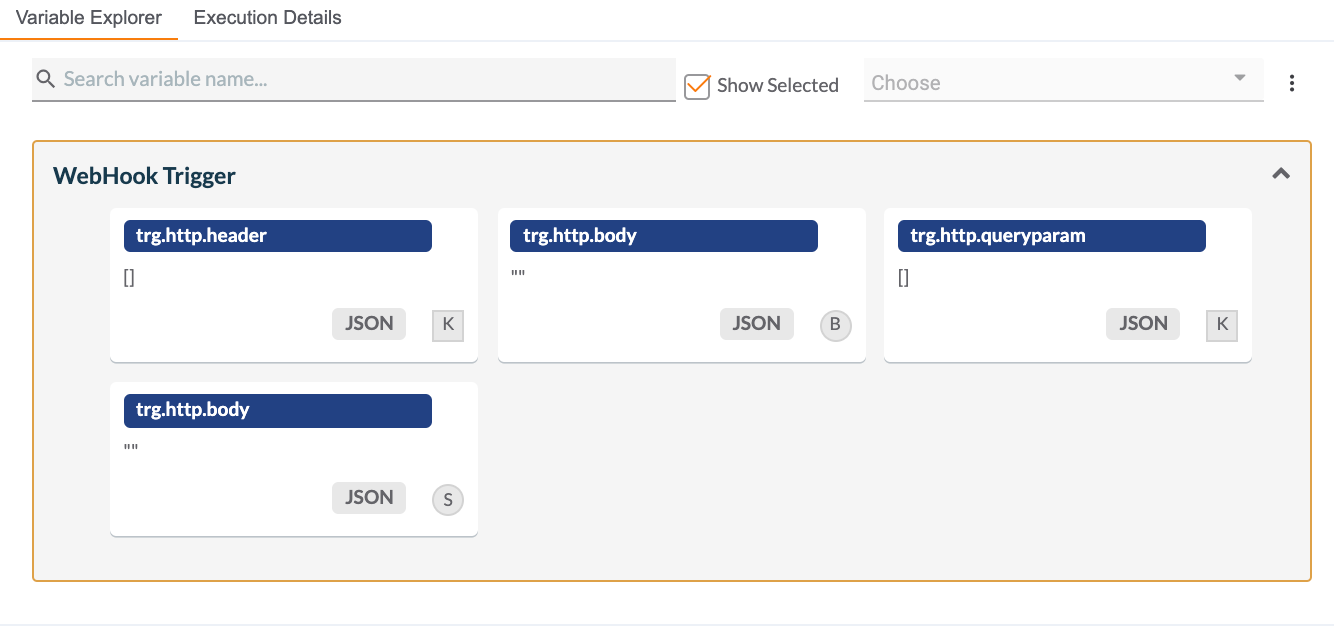
- Table/Grid View Toggle: Click the vertical ellipsis
 icon at the upper right of the Variable Explorer (Figure 2) to toggle between Table View (Figure 1) and Grid View (Figure 3).

ThreatConnect® is a registered trademark of ThreatConnect, Inc.
20110-30 v.02.B