- Follow the steps in Creating a Component to create and activate a Component. Inactive Components cannot be added to Playbooks.
- Create a new Playbook or open an existing Playbook. If the Playbook is Active, hover over the Mode dropdown at the upper-right corner of the Playbook Designer screen, and select Design Mode.
- Click
 Apps on the side navigation bar of the Playbook Designer screen. All active Components will be listed in the Components section (Figure 1).
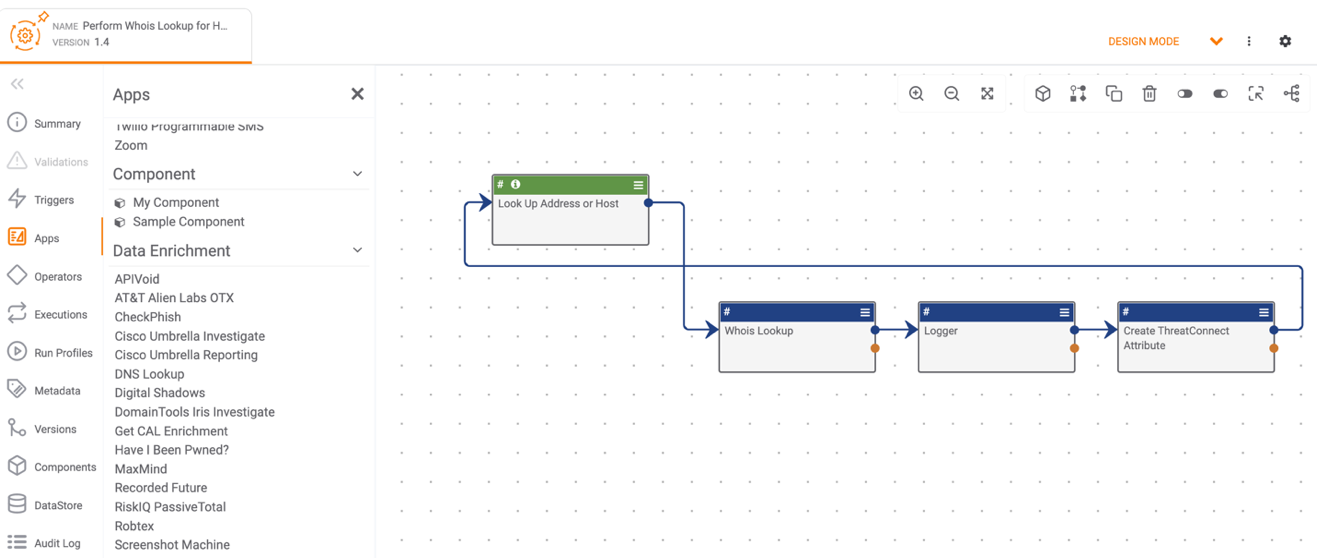
- Select a Component to add to the Playbook Designer.
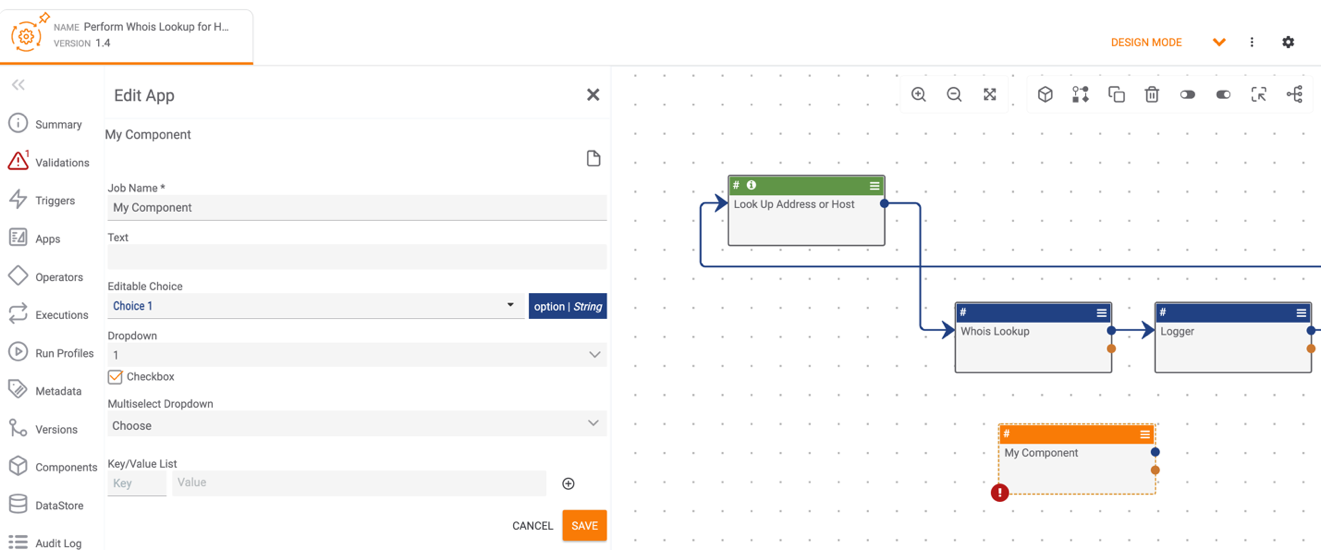
- Double-click the Component App. The Edit App pane will be displayed on the left side of the Playbook Designer screen. The example in Figure 2 demonstrates all UI Elements that may be selected when configuring the Component.
- Click Display Documentation
 to view a description of the Component and information about variables (Figure 3).
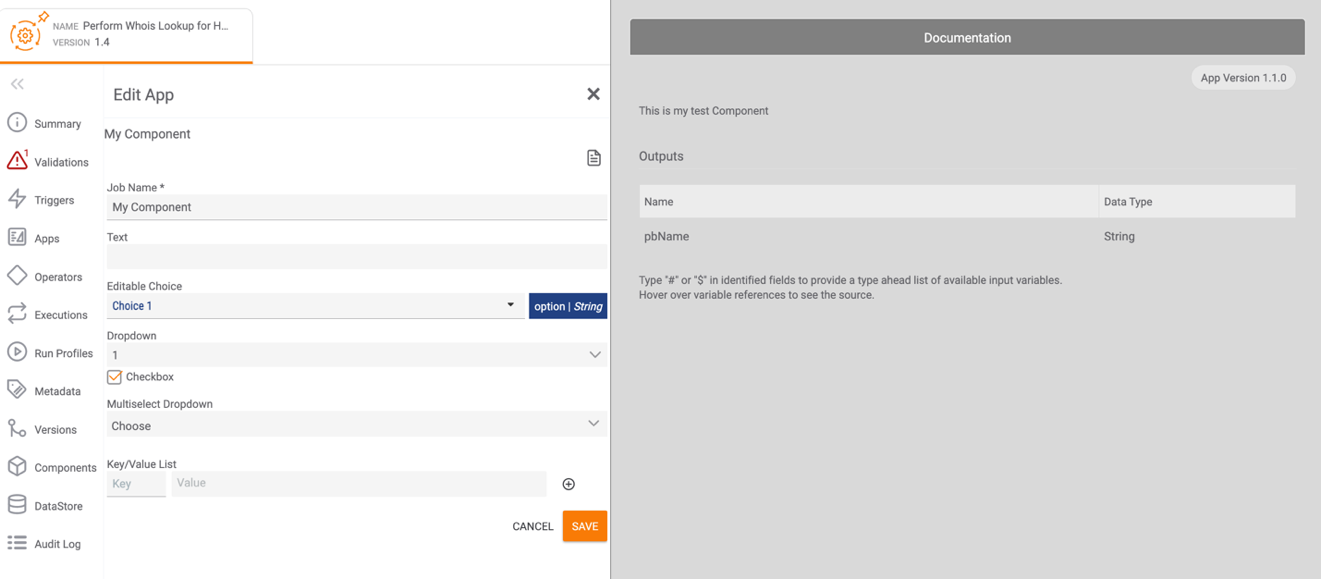
- Enter values for all Component parameters, and then click the SAVE button. Make sure to connect the Component App to at least one of the other elements in the Playbook.
- Click the menu
 at the upper-right corner of the Component to edit the Component, view the Component in a new tab in the Playbook Designer, set or change the log level for the Component, disable the Component, clone (copy) the Component, or delete the Component (Figure 4).
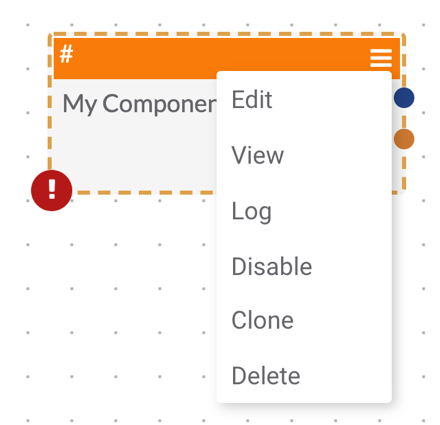
- Selecting Log in Figure 4 will cause the window in Figure 5 to be displayed.
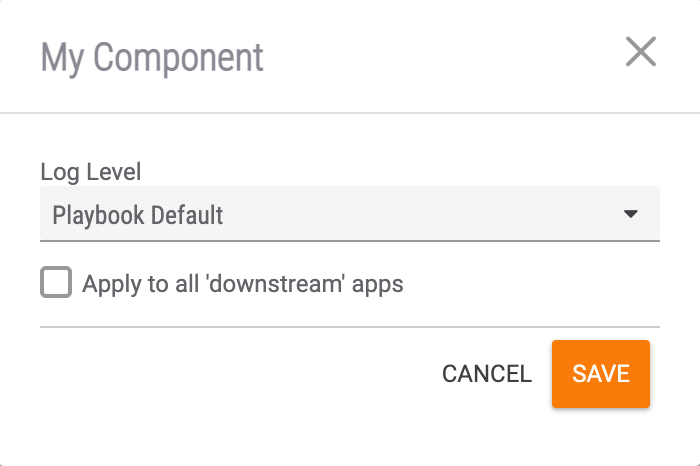
- Log Level: Select the log level for the Component. By default, the log level for the Component is set to Playbook Default (the default log level set for the Playbook). Other log levels include ERROR, WARN, INFO, DEBUG, and TRACE. See the “Log Level” section of Settings for more information about each log level.
- Apply to all ‘downstream’ apps: Select this checkbox to set the same log level for all downstream Apps.
- Click the SAVE button.
- If a log level other than Playbook Default is set for a Component, the Log Level
 icon will be displayed in the lower-right corner of the Component. Hover over this icon to display the Component’s log level (Figure 6).
 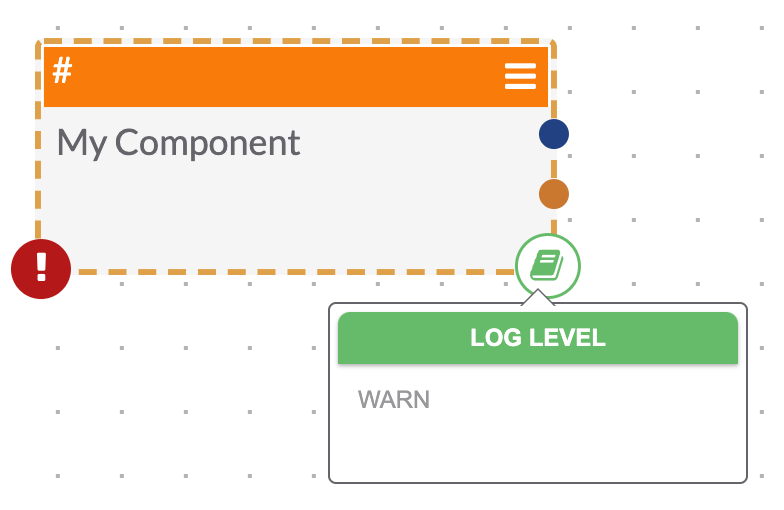 NoteWhen setting or changing the log level, if the Apply to all 'downstream' apps checkbox is selected, the Log Level icon will be displayed at the lower-right corner of all downstream Apps, indicating that the log level is the same for all of the Apps with the icon.
ThreatConnect® is a registered trademark of ThreatConnect, Inc.
20069-05 v.08.B