MTTD
- 24 Aug 2022
- 2 Minutes to read
-
Print
-
DarkLight
MTTD
- Updated on 24 Aug 2022
- 2 Minutes to read
-
Print
-
DarkLight
Article Summary
Share feedback
Thanks for sharing your feedback!
MTTD provides a graphical representation of the average amount of time it took to detect a security issue or event, which is measured by calculating the average amount of time between the Time of Occurrence and Time of Detection for Cases, over a specified period of time broken down by days, weeks, or months.
- Select MTTD on the Details step of the Add New Card drawer to display the Query step (Figure 1).ImportantYou must record Time of Occurrence and Time of Detection for at least one Case in your Organization in order for MTTD to be displayed on the Details step of the Add New Card drawer.
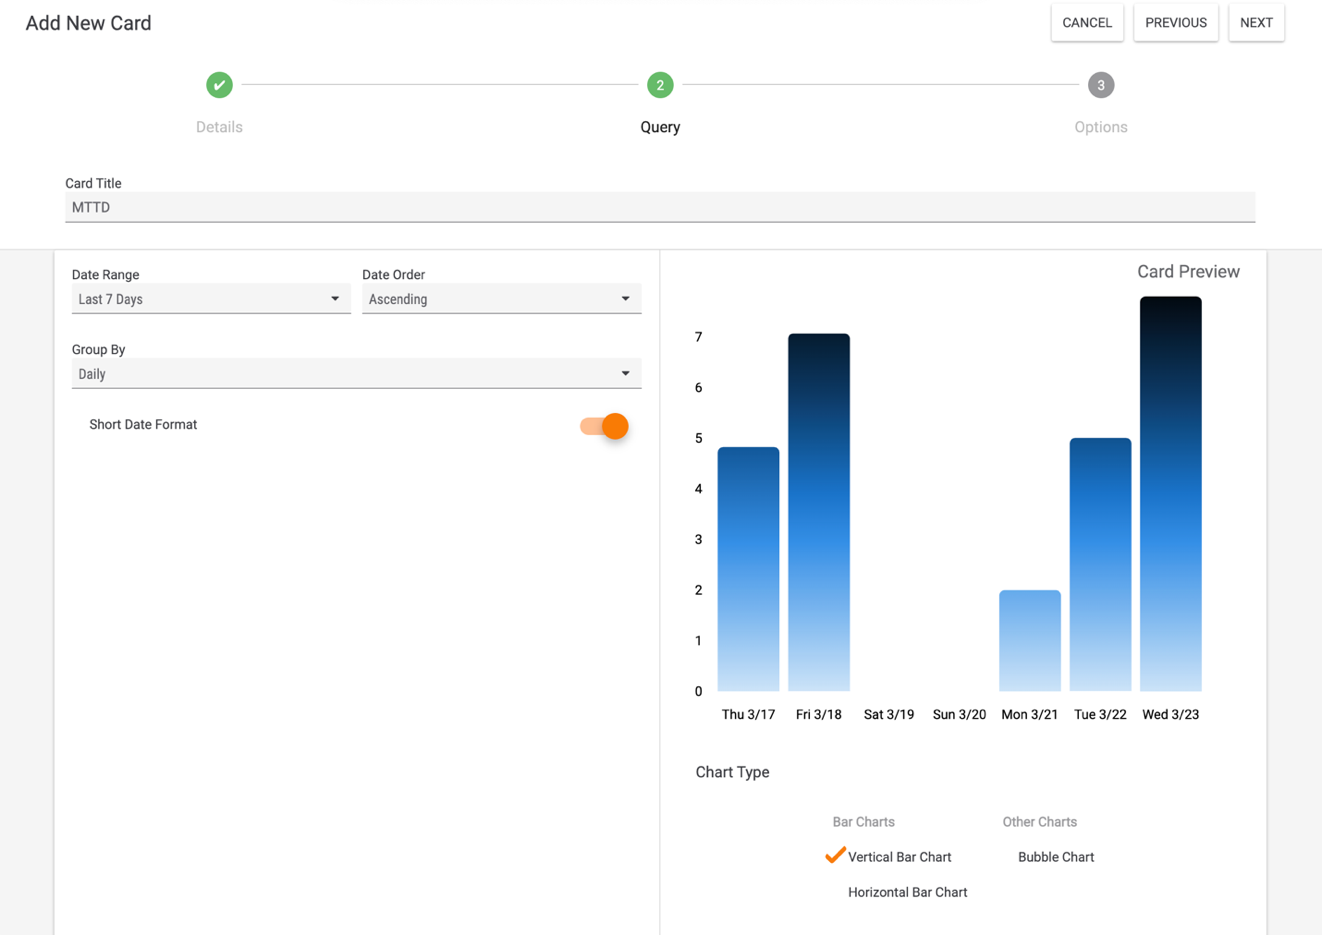
- Date Range: Select the period of time from which data will be displayed.
- Date Order: Select whether the dates displayed in the card should be in Ascending or Descending order.
- Group By: Select the desired grouping of dates displayed in the card. Available options include Daily, Weekly, and Monthly.
- Short Date Format: By default, dates are displayed on the dashboard card in short date format (e.g., Mon 12/6). Toggle this slider off to display dates in long date format (e.g., Mon December 06).
- Card Preview: This section displays a preview of the card.
- Chart Type: Select the type of chart to display.
- Click the NEXT button at the upper-right corner of the screen.
- The Options step will be displayed (Figure 2). Here, you can customize the look of the MTTD dashboard card.
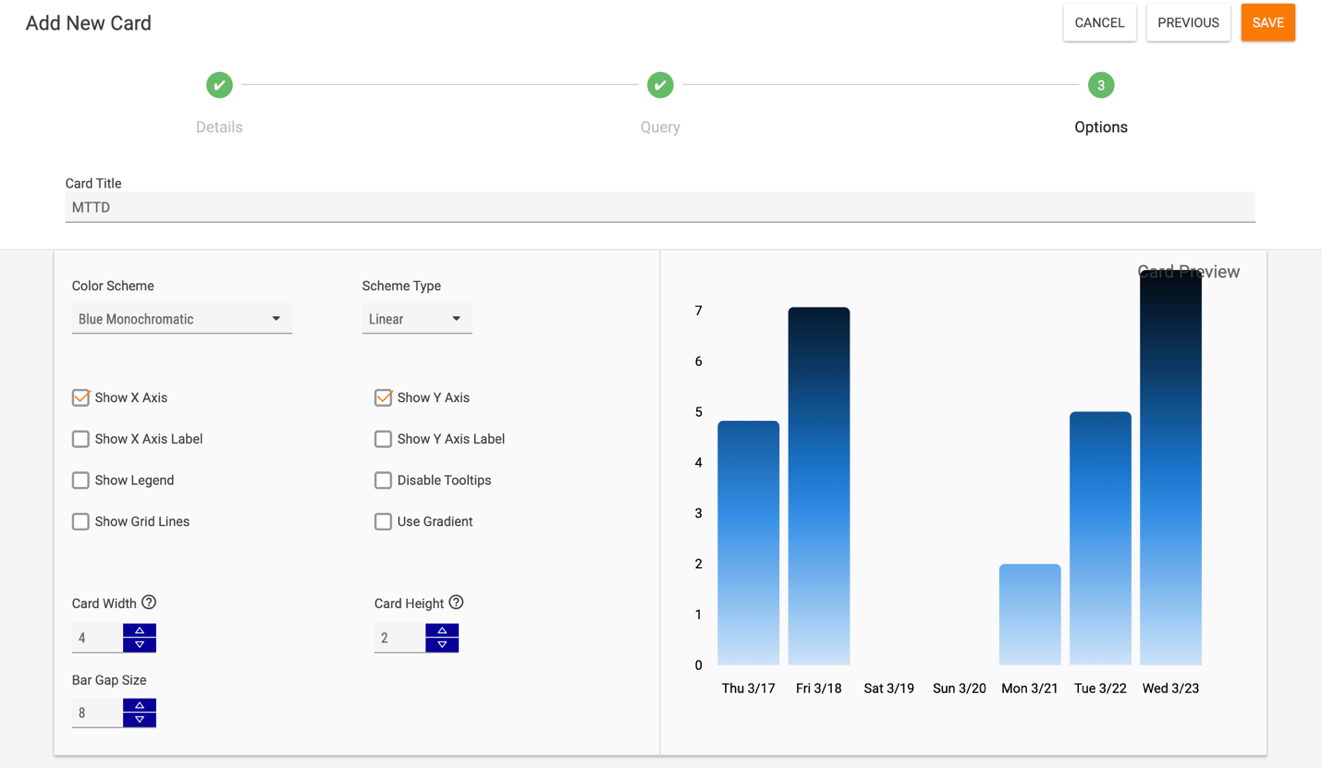
- Color Scheme: Select the color scheme for the card.
- Scheme Type: Select whether the color scheme should be Linear or Ordinal.
- Show X Axis: Select this checkbox to display the x-axis of the chart. This checkbox is selected by default.
- Show X Axis Label: Select this checkbox to display a custom label for the x-axis. After you select the checkbox, a text box will be displayed where you can enter the desired label.
- Show Legend: Select this checkbox to display a legend for the chart. After you select the checkbox, a text box will be displayed where you can enter a label for the legend.NoteThe three MTTD chart types (shown in the Card Preview section in Figure 1) do not display a legend’s label, so the value entered in the text box will not be displayed in the dashboard card
- Show Gridlines: Select this checkbox to display gridlines on the chart.
- Show Y Axis: Select this checkbox to display the y-axis of the chart. This checkbox is selected by default.
- Show Y Axis Label: Select this checkbox to display a custom label for the y-axis. After you select the checkbox, a text box will be displayed where you can enter the desired label.
- Disable Tooltips: By default, a tooltip is displayed whenever you hover over a piece of data on a dashboard card chart. Select this checkbox to disable this feature for the dashboard card.
- Use Gradient: A gradient effect is applied to the four False Positives chart types by default, so selecting the Use Gradient checkbox has no effect on this dashboard card.
- Card Width: Enter a number for the card’s width. The default width of a card is 4, and the maximum width you can set for a card is 16.
- Card Height: Enter a number for the card’s height. The default height of a card is 2, and the maximum height you can set for a card is 5.
- Bar Gap Size: Enter a number for the bar gap size, which is the amount of space between each bar in the graph.
- Click the SAVE button at the upper-right corner of the drawer. The MTTD card will now be displayed on the dashboard.
ThreatConnect® is a registered trademark of ThreatConnect, Inc.
20118-06 v.03.B
Was this article helpful?