Analyst Workload
- 24 Aug 2022
- 1 Minute to read
-
Print
-
DarkLight
Analyst Workload
- Updated on 24 Aug 2022
- 1 Minute to read
-
Print
-
DarkLight
Article Summary
Share feedback
Thanks for sharing your feedback!
Analyst Workload provides a graphical representation of the current total Case workload of individual users and the severity of those Cases.
- Select Analyst Workload on the Details step of the Add New Card drawer to display the Query step (Figure 1).
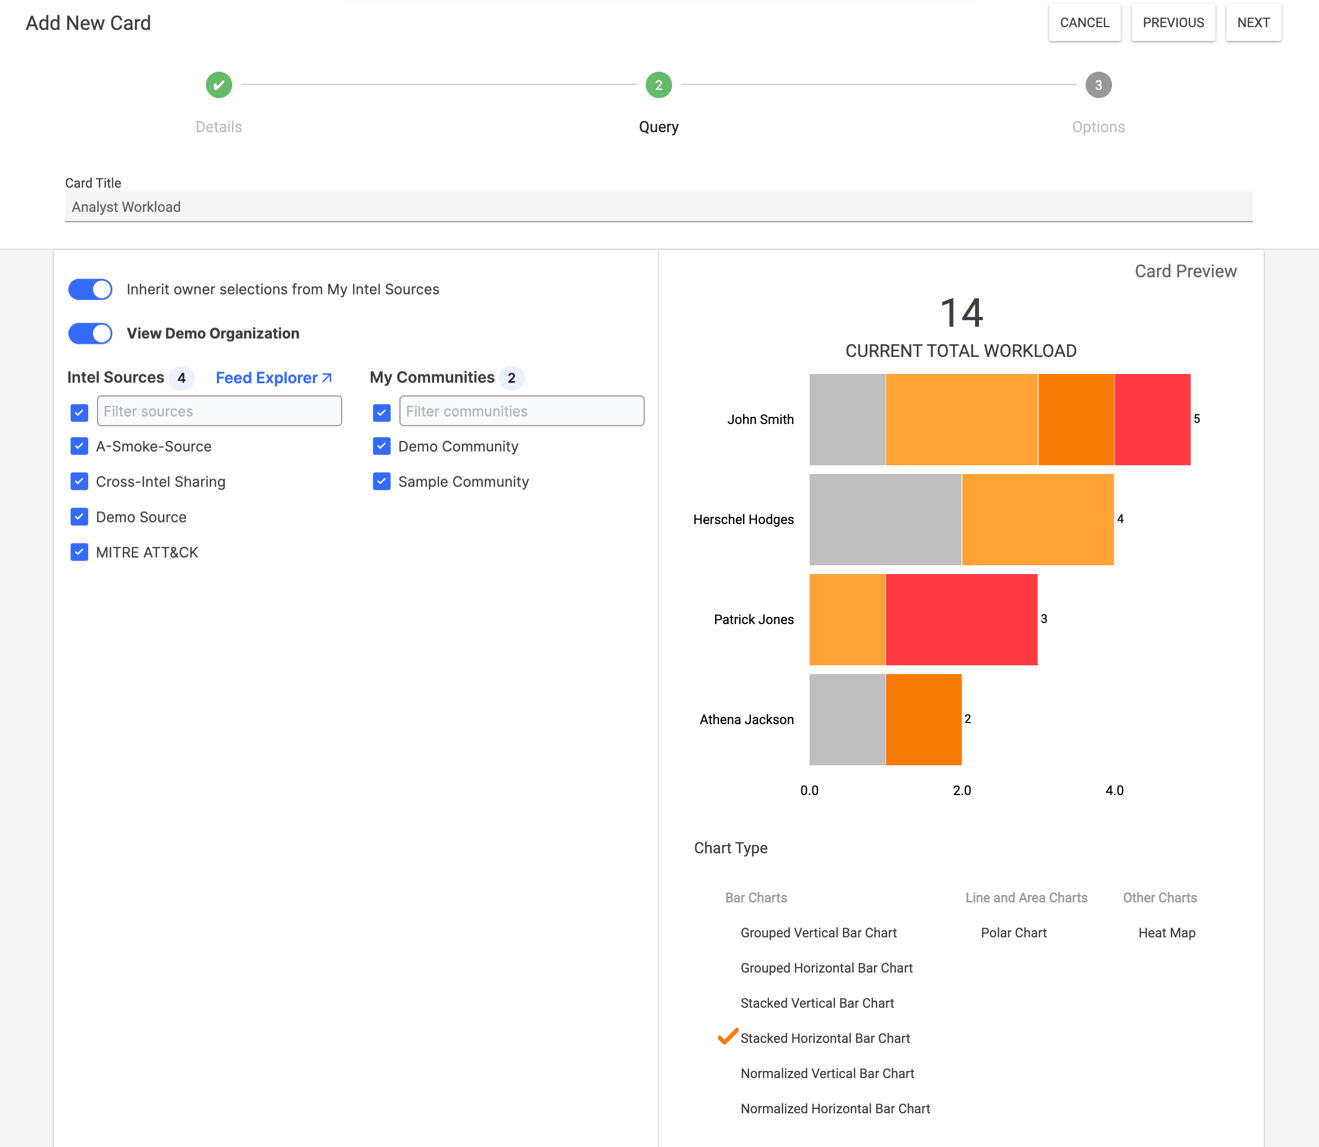
- Owners: Select the owner(s) whose data are to be displayed on the card. In order to circumvent permissions errors, toggle the Inherit owner selections from My Intel Sources slider off, clear all selections under Intel Sources and My Communities, and leave the View <Organization name> slider toggled on.NoteA My Orgs list will be displayed in place of the View <Organization name> slider for Super Users, which allows them to select the Organizations whose data are to be displayed on the card. See ThreatConnect Super User Guide for more information.NoteYou can select a single owner by hovering over the owner’s name and clicking
 only.
only. - Card Preview: This section displays a preview of the card.
- Chart Type: Select the type of chart to display.
- Click the NEXT button at the upper-right corner of the drawer.
- Owners: Select the owner(s) whose data are to be displayed on the card. In order to circumvent permissions errors, toggle the Inherit owner selections from My Intel Sources slider off, clear all selections under Intel Sources and My Communities, and leave the View <Organization name> slider toggled on.
- The Options step will be displayed (Figure 2). Here, you can customize the look of the Analyst Workload dashboard card.
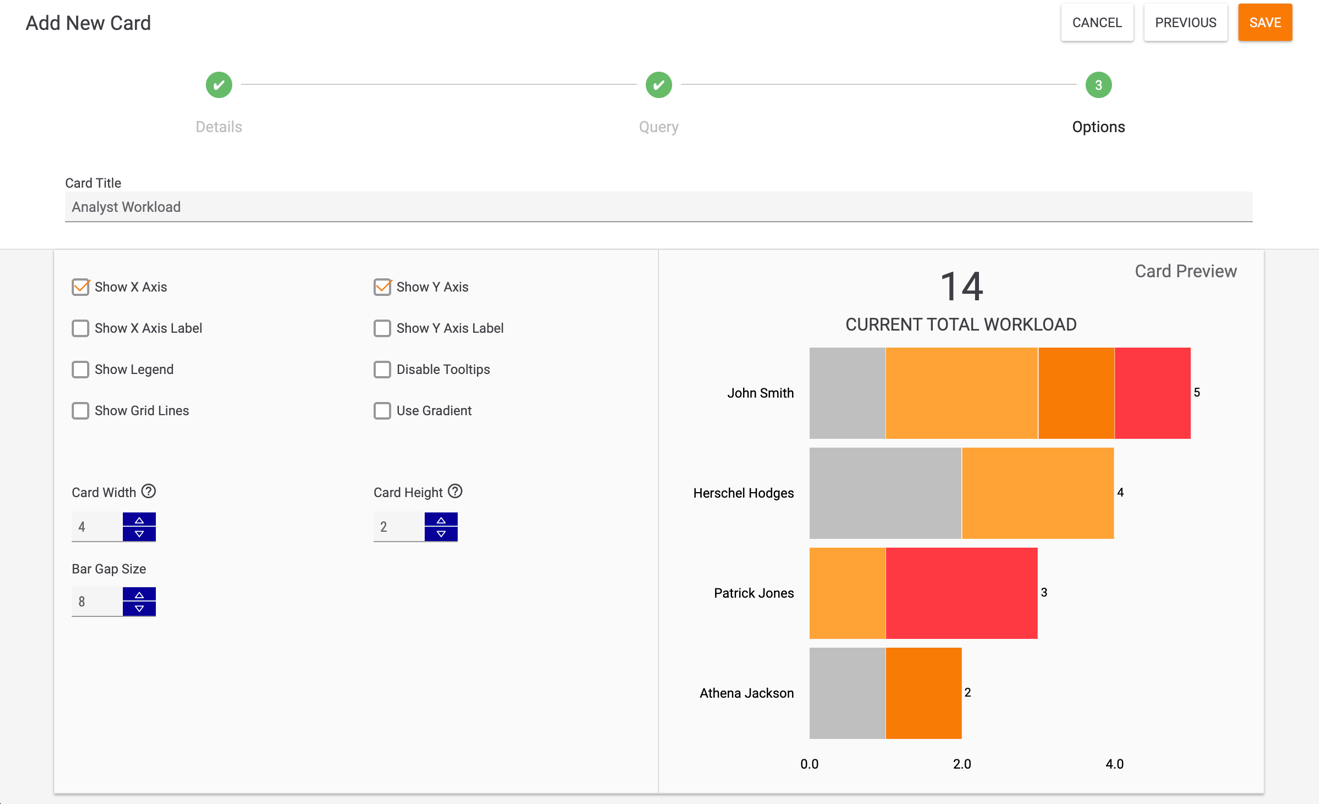
- Chart Configuration Checkboxes: Use the checkboxes to customize the look of the chart. The available options change based on the type of chart selected in the Query step (Figure 1). In this example (Stacked Horizontal Bar Chart), the Show Gridlines checkbox is displayed. However, if Heat Map is selected as the chart type, the Show Gridlines checkbox will not be displayed.
- Card Width: Enter a number for the card’s width. The default width of a card is 4, and the maximum width you can set for a card is 16.
- Card Height: Enter a number for the card’s height. The default height of a card is 2, and the maximum height you can set for a card is 5.
- Bar Gap Size: Enter a number for the bar gap size, which is the amount of space between each bar in the graph.
- Click the SAVE button at the upper-right corner of the drawer. The Analyst Workload card will now be displayed on the dashboard.
Note
For all chart types except Polar Chart, clicking a chart element on the Analyst Workload dashboard card that represents a set of Cases assigned to a user will open a filtered view of all open Cases assigned to that user in a new tab.
ThreatConnect® is a registered trademark of ThreatConnect, Inc.
20118-04 v.03.B
Was this article helpful?